Showing posts with label Biostatistics and Biometrics Open Access Journal. Show all posts

Wednesday, March 4, 2020

On A Boundary Value Problem for A Singularly Perturbed Differential Equation of Non-Classical Type-JuniperPublishers

Journal of Biostatistics and Biometrics-Juniper Publishers


Abstract

In a semi-infinite strip we consider a boundary value problem for a non-classical type equation of third order degenerating into a hyperbolic equation. The asymptotic expansion of the problem under consideration is construction is constructed in a small parameter to within any positive degree of a small parameter.

Introduction

Boundary value problems for non-classical singularly perturbed differential equations were not studied enough. We can show the papers devoted to construction of asymptotic solutions to some boundary value problems for non-classical type differential equations [1-3].
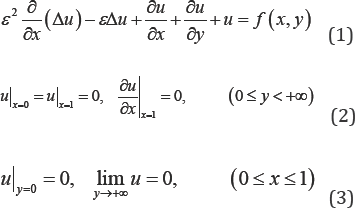
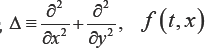
In this note in the infinite semi-strip  we consider the following boundary value problem
Where &>0 is a small parameter, is the given function.
The goal of the work is to construct the complete asymptotics in a small parameter of the solution of problem (1)-(3). When constructing the asymptotics we follow the M.I. Vishik LA & Lusternik [4] technique.
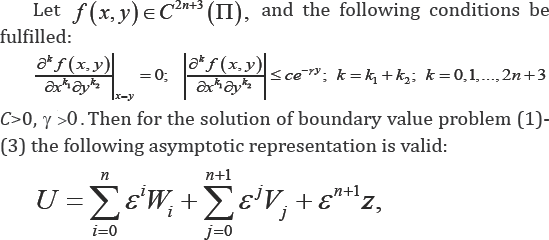
The following theorem is proved.
Theorem
where the functions Wi are determined by the first iterative process, Vj are the boundary layer type functions near the boundary x=1 determined by the second iterative process, en+1 Z is a remainder term, and for z we have the estimation
Where c1>0, c2>0 are the constants independent of e. References


To know more about Juniper Publishers

Wednesday, February 5, 2020

On Application of Markov Chain in Reducing the Gene of Albinism-JuniperPublishers

Biostatistics and Biometrics Open Access Journal


Abstract

A three state Markov Chain Model is used to determine the pattern of gene distribution on Albinism. We assumed that one of the parents (first parent) must be normal Homozygote person and the forces behind evaluation are brought to bare. This paper discovered that after six generations, the gene of the Albino will no longer be present in the population as all will be normal homozygote individuals.
Keywords: Mathematics Modelling; Markov Chain; Albinism; Autosomal Recessive
Abbreviations: ARD's: Autosomal Recessive Diseases; aa: Homozygote Affected; Aa: heterozygote affected; AA: Homozygote Normal

Introduction

Selection is one of the evolutionary forces which promotes adaptation and keep in checks the disorganizing effects of the order processes. Natural selection may be due to differential survival or differential fertility or both. According to Hoppensteadt & Peskin [1] that Fisher in his fundamental theorem of Natural selection in 1930 established a direct correlation between the amount of genetic variation in a population and the rate of evolutionary changes by natural selection mathematically with respect to fitness. Choji & Garba [2] established that the rate of increase in fitness of a population at any given time is equall to its genetic variation in fitness at the time. Relative fitness predicts the course of selection, that is, it predicts how gene frequencies will change Choji & Edemanang [3].
Autosomal recessive is one of the several ways that a trait or disorder is passed down through families. If a disease is Autosomal Recessive, it means you only need to get the abnormal gene from one parent in order for you to inherit the disease. One of the parents may afterwards have the disease. Furthermore, because a recessive deleterious gene produces its disease only in the homozygote, affected individuals must receive one mutant gene from each parent. Consequently, since recessively inherited diseases are usually rare in the population almost all homozygous affected individuals aroused from the mating of two heterozygous unaffected parents. Example of such Autosomal Recessive Disease are sickle cell anaemia, albinism etc. Myriad of researched carried on the reduction/control of Autosomal Recessive Diseases (ARD's) where tilted on the medical and biological aspect, as demonstrated by James & Clarke [4], Fred [5]. Nowadays, researchers are approaching the problem from mathematical point of view, the work of Choji & Edimanang [3] , Choji & Garba [2] gives another insight in approaching the problem, with more worked still to be done.
Albinism is a hereditary defect in the metabolism of melanin requiting in the congenital absence or major decrease of pigmentation in the skin, mucosa, hair and eyes. It is an Autosomal Recessive Disease that a career (that is a person carrying the gene/trait) can pass on to his next generation. Mathematical modelling has been observed along the years to play an essential role in science. Typically, one may give a state of the system at an initial time, and may be required to find out the state of the system at some future time. A typical model used for such situation is the Markov Chain model. Markov Chain Model can be used to characterized a sense of experiments in which the outcome of each experiment will depend only on the outcome of the immediate preceding experiments Choji & Garba [4].

Methodology

Markov chain model

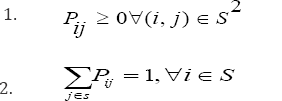
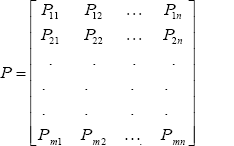
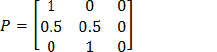
A Markov chain model is one of the vital tools used in stochastic process. The construction of Markov chain require two basic ingredients namely a “Transition Matrix” and an “Initial Distribution" [6]. So by definition of the transition matrix, we assume a finite set S, where = {1,..,m} are the m-states. Assign to each pair (i, j)òS2 of states a real number Pij such that the properties.
Are satisfied and define the transition matrix P by
Let (Xn)n ϵ N0 be a sequence of random variable with values in S. Here, n denotes the time at which the state Xn occurs. So far, we have only specified the ingredients for the evolvement of probabilities throughout the time. To complete the construction of Markov chain, we denote Ds as the set of discrete distributions on S, such that
Where we represent distribution as row vectors. We call P0 = (P0i)iϵS ϵ Ds the initial distribution of the chain {χn }nϵN0 if P [X0=1] = P0i∀states i ϵ S
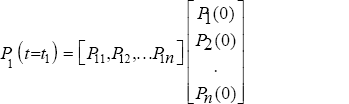
A discrete time Markov process is completely described by its square transition matrix P.Pij means that the probability of transition from state i to state Pi(0) j, implies that the probability of the system being in state 1 at time t = 0. The probability that the system in state 1 at t = t0 is given by
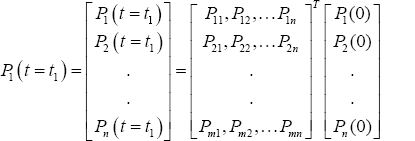
In general, we can write
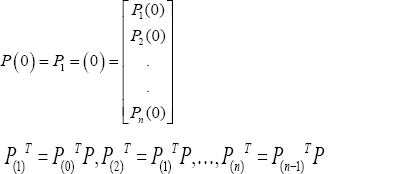
Where T indicates the transpose of the matrix or vector as the case may be Choji & Edemanang [3]. Probability state vector is a vector composed of state probabilities, which sum up to 1. A state is a situation that a process can assume at any given time and are mutually exclusive and exhaustive. If for instance pi (0) = 1 then pi (0) = 0 for i ,j = 1 ,2 ,3 and for I, j. Transition is matrix of conditional probabilities of moving from one sate to another. Subsequently, probability state vectors (PSV) can be obtained as follows
The Markov chain model for a three transition is given below
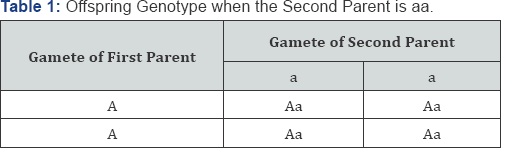
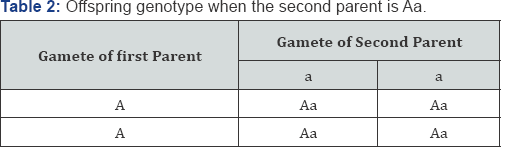
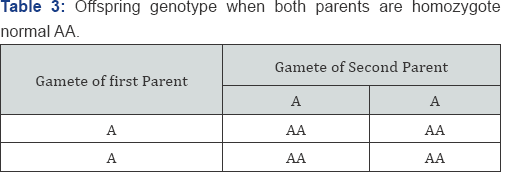
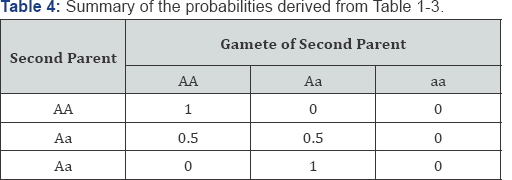
From Table 1 above, it is observed that when one of the parent is homozygote normal (AA) and the other is homozygote affect (aa), all the offspring will be heterozygote (Aa) but affected with the traits since the trait is autosomal recessive. We discovered from Table 2, that when one of the parent is normal (AA) and the other is heterozygote, Half of all the offspring will be heterozygote (Aa), and half will be normal (AA). From Table 3 above, we notice that when both parents are normal (AA), all the offspring will be normal with probability of 1. Table 4 above shows the probability of an offspring being in one of the three genotypes. For each possible genotype of the second parent, when the second parent is married to a homozygote normal first parent (AA), the probabilities take a matrix form as follows

Experimented result

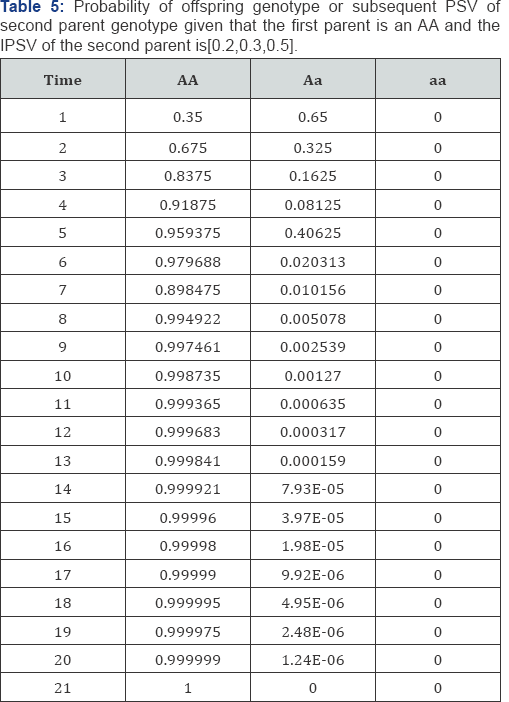
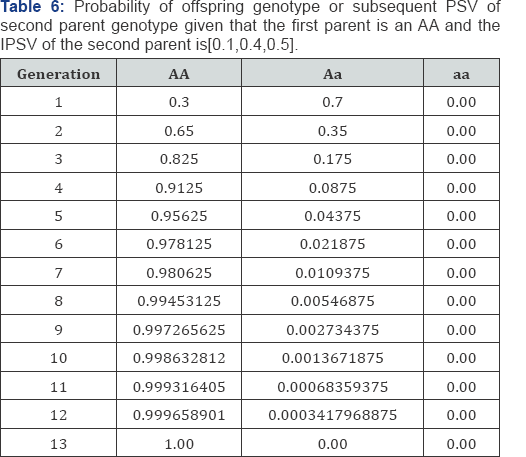
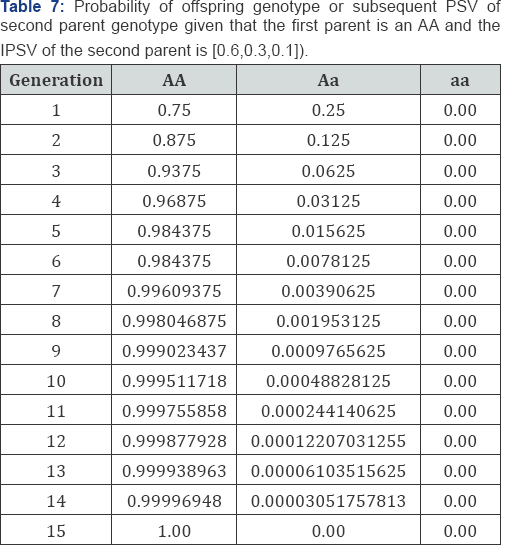
Numerical experiment: Let's consider a settlement that may have the following initial probability state vectors (IPSV) [0.2,0.3,0.5],[0.1,0.4,0.5]and[0.6,0.3,0.1] respecting P(1)T = P(0)TP for first generation p(i)T = p(i-1)TP and for any other generation , we obtained the data shown in the tables below for the probability state vector (PSV) movement pattern for the three genotypes.

Discussion & Results

From Table 1 above, it is observed that when one of the parents is homozygote normal (AA) and the other is homozygote affected (aa), all the offspring will be decisive. While in Table 2 half of the offspring will be heterozygote affected (aA) and half will be homozygote normal (AA) We discovered from Table 2, that when one of the parent is normal (AA) and the other is heterozygote, Half of all the offspring will be heterozygote (Aa), and half will be normal (AA). Similarly, we also observed in Table 3 that the offspring will be normal (AA) with probability of one (I) when parents are normal (AA). The result in Table 4 & 5, shows that equilibrium is reached after 12 generations for the probability of offspring genotype given that the first parent is [0.2,0.3,0.5] . And from Table 6, the result also indicates that equilibrium is attained after 12 generations for the probability of offspring genotype given that the first parents are . Consequently, in Table 7 the result also indicate that equilibrium is reach after 12 generations for the probability of offspring genotype given that the first parent is [0.1,0.4,0.5]

Conclusion


From the analysis, it is observed that in less than 12 generations, equilibrium is attained in the three instances. Also, in about six generations, the gene of albino was eliminated from the genotypes of the settlement. Under the condition given, it is obvious that whenever the initial probability state vector, the gene of albino will no more be in existence after the generation. This is true since each probability state vector tends to [0.0,0.0,00] . The result of the study shows that, after six generations, the population acquired a normal homozygote. Therefore, the three states Markov shows that after a number of generations, all people in the settlement will be homozygote normal.


Sunday, November 3, 2019

Ecological Methods of Assessing the Quality of The Environment in The Fluctuating Asymmetry of Birch Leaves-Juniper Publishers

Biostatistics and Biometrics Open Access Journal

Abstract

The methods of ecological assessment of the environmental quality of growing birch trees on fluctuating asymmetry of leaves after their stop in growth are briefly presented. In comparison with the average values of parameter measurements, each of the five leaves from at least three birches improves the accuracy of modeling and seven times reduces the complexity of measurements.
Keywords: three birches, on five leaves, 10 parameters, factor analysis, correlation coefficient, strong regularities

Introduction and Short Literature Review

In environmental technology is gradually coming to an understanding of the need for modeling relationships between the parameters of structure of plant leaves identification method [1]. Our Russian inventions refers to the engineering of biology and bioindication of the environment quality measurements of the growth of the organs of different plant species, mostly woody plants, for example, samples in the form of leaves of birch trees with a simple and small leaf blades.
The technical result is an increase in the accuracy of indication of the quality of the surrounding birch leaves of the local environment, as well as simplifying and improving the performance of measurements of leaf parameters. Thus, we completely restore the principle of individuality of biological measurements on the geometry of fluctuation of each sheet.

The method of measurement and analysis

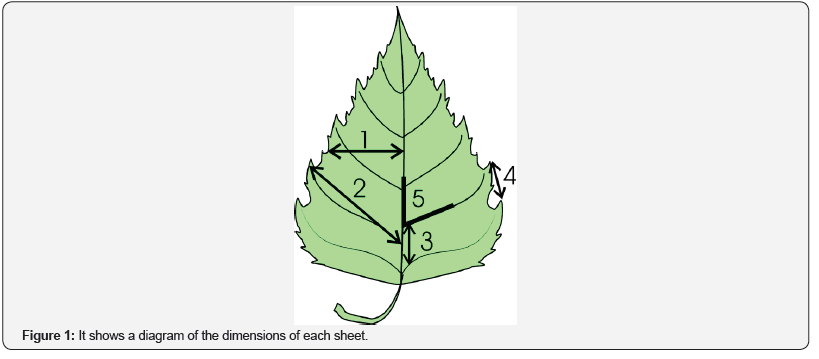
Figure 1 shows a diagram of the dimensions of each sheet: 1 - the width of the left b′ and right b′′ halves of the leaf (the measurement was carried out in the middle of the leaf blade), mm; 2 - length l′æ and l′′æ the second from the base of the leaf veins of the second order, mm; 3 – distance l′îñí and l′′îñí between the bases of the first and second veins of second order, mm; 4 – distance l′ê and l′′ê between the ends of these veins, mm; 5 – angle α′ and α′′ between the main vein and the second from the base of the leaf vein of the second order [2-8].
Collection of material should be carried out after stopping the growth of leaves (in the middle lane since July). For environmental assessment of anthropogenic impact on the territory take at least three birches in approximately the same conditions of growth, with each birch take at least five leaves of different sizes on the part of the estimated area, then the measurement of the five parameters of the sheet is carried out with the use of geodetic protractor with the price of dividing the measuring scale of 0.1 mm, with all at least 15 leaves are taken for the population of individual individuals, therefore, the table of measurement results without averaging the measured values is further compiled, and the resulting sample is statistically simulated and subjected to factor analysis to identify binary relations between 10 indicators, with all 100 biotechnical laws identified in the software environment CurveExpert-1.40 by the formula of the form

Antifungal resistance

where y - an indicator or a dependent quantitative factor (10 parameters for five indicators from two halves of the sheet); x - an explanatory variable or an influencing factor (the same 10 parameters from each sheet); 81...aa - the model parameters obtained by identification.
According to the results of factor analysis by identifying binary relations between 10 indicators perform environmental assessment of the territory by the coefficient of correlation variation, and then from 100 biotechnical laws are selected having a correlation coefficient of at least 0,7 and consider pairwise five parameters of the sheet, as well as environmental assessment is carried out by differences between the structure and parameters of specific equations.

The results of the measurements in a clean area of the city of Zvenigovo Republic of Mari El

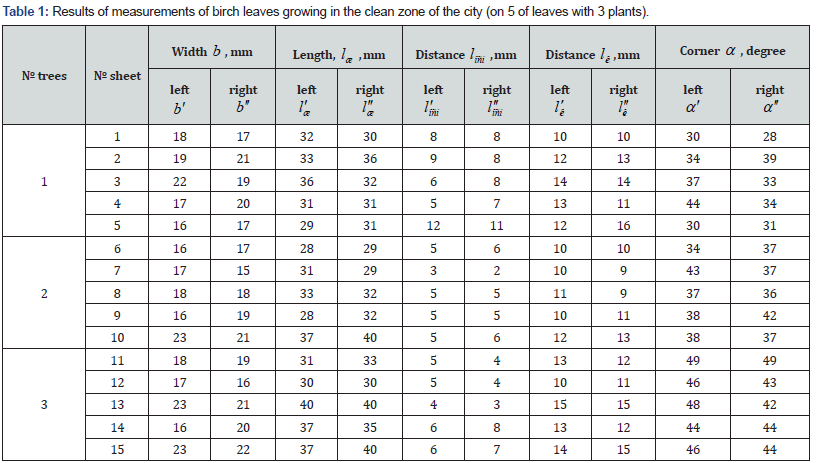
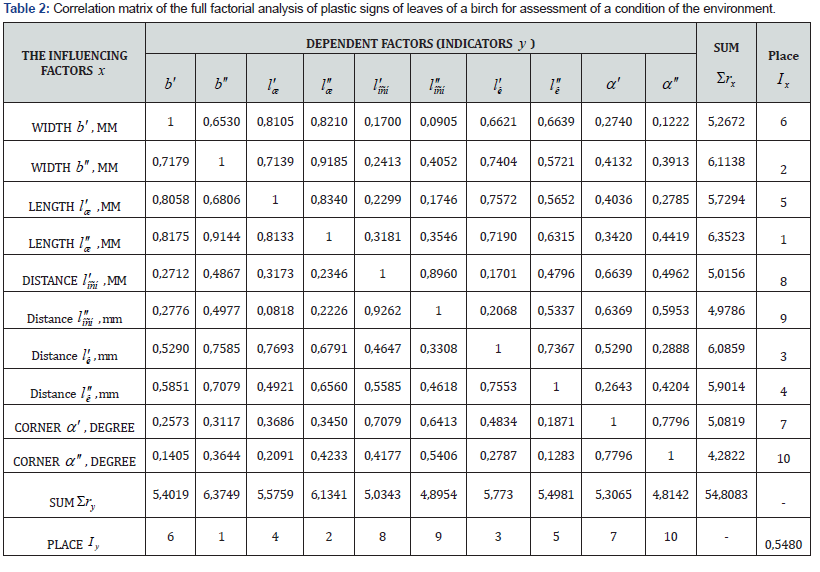
According to the principle of individuality of each leaf, the results of measuring the parameters of 15 leaves of only three birches in a clean area are listed in Table 1. Full factorial analysis includes 10 factors and 102 = 100 factor relations. For all of them the equation has the form of (1). The correlation matrix of the factor analysis for assessment of a condition of the environment is given in Table 2. The coefficient of correlation variation of the ecological set of 15 leaves (5 leaves from 3 trees) is 54,8083 / 102 = 0,5480. This criterion is used when comparing different sampling sites of birch leaves. In comparison with Table 2, variability in fluctuating asymmetry increased significantly, as 0.5480.

Analysis of binary relations between factors

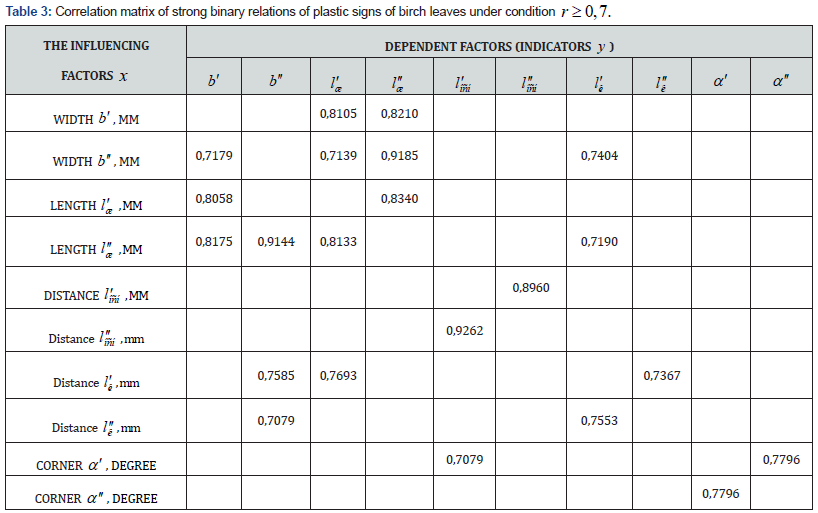
To do this, we exclude monarny relations from the data 1, we leave only binary relations with strong factorial relations (Table 3). There are 22 strong binary dependencies left. The formula l′′îñí→l′îñí has the highest strength. The distance between the bases of the first and second veins on the right side of the leaves most affects the distance between the bases of the first and second veins on the left side of the leaves.
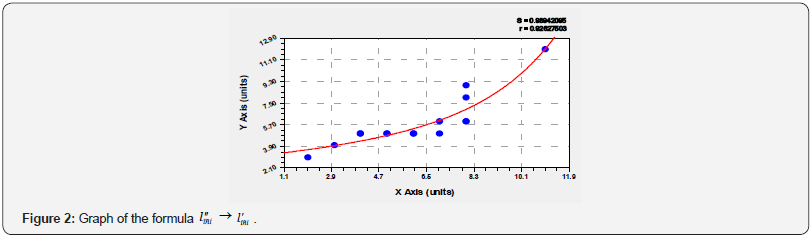
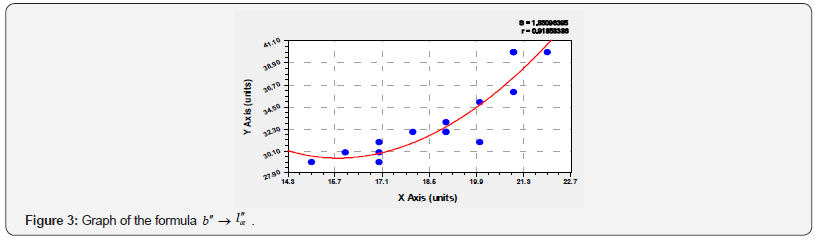
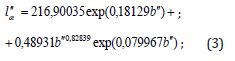
For example, Figure 2 shows a graph of the effect of îñíl′′→îñíl′ the distance between the bases of the first and second veins on the right side of the leaves by the distance between the bases of the first and second veins on the left side of the leaves when measured by the proposed method on 15 leaves in three birches. Figure 3 shows a graph of the result b′′→æl′′ of the influence of the width on the right side of the leaves on the length of the second vein on the right side of the leaves.
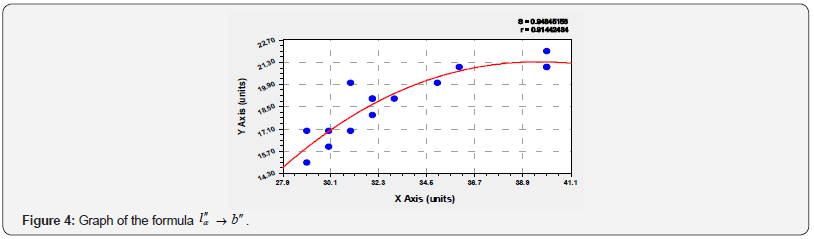
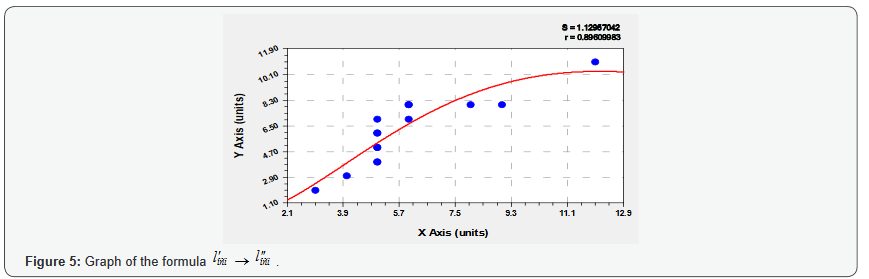
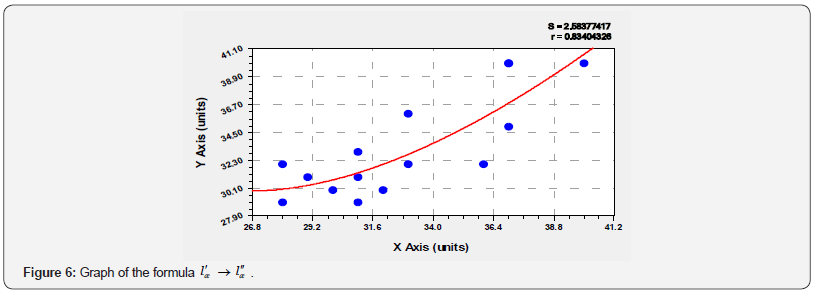
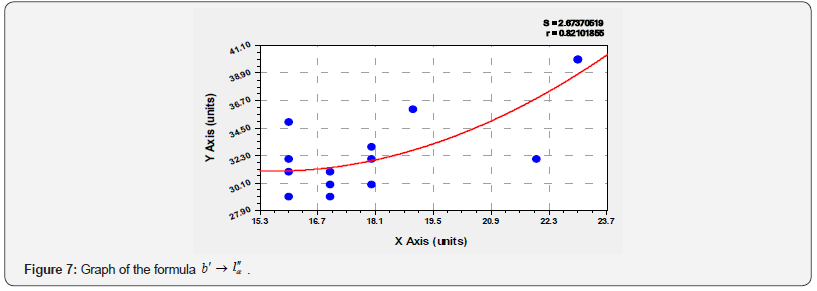
On Figure 4 - graph of the result l′′æ→b′′ influence of the length of the second vein on the right side of the leaves on the width on the right side of the leaves. On а Figure 5 shows the graph of the result l′îñí→l′′îñí of the influence of the distance between the bases of the first and second veins on the left side of the leaves on the distance between the bases of the first and second veins on the right side of the leaves. On a Figure 6 - graph of the result l′æ→l′′æ influence of the length of the second vein on the left side of the leaves on the length of the second vein on the right side of the leaves. On a Figure 7 shows the graph of b′→l′′æ effect of width on the left side of leaves on the length of the second vein on the right side of leaves.

Comparison of the proposed methods with the prototype

Thus, the comparison shows that the proposed information technology for processing the values of the same parameters in individual leaves 57 / 22 = 2,59 times stricter than the prototype. The correlation coefficient is also 0,7538 / 0.5480 = 1,38 times less, which indicates better variability. Therefore, it can be concluded that the adoption of the arithmetic mean values of the parameters of birch leaves up to 100 (10 trees for 10 leaves) is artificial, smoothing the variability of fluctuating asymmetry. In reality, it is much more variable.
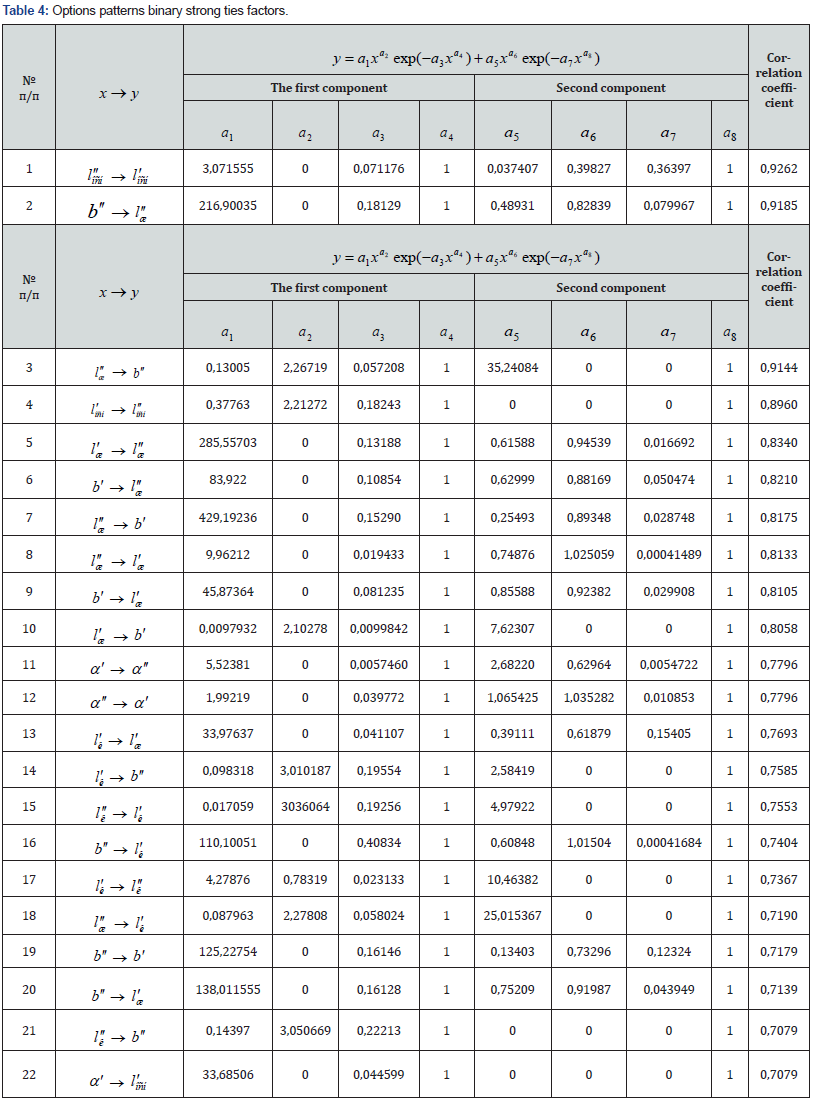
All 22 strong links in Table 3 are arranged without the loss of a row and form a geometric pattern. This fact also points to the application of the principle of individuality, that is, without averaging the results of environmental measurements. Write out the formula 22 binary factor strong ties, ranging in Table 4 in descending order of correlation coefficient.
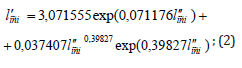
Matrix representation of the model (1) is compact, but for clarity we will write the first three binary relationships separately in the form of formulas:
• Effect of the distance between the bases of the first and second veins on the right side of the leaves on the distance between the bases of the first and second veins (Figure 2) on the left side of the leaves
• Effect of width on the right side of the leaves on the length of the second vein (Figure 3) on the right side of the leaves
• The effect of the length of the second vein on the right side of the leaves on the width on the right (Figure 4) side of the leaves

Conclusion

Thus, fluctuating asymmetry can be captured by statistical modelling from a much smaller volume of measurements. The smallest volume of measurements we recommend 15 (three trees of five different leaf sizes from different places). This will reduce the volume of measurements 100 / 15 ≈ 7 times. However, this increases the accuracy of the analysis of fluctuating asymmetry. The advantage of the proposed method is the technical simplicity of execution, since the equipment requires only a measuring pair of compasses and surveying protractor with scale division 0,1 mm. Therefore, the invention can be widely implemented in school environmental clubs, school forestries, and even kindergartens, as well as in geographical and other expeditions with additional study of the quality of the territory on the properties of the leaves of the birch trees.

To Know More About Biostatistics and Biometrics Open Access Journal  Please click on:
 
To Know More About Open Access Journals Please click on: ttps://juniperpublishers.com/index.php

Wednesday, October 16, 2019

Design of A Roadmap for Implementing A Quality Approach At ONS-Algeria-Juniper Publishers

Biostatistics and Biometrics Open Access Journal

Abstract

The rapid changes in Algeria have had and continue to have a profound impact on infrastructure, economic agents and the population as a whole. These transformations have already turned the statistical landscape upside down and will continue to do so. In fact, the need for statistical data has changed and evolved in terms of the nature of the statistics, on one hand, and requirements regarding availability, quality and time, on the other hand. Starting from the context described above, the development of ONS-Algeria’s quality approach is essentially based on the capitalization of the work of cooperation with Eurostat on the principles of the European Quality Assurance Framework for Official Statistics (QAF), the option for a participatory and transparent process to enrich this approach and facilitate its appropriation and lastly, conducting the process in stages. In driving the process step by step, to optimize its management, our paper will address the issues related to the design of a roadmap for implementing the Code of Practice (CoP) for the ENP south countries.
Keywords: Code of practice; Implementation challenges; Quality management; ENP South countries
Abbrevations: QAF: Quality Assurance Framework for Official Statistics; Code of Practice; GSBPM: General Statistical Model of The Operational Process; METIS: Statistical Metadata; SAQ: Self-Assessment Questionnaire; CPI: Consumer Price Index

Introduction

The rapid changes in the country have had and continue to have a profound impact on infrastructure, economic agents and the population as a whole. These transformations have already turned the statistical landscape upside down and will continue to do so. In fact, the need for statistical data has changed and evolved in terms of the nature of the statistics, on one hand, and requirements regarding availability, quality and time, on the other hand [1-3]. Starting from the context described above, the development of our quality approach is essentially based on the following three principles:
a. The capitalization of cooperation initiatives with Eurostat on the principles of the European Quality Assurance Framework for Official Statistics (QAF);
b. The choice of a participatory and transparent process to enrich this approach and facilitate our making it our own;
c. And lastly, conducting the process step by step, in order to optimize its steering.

Approach

It should be noted that ONS takes into account quality guidelines in the performance of its processes according to international standards. Indeed, ONS participates in the work of the South Mediterranean Quality Working Group and contributed to the development of the Regional Code of Practice (CoP) (ENP-South) [4].
In tandem with the “classical” quality approach, which requires rapid and intense mobilization of resources, and referring to the QAF guidelines, the quality approach adopted by ONS, based on the CoP, is a step-by-step and progressive quality approach. It is organized around four levels of a step by step implementation:
I. Recurring surveys
II. Structural surveys
III. Major operations such as census
IV. The institution
As each survey phase is a potential source of errors, it is necessary to analyze the different processes within each phase, to determine the errors and to find the methods to eliminate them or to reduce them.
Even though ONS applies control actions in carrying out these surveys, a well-defined quality control system is needed and is part of the projects carried out by the quality unit. In fact, the control actions to be integrated into the production process to improve the quality of the data are:
a. Preventive control actions are put to practice to prevent errors from being verified: we act on the sources of errors.
b. Ongoing control actions are applied to monitor and correct errors while performing a survey. One can find tools and methods to identify errors when they are verified and to limit their effects on the survey results.
c. A posteriori evaluation actions are those operations that make it possible to measure errors directly or indirectly, and in particular control surveys carried out after data collection.
Therefore, all of these control actions represent the quality control system of a survey. For this reason, when designing and conducting a survey, part of the budget must be reserved for data quality control actions.
In addition, the use of the general statistical model of the operational process (GSBPM), developed by the UNECE/Eurostat/OECD working group on Statistical Metadata (METIS), to document our statistical operations. Indeed, the GSBPM has been developed to provide a standard framework for the operational processes required to produce official statistics. The GBSPM can also be used to integrate standards relating to data and metadata, as a model for process documentation for the harmonization of statistical IT infrastructure, and to provide a framework for assessing and improving the quality of data: it is a representation model of the statistical process. Quality being considered as an overarching process, this model highlights the principle that quality must be integrated at every stage, combined with the notion that quality is multidimensional. Hence, this model is defined by the aspects related, on the one hand, to the quality of the statistical data (relevance, accuracy, etc.) and, on the other hand, to the quality of the process (precision of needs, design, implementation, execution and evaluation) [5,6].

Implementation

In order to ensure that the implementation, of the quality approach at ONS, is rigorous; we base its framework on the following manuals:
i. Quality Assurance Framework (QAF): defining the principles of the quality system.
ii. Code of Practice (CoP): defining the indicators measuring the implementation of the quality system.
iii. The Self-Assessment Questionnaire (SAQ): measuring the implementation of the quality system at two levels:
• Institutional
• Process.
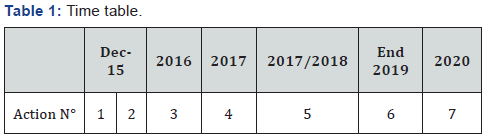
To achieve these objectives, the stages/actions of the gradual implementation of our quality approach could be broken down as follows (Table 1):
i. A clear display (website, notes to the technical and regional departments) of the Commitment on Quality by Top Management.
ii. The designation of the technical staff assigned to the unit in charge of quality support and communication with the technical departments.
iii. The presentation of quality tools and related documentation by the Quality Unit, under the control and with the support of Top Management, to the technical departments.
iv. The implementation of the GSBPM to document the collection processes for the Consumer Price Index (CPI) and the labor force surveys, and other surveys deemed appropriate by Top Management.
v. The implementation of the SAQ by the structures that applied the GSBPM.
vi. The implementation of the GSBPM and SAQ for the population census.
vii. A self-evaluation process through the implementation of the SAQ by the institution.

Conclusion

We should note that executives tend to have a relatively rosy view of how well-defined their culture is and how nicely it is performing. Those in quality management who are closer to where the rubber meets the road have a dimmer view. Without consensus on what’s broken and how bad it is, there will be disagreement on what to fix. Such discoveries shouldn’t be news to anyone who has lead or is aspiring to achieve a strong and sustainable culture of quality excellence.
Hence, at ONS we are aware that it would be especially helpful if suggestions were woven together to answer at least a few important questions and improve our approach:
a. Are there any details missing in the approach that must be understood for a successful culture of quality? b. Because understanding users is critical to guiding success, is there some intuitive framework or method accessible to management and quality practitioners alike?
c. Is there a quick, easy, and practical way to determine how well top management and the rest of the organization agrees on the cultural characteristics of excellence?
d. Would such a cultural assessment be enough to inspire consensus for action?
Furthermore, from the first stages of implementation, three guidelines that rise to the top and are strongly related to each other:
I. All employees must apply the key elements of any strategy for building a quality culture.
II. Closely understand user expectations so we can focus and give them what they want.
III. Develop a formal quality policy, common language, and leader behaviors as deployment mechanisms.
We do understand that changing our culture to integrate quality excellence is not an easy process. We’ll have good days and bad days, progress and setbacks. We have to keep going when change is hard as we are inspired by this Henry Ford’s quote: “One of the greatest discoveries a man makes, one of his great surprises, is to find he can do what he was afraid he couldn’t do.” 

To Know More About Biostatistics and Biometrics Open Access Journal  Please click on:
 
To Know More About Open Access Journals Please click on: ttps://juniperpublishers.com/index.php


Friday, June 7, 2019

Design of A Roadmap for Implementing A Quality Approach At ONS-Algeria-Biostatistics and Biometrics Open Access Journal-Juniper Publishers

JUNIPER PUBLISHERS-Biostatistics and Biometrics Open Access Journal


Design of A Roadmap for Implementing A Quality Approach At ONS-Algeria


Authored by Tarik Bourezgue*

The rapid changes in Algeria have had and continue to have a profound impact on infrastructure, economic agents and the population as a whole. These transformations have already turned the statistical landscape upside down and will continue to do so. In fact, the need for statistical data has changed and evolved in terms of the nature of the statistics, on one hand, and requirements regarding availability, quality and time, on the other hand. Starting from the context described above, the development of ONS-Algeria’s quality approach is essentially based on the capitalization of the work of cooperation with Eurostat on the principles of the European Quality Assurance Framework for Official Statistics (QAF), the option for a participatory and transparent process to enrich this approach and facilitate its appropriation and lastly, conducting the process in stages. In driving the process step by step, to optimize its management, our paper will address the issues related to the design of a roadmap for implementing the Code of Practice (CoP) for the ENP south countries.

For Read More... Fulltext click on: https://juniperpublishers.com/bboaj/BBOAJ.MS.ID.555721.php

For More Articles in Biostatistics and Biometrics Open Access Journal Please Click on:
https://juniperpublishers.com/bboaj/index.php

For More Open Access Journals In Juniper Publishers Please Click on:

Friday, March 8, 2019

The Analytical Covariance Matrix for Regime - Switch in Models--Biostatistics and Biometrics Open Access Journal- Juniper Publishers

JUNIPER PUBLISHERS-Biostatistics and Biometrics Open Access Journal


The Analytical Covariance Matrix for Regime - Switch in Models


Authored by Andrea Beccarini*

This letter provides an analytical solution for the covariance matrix related to the (mean) parameters of the standard Markov-switching model. The importance of avoiding numerical procedures to estimate this matrix is also highlighted. Simulations are also performed in order to verify, in small samples, the actual advantage of the analytical formula. The seminal paper of Hamilton [1] provides a very attractive way to estimate regime-switching parameters of a model where the latent variable governing the regime switching enters the model without its lags. In this case, closed form solutions for these estimates are available. Surprisingly, Hamilton and the subsequent applied and theoretical literature do not consider a closed form solution for the related covariance matrix. Thus, the covariance matrix is generally found by numerical procedures whose aim is generally to estimate both the point Markov- switching (M-S) estimates and their covariance matrix in the maximum likelihood (ML) framework.

However, in this context, the use of numerical procedures for finding point estimates and the related covariance matrix are not efficient. In fact, point estimates are found by closed form solutions. Consequently, having available an analytical calculation for the covariance matrix casts doubts on the rationale of the application of numerical procedures. They turn out not only to be inefficient with respect to their analytical counterparts but also ineffective as they are based on approximations.


For More Articles in Biostatistics and Biometrics Open Access Journal Please Click on:

For More Open Access Journals In Juniper Publishers Please Click on:


Use of Aqueous Extract and Essential Oil of Citrus Aurantifolia Leaves in the Protection of Vegetables- Juniper Publishers

  Nutrition and Food Science- Juniper Publishers Summary Our study is devoted to the valorization of the essential oil and the aqueous extra...