Monday, August 10, 2026

Acute Hematocrit Change as an Indicator of Intracranial Hemorrhage on Neonatal Head Ultrasound- Juniper Publishers


Intellectual & Developmental Disabilities- Juniper Publishers

Abstract

Purpose: To determine whether an indication related to a decrease in hematocrit is predictive of an intracranial hemorrhage (ICH) on neonatal head ultrasound (HUS).

Methods: This was a single center retrospective study of 215 neonatal head ultrasounds (HUS). The association between an ICH on HUS and indication related to hematocrit, a change in hematocrit in the 48 hours prior to HUS, gestational age, number of days since birth at time of HUS, designation of prematurity, or abnormal neurologic exam were examined.

Results: Thirty-seven (37/215, 17.2%) neonates had an ICH on their HUS. There was no significant association between studies that were ordered with an indication related to hematocrit (or similar indication) and the likelihood of having an ICH on HUS (OR 0.92, p=0.82). Lower gestational age, prematurity, and lower birthweight were associated with an ICH on HUS (p<0.05), but only gestational age remained statistically significant in a multivariable model (p<0.005).

Conclusion: Neither a decrease in hematocrit in the preceding 48 hours, nor an indication related to a decrease in hematocrit, was predictive of an ICH on HUS. Rather, prematurity, lower birth weight, early gestational age, and younger age were significantly associated with the presence of an ICH on neonatal HUS.

Keywords: Hemorrhage; Neonate; Ultrasound; Hematocrit; Prematurity

Introduction

Intracranial hemorrhage (ICH) is a devastating cause of neonatal morbidity and mortality that can result in substantial adverse outcomes during an important window for neurodevelopment. Prior investigations have shown that ICH is typically associated with prematurity (defined as a neonate born prior to 37 weeks), low birth weight, and anticoagulation [1,2]. Subdural and intraparenchymal hemorrhages are more commonly found in term infants, primarily related to birth trauma, while the most common type of intracranial hemorrhage in premature infants are germinal matrix hemorrhages (GMH) [3-5]. GMHs occur in preterm infants due to the thin-walled vessels found at the germinal matrix which are more susceptible to hemorrhage in the setting of hemodynamic changes [6-10]. The clinical data has shown that the majority of GMHs are identified during the first 4 days of life, with 40% detected within the first 5 hours of birth [2, 11-12]. GMHs are graded based on their severity as described in a landmark paper in 1978 (see Figure 1) [13]. Although most grade 1 and 2 GMHs are managed with observation, higher grade hemorrhages are associated with substantial neurodevelopmental sequelae, significant disability, and poor survival rates [14,15].

Head ultrasound (HUS) is the most common first line technique for imaging neonates suspected of having an ICH [16]. HUS affords real-time assessment of the brain using the fontanelles as a sonographic window. However, it is not always clear which neonates warrant an evaluation with HUS for ICH. We have observed that HUS are often ordered to look for an ICH when a change in hematocrit or hemoglobin has occurred on routine labs. But to our knowledge, no study to date has evaluated whether HUS ordered for indications related solely to a decrease in hematocrit are more likely to reveal an ICH than those ordered for alternative indications. The purpose of this study was to determine whether a decrease in hematocrit or a similar HUS indication (e.g., decrease in hematocrit or hemoglobin, bleeding, anemia, etc.) was predictive of an ICH on neonatal HUS.

Materials and Methods

This was a retrospective study of neonates that underwent HUS from 2009-2018. This study was conducted in accordance with the Declaration of Helsinki with approval by our Institutional Review Board. A waiver of informed consent was granted due to the retrospective nature of this work.

The PACS (Picture Archive and Communication System) at our institution (Centricity, General Electric) was searched using two search filters: head ultrasound, and the year (2009-2018). The indications for the head ultrasound examinations (HUS) were consecutively reviewed for any terms that were related to a decrease in hematocrit (or similar indication), including the following: “low”, “decreased”, “drop in”, “fall in”, or “dropping” hematocrit or hemoglobin, “hemoglobin drop”, “hematocrit drop”, “HH drop”, “bleeding”, or “anemia.” This resulted in approximately 116 patients with an indication for HUS that was related to a decrease in hematocrit or hemoglobin. A random sample of 101 patients from the same time period with indications unrelated to hematocrit, hemoglobin, bleeding, or anemia were selected for inclusion as a comparison group. The images of all HUS were initially reviewed, and a radiology report was generated by a board-certified radiologist to determine whether or not an ICH had occurred. The reports and images were then later reviewed by another board-certified radiologist for agreement of imaging findings. If there was concurrence of HUS findings, the examination was included in the study; if there was disagreement on HUS findings, the examination was excluded from the study. Only two HUS examinations were excluded from this study (2/217 = 0.9%). Those patients with an ICH on HUS (37/215 =17.2%) were then further classified into one of four groups based on known GMH grading (see Figure 1) [13].

The electronic medical records of the 215 patients included in this study were then reviewed and the following clinical data were collected: the change in hematocrit in the 48 hours prior to and at the time of HUS, whether or not there was a decrease in the hematocrit lab value in the 48 hours prior to HUS, the gestational age (GA) in weeks, whether the patient was classified as premature (< 37 weeks) or not (≥37 weeks), the birth weight in kilograms, the number of days since birth, and whether the result of a neurologic examination was abnormal or normal when it was performed. Premature neonates were further subclassified as term (>37 weeks), moderately preterm (32-37 weeks), very preterm (28-32 weeks), and extremely preterm (<28 weeks).

Statistical Analysis

The association between the presence or absence of an ICH on the HUS and each of the clinical and demographic independent variables was then analyzed using separate univariable logistic regression models to estimate the odds ratios (OR) and 95% confidence intervals. A multivariable model was constructed to evaluate the association between the likelihood of an ICH on HUS and an indication related to a decrease in hematocrit (or similar indication) as well as any clinical or demographic factors that had been statistically significant in univariable analysis.

Separate linear regression models were used to assess whether the magnitude of the change in hematocrit was associated with the category of prematurity (i.e., moderately or very or extremely preterm vs. term) or the grade of ICH on HUS (i.e., Grade 4 or 3 or 2 vs. 1). Similarly, a logistic regression model was constructed to assess whether the presence or absence of a measured drop in the hematocrit lab value was associated with the category of prematurity. A p-value of <0.05 was considered statistically significant. All statistical analyses were completed in Stata (version 16.0, College Station, TX).

Results

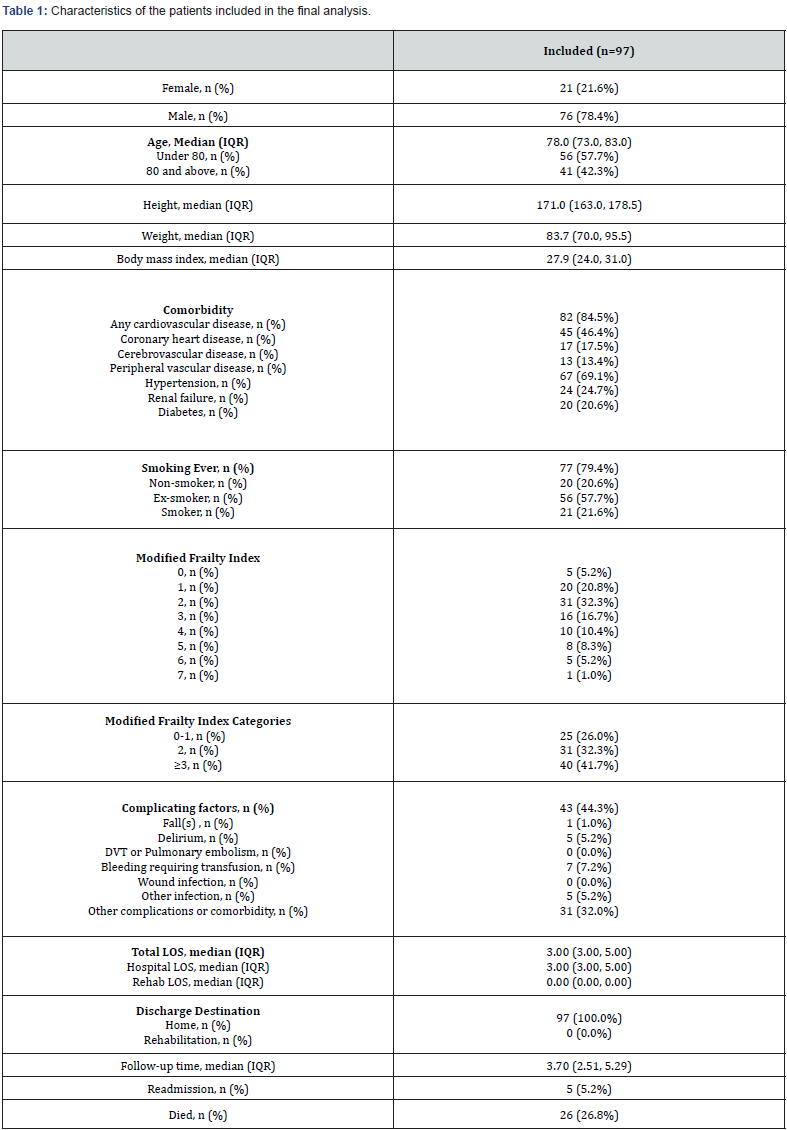
A total of 215 patients were included in our study, 112 male (52%) and 103 (48%) female. A total of 37/215 (17.2%) of patients had an ICH on HUS. The mean gestational age (GA) at birth was 32.6±5.4 weeks with a median of 34 weeks (Interquartile range 27, 37). The mean age at the time of HUS was 21.3±41.6 days with the median at 7 days (Interquartile range 2, 18). A majority of patients included in the study were premature, or < 37 weeks old at the time of birth) (145/192, 75.5%), and the average birthweight was 2.05±1.39 kg with a median of 1.9 kg (Interquartile range 0.9, 2.9) (Table 1).

There were 114/215 (53%) patients with an indication related to a decrease in hematocrit (or similar indication) and 101 patients with indication unrelated to hematocrit drop (Figure 2). Of those with a decrease in hematocrit, 19/114 (17%) had an intracranial hemorrhage and 95/114 (83%) did not. Most of the patients with an ICH were premature (32/36, 89%), and most patients with an ICH were ≤ 7 days old at the time of HUS (28/37, 75.7%).

Table 2 shows the association of each of the clinical or demographic factors with the presence or absence of an ICH on HUS. Studies that were ordered with an indication related to a decrease in hematocrit (or similar indication) were no more likely to have an ICH on HUS than those ordered for an alternative indication (OR 0.92, p=0.82). Also, there was no significant association between the likelihood of having an ICH on HUS and a decrease in the measured hematocrit lab value (OR 0.74, p=0.44), or the magnitude of the change in the hematocrit lab value (OR 1.0, p=0.90) during the 48 hours preceding HUS. The actual hematocrit lab value at the time of HUS also did not significantly differ between those with an ICH and without an ICH, suggesting no significant association between anemia and ICH (OR 0.97, p=0.14).

We also evaluated whether an abnormal neurologic examination was associated with an ICH on HUS and found that 12 patients had missing data, 25 patients were sedated at the time of HUS, 22 had abnormal neurologic exams, and 156 had normal neurologic exams. Thus, 6/37 (16.2%) of patients with ICH had an abnormal neurologic examination, and 16/178 (9.0%) of patients without an ICH had an abnormal neurologic examination. The odds of having an abnormal neurologic examination was higher in the group with an ICH compared to those without an ICH (OR 1.71, p=0.30), but the association was not statistically significant. Reasons for an abnormal neurologic examination included “hypotonia,” “decreased tone and flexation,” “hyperactive reflexes,” “decreased tone and reflexes,” “minimal response to stimulation,” “no spontaneous movement,” “no withdrawal to painful stimuli,” and “facial droop.”

In univariable logistic regression analyses, prematurity (OR 3.04, p=0.04), lower gestational age in weeks (OR 0.83, p<0.001), younger age in days at the time of HUS (OR 0.96, p=0.02), and lower birth weight (OR 0.41, p<0.001) were each significantly associated with an ICH on HUS. However, only gestational age remained significantly predictive of ICH (p<0.005) in a multivariable logistic regression model that included indication related to hematocrit (or similar indication), and each of the factors that had been statistically significant (p<0.05) in univariable analysis (i.e., prematurity, younger age, and lower birth weight).

We next examined whether the level of prematurity was associated with a greater likelihood of having an ICH on HUS (Table 3). Patients that were very preterm (OR 4.96, p=0.02) or extremely preterm (OR 8.50, p<0.001) were at a significantly greater risk than those that were term. Moderately preterm infants did not have an increased risk of ICH (OR 1.1, p=0.89). However, there was no association between the level of prematurity and a measured drop in the hematocrit lab value (all p>0.60), nor the magnitude of that change in hematocrit in the 48 hours prior to HUS (all p>0.70).

Finally, we evaluated whether the grade of hemorrhage on HUS was related to a drop in hematocrit (all p>0.20) or the magnitude of the change in hematocrit during the 48 hours preceding the HUS (all p>0.40), and there was no significant association or trend to suggest any relationship between the change in the hematocrit lab value and the grade of ICH.

Discussion

Our study demonstrates that neither a decrease in the hematocrit lab value during the 48 hours prior to HUS nor an indication for HUS related to a decrease in hematocrit (or similar indication) is predictive of having an ICH on HUS. There was also no significant association between the change in hematocrit and the grade of ICH on HUS. Rather, younger age at the time of ultrasound, lower gestational age at birth, and prematurity were all associated with a greater likelihood of finding an ICH on HUS, regardless of whether the patient also had a decrease of hematocrit. Of these factors, lower gestational age was the strongest predictor of an ICH and was the only variable that remained significantly associated with ICH in a multivariable model. Infants with a higher degree of prematurity, such as very preterm or extremely preterm, were also at a substantially increased risk of having an ICH, but there was no relationship between the degree of prematurity and the change in hematocrit in the 48 hours prior to HUS. Thus, a decline in hematocrit alone on laboratory testing is unlikely to be explained by an ICH on HUS and may not be a sufficient indication for ordering this test. However, higher degrees of prematurity or lower gestational age are strong risk factors for an ICH and warrant thorough evaluation with HUS.

Head ultrasound is an inexpensive adjunct to MRI because of its wide availability, lack of side effects, and wealth of anatomical and functional information [17,18]. The threshold to screen neonates for abnormalities with HUS have been historically low since HUS is relatively inexpensive compared to brain MRI. In fact, in 2002 the American Academy of Neurology (AAN) and Child Neurology Society (CNS) recommended routine screening with HUS in all preterm neonates <30 weeks, and at 36- and 40-weeks gestational age, as well as routine Noncontrast CT in encephalopathic term infants with a history of birth trauma, low hematocrit, or coagulopathy [19]. However, this recommendation was retired in 2018 because the AAN and CNS did not update or reaffirm their recommendations. Thus, it may be time to reexamine whether such low thresholds for HUS examinations should be routinely recommended in most neonates [20].

Moreover, with rising healthcare costs, there is increasing concern regarding over-utilization of imaging studies in medicine. Since a hospital’s resources do not simply encompass the costs of imaging tests, but also the time and energy spent by experienced sonographers, support staff, and radiologists to acquire and interpret these tests, it is important that clinicians have clear guidelines regarding the appropriate indications for ordering radiologic tests for their patients. The results of our study suggest that ordering a HUS solely because the hematocrit has decreased or because there is a concern for new anemia may not be a costeffective use of hospital resources. We found that head ultrasounds ordered for an indication related to a decrease in hematocrit (or a similar indication) were no more likely to have an ICH on HUS than those ordered for other indications. Moreover, neonates that demonstrated a decrease in hematocrit in the 48 hours preceding the HUS were no more likely to have an ICH, nor were they at greater risk of having a higher-grade ICH, compared to those with a stable hematocrit.

On the other hand, our study confirmed several well-known risk factors for neonatal ICH, including lower gestational age, especially prematurity, younger age at the time of HUS, and low birthweight [21-23]. We found that gestational age was the most significant predictor of ICH, independent of the other factors in a multivariable model. There was a notable dose response with higher levels of prematurity, such as very and extremely preterm infants, showing increasing odds of having an ICH compared to those who were only moderately preterm or term. This result confirms the findings of recent studies investigating the incidence of GMH in premature neonates [2,3,6]. One such study evaluated a total of 101 neonates and found that those born at <30 weeks gestational age had a 47% chance of ICH, and those born weighing <1000 grams at birth had a 54% chance of ICH [24]. Even though we also found that neonates with lower gestational age (especially higher levels of prematurity) were more likely to have an ICH, we did not find that a change in hematocrit was associated with either the level of prematurity or the likelihood of an ICH. Thus, change in hematocrit neither confounds nor modifies the relationship between prematurity and ICH on HUS.

Our study also suggests that an abnormal neurologic examination may be associated with an increased likelihood of ICH, but the association was not very strong and did not reach statistical significance. Dubowitz et al. have previously shown that multiple neurologic signs can correlate with ICH [25]. Our study did not evaluate whether the many different types of neurologic examination findings correlate with the results of HUS because the neurologic examination findings were not consistently documented in the medical record, and a substantial proportion of patients were either sedated or on a ventilator at the time of HUS and thus lacked documentation of specific neurologic signs. Furthermore, since our sample size was small and our primary question was whether an indication related to hematocrit alone was associated with an ICH on HUS, our study was not powered to adequately study the predictive power of abnormal neurologic examinations for ICH.

Some organizations, such as the Choosing Wisely initiative and American College of Physicians, have attempted to identify imaging tests and procedures that are overused by medical professionals [20]. Moreover, the American College of Radiology (ACR) has developed appropriateness criteria for the use of several imaging examinations in an attempt to limit and properly direct the use of imaging resources [26]. Given the findings in our study, we suggest that a decline in hematocrit, hemoglobin or other laboratory indication of new anemia is unlikely to be predictive of an ICH and is not a sufficient indication for ordering a HUS in the absence of other well-known risk factors as described in this and several other studies [22,24].

This study has several limitations. The types and quality of the data available for review in the electronic medical record were limited by the retrospective nature of this study. Data regarding anticoagulation at the time of HUS was not consistently available and thus was not evaluated in this study. Although abnormal neurologic examination was associated with an ICH on HUS, missing data may have limited our power to detect a statistically significant p-value. Also, since we could not know the neurologic examination of patients that were sedated at the time of HUS, our analysis of this variable was limited. It can be difficult to compare the results of neurologic examinations among patients with ICH and those without ICH given the great variability in expertise and experience amongst neonatal care providers, and the level of expertise could not be ascertained from the medical record. Finally, though the included cases represent nearly a decade’s worth of data, the relatively small sample size of patients with an intracranial hemorrhage within a single institution are limiting factors. A larger sample of patients with ICH on HUS collected across multiple medical centers would allow greater generalizability as well as additional subgroup analyses.

Conclusion

In conclusion, this study demonstrates that a decrease in hematocrit (or similar indication) is not predictive of an ICH and should not be the sole indication for ordering a HUS to rule out ICH. When additional factors are present in the neonate, such as low gestational age, prematurity, lower birth weight, younger age at the time of HUS, or abnormal neurologic examination, then a HUS is more likely to detect an ICH. Infants who are very or extremely preterm appear to be at a substantially greater risk for disability resulting from intracranial hemorrhage than those who are moderately preterm or term, and thus a HUS should always be considered in these patients whether or not there is a clinically reported drop in hematocrit.

To Know more about   Global Journal of Intellectual & Developmental Disabilities

Click here:  https://juniperpublishers.com/gjidd/index.php

To Know more about our  Juniper Publishers

Click here: https://juniperpublishers.com/index.php


Thursday, August 6, 2026

Effective converting ratio when switching between Ona-botulinumtoxin-A and Abo-botulinumtoxin-A in cervical dystonia. A patient assessment cross over study- Juniper Publishers


Neurology & Neurosurgery- Juniper Publishers

Introduction

In the 1950s it was hypothesized that Botulinum Neurotoxins (BoNT-A’s) could be used to reduce activity in muscle disorders [1]. Botulinum neurotoxin is made of a gram-positive anaerobic bacterial exotoxin-

clostridium botulinum [2]. When injected in the skeletal muscle, the botulinum toxin inhibits vesicular neurotransmitter (acetylcholine) release at the neuromuscular junction at the presynaptic membrane and a local chemo-denervation appears [1]. Thereby the toxin can reduce muscular contraction, which is the desire to reduce overactive muscle activity [3-5]. The medical therapies for dystonia are effective, and studies have shown that botulinum toxin is the most effective treatment for cervical dystonia [6]. The evidence from several Class I and Class II studies has led to a level A recommendation for use of BoNT-A for treating focal dystonia such as cervical dystonia, hemifacial spasm and blepharospasm [7]. Three main BoNT-A products are available on the market today: Ona-botulinumtoxin-A (Botox®), Abo-botulinumtoxin-A (Dysport®) and Inco-botulinumtoxin (Xeomin®). Due to different production methods, the biological nature of the three BoNT-A’s are different (e.g. the protein load, formulation, pH, dose and immunogenicity). Moreover, the BoNT-A’s are not interchangeable on an equivalent-dose basis [1, 7].

Study background

The goal of this study was to find the optimal conversion ratio for patients with cervical dystonia when switching treatment between Abo-botulinumtoxin-A and Ona-botulinumtoxin-Awhile obtaining a stable satisfying symptom improvement based on a subjective patient assessment. There is heterogeneity in treatment strategies and on how doses and the effect of BoNT-As are reported until now. This study represents a retrospective (follow-up), cross-over study (each patient acts as his/her own control). Effect of treatment was based on individual patient assessment. Individual based conversion rates were calculated using the optimal treatment dose for Abo-botulinumtoxin-A and Ona-botulinumtoxin-A. Due to the length of the present study with a follow-up time from 1991 to end 2014, it was possible to find stable toxin doses where each patient felt the best effect (min. 90%, VAS-score).

Methods

Study design

The clinical data was sampled from the patients’ medical records. Dystonic muscles and injection sites were identified by using electromyography (EMG). The neurologist determined the toxin doses based on each patient´s disease condition and the dystonic muscles activity (EMG). Each treatment (dosing) pr. clinical visit was individualized. At each consultation the neurologist reported the data (doses of toxin and the patient assessed effect and side effects) in the internal IT-system (Danish electronical patient journal) and also used standard sketches of the face/neck-regions to note which muscles have been injected

Botulinum toxin treatment

Ona-botulinumtoxin-A was diluted with saline to a concentration of 40U/ml. Abo-botulinumtoxin-A was dilutedwith saline to a concentration of 200 U/ml. For cervical dystonia the injection sites were between 2-8 sites. The injection doses in the specific muscles pr. patient and the total botulinum toxin doses pr. consultation were registered.

Effect of the procedure

The patients received treatment with BoNT-A´s every 3rd month at the neurological movement disorder clinic by an experienced neurologist. The subjective assessment of maximal treatment effect on dystonia symptoms between each treatment visits, were evaluated at each visit by the patient on a horizontal 100-mm Visual Analogue Scale (VAS) ; where the left end point indicated 0% treatment effect (no change in dystonia symptoms and no effect of the botulinum toxin) and the right end point indicated a total 100% treatment effect (indicate no dystonia symptoms and a maximal effect of botulinum toxin) between treatments)[8-11].

Data collection

Open Access Journal of Neurology & Neurosurgery

In this study, data was only obtained from patients with a stable idiopathic cervical dystonia, and no change in relevant medical treatment over the data recording period. (Patient study entry, Table 1). The mean individual dose of Onabotulinumtoxin- A was obtained from 4 continuous consultations from each patient with a symptom relief of >90%. The treatment was then changed to Abo-botulinumtoxin-A after filtration to maximal effect and the mean individual dose of this toxin was obtained in the same manner as Ona-botulinumtoxin-A. The conversion ratio of Ona- & Abo-botulinumtoxin-A could then be calculated for each individual by dividing the mean individual Ona-botulinumtoxin-A dose with the mean Abobotulinumtoxin- A dose. The final average conversion ratio (Ona- BoNT-A: Abo-BoNT-A) in the study was found by using all the individual conversion ratio data from the 48 patients (Figure 1).

Statistical analysis

For our statistical analysis of our data we used the software package SPSS Statistics. All averages are in mean± standard deviation.

Results

625 out-patients in total were registered at the movement disorder clinic and received treatments with botulinum toxins. Of these, 48 patients with cervical dystonia patients met the inclusion criteria (Figure 2).

Cervical treatment was determined by the level of dystonia and ranged between 25- 200 units (Ona-botulinumtoxin-A) and 125- 775 units (Abo-botulinumtoxin-A) pr. clinical visit. More females had dystonia and most of the patients’ ages were between middle 50s to middle 70s (Table 2). All data wascollected in a period of 25 years from the movement disorder clinic. The VAS-outcome for each patient was minimum 90%. This retrospective data formed a cross-over design as each patient acted as his/her own control. Therefore, patients with confounders such as smoking, obesity etc. and comorbidities such as heart and lung diseases were not excluded, due to the cross over design. The average treatment time for patients with cervical dystonia receiving Ona-botulinumtoxin-A and Abobotulinumtoxin- A was 15,8±4,6 years. This average treatment time is the total period before and after switching botulinum toxin-A. 2546 injection series (total) were analyzed. Doses were 126 ± 38,8 IE-U for Ona-botulinumtoxin-A and 381,6 ± 151,1 IE-U for Abo-botulinumtoxin-A (Table 3). The mean conversion ratio for cervical dystonia was 1: 2.56. (Table 4).

Open Access Journal of Neurology & Neurosurgery

Discussion

We are reporting 55 patients who converted treatment between Abo- and Ona-botulinumtoxin-A. All data wascollected in a period of 25 years from the movement disorder clinic. Patients have been stabilized with the Ona- or Abobotulinumtoxin- A treatment for at least a year before crossing over to treatment with the other toxin. Due to the long followup and moderate amount of data, we were able to find the average conversion ratio based on each patient´s subjective assessment. Former reports show no statistically significant difference on duration of the effect or adverse effects between Ona-botulinumtoxin-A and Abo-botulinumtoxin-A [12]. Data in these topics were excluded and not evaluated here. Treatment effect of Ona-botulinumtoxin-A and Abo-botulinumtoxin-A was in this study assessed by the treated patients. Due to the routine feedback from each of the treated patients over several years it was possible to achieve regular measurement of treatment effect from a subjective patient perspective without extra time for objective observations and evaluation in between toxin treatment sessions. The conversion ratio between the toxins (Ona-BoNT´s and Abo-BonT´s) using a patient-based assessment has in the present study shown to be equal to the study where they were using multicenter double-blind randomized trials [13]. Due to risk of different treatment techniques, toxin diffusion and especially individual variation in differentiating on relevant pain, a 90% margin was chosen as cut off for registration of desired effect.

Botulinum toxin effect & adverse effect

One unit of Ona-botulinumtoxin-A is not bioequivalent to one unit of Abo-botulinumtoxin-A. The ratio- Ona-botulinumtoxin-A: Abo-botulinumtoxin-A varies between 1:3 and 1:6 [14]. An earlier double-blinded study showed that the conversion ratio of Ona-botulinumtoxin-A and Abo-botulinumtoxin-A was 1:3 [14]. Abo-botulinumtoxin-A has been shown to have a doserelated significant longer duration of the effect rather than Onabotulinumtoxin- A, with a ratio 1:4 (Ona-botulinumtoxin-A: Abobotulinumtoxin- A, p-value= 0,02) [15]. Similar to former reports 12, this report have shown that the effect on dystonia, stabilizes after a period of treatments when changing between different toxin doses. In the present study the toxin doses were stabilized when the patients felt an effect of at least 90% measured on a VAS-score (0-100%) minimum at 4 continuous consultations.

Experimental results have shown that Abo-botulinumtoxin-A diffuses faster than Ona-botulinumtoxin-A which was explained by Abo-botulinumtoxin-A´s lighter molecular weight; Abobotulinumtoxin- A 3-400 kDa vs. Ona-botulinumtoxin-A 900kDa [16], and therefore the side effects in Abo-botulinumtoxin-A compared to Ona-botulinumtoxin-A was assumed due to a higher diffusion rate [17-19]. Other studies stated that botulinum toxin products dissociate under physiological conditions, and therefore the time of diffusion is not related to the toxin size [20]. In a study using Abo- and Ona-botulinumtoxin-A in the same patient with palmar hyperhidrosis, the patient was treated with Ona-botulinumtoxin-A in one palm, and Abo-botulinumtoxin-A in the other palm at the same session for 8 months. The patientswere their own control- like in the present study. The conclusion of that study was that the efficacy and safety of treating with Ona-botulinumtoxin-A and Abo-botulinumtoxin-A was by using the toxins in the conversion ratio of 1: 2.5 [21] which is similar to our conclusion. It has also been shown that conversion ratios of 1:3 or lower could be appropriate for the treatment of spasticity, cervical dystonia, hemifacial spasm, and blepharospasm 22. In the present study we found the conversion ratio of cervical dystonia to be 1:2, 56 which is similar to the former findings [21, 22].

The repeated administration and documentation of the usage of toxin doses (every 3rd month) at the movement disorder clinic reduced the information and selection bias. Due to the long follow-up period with a positive outcome and rare expected side effects, it was found to be effective to use a conversion ratio of 1: 2,56 (Ona-BoNT-A : Abo-BoNT-A) for botulinum toxin-A. The present study did not exclude any patients if they had confounders or comorbidities in behalf of that each patient was his/her own control in this cross-over design. The study design intended to prevent informational bias when evaluating the effect shortly after the toxin injections. To prevent selection and treatment variation bias the use of data was from patients who have been stabilized first with either Ona- or Abo-botulinumtoxin-A treatment for at least a year before crossing over to treatment with the other BoNT-A.

Conclusion

Considering the positive treatment effect, and the long followup period, we concluded that it is safe and clinically useful to use a conversion ratio at 1: 2,56 based on a patient assessment when changing treatment in between Ona- and Abo-botulinumtoxin-A for cervical dystonia. We consider the conversion ratios in our study applicable in other settings as well thus the effect of the botulinum toxin treatments was evaluated on a VAS-score (each patient is his/her own control) in this long follow-up study on dystonic out-patients.

Wednesday, August 5, 2026

Congenital lens dysfunction as a new, undiagnosed cause of decreased visual acuity based on observation over a period of 3 years- Juniper Publishers


Ophthalmology- Juniper Publishers

Abstract

Two groups of patients with diagnosed myopia and astigmatism underwent surgery to have their natural lens removed. The reason of the study was to answer a question if, and how a different level of higher order aberration generated by crystalline lenes, devoid of any visible pathologies can influence visual acuity and quality of vision. A first, examining group, which included 15 patients (29 eyes), had lens removal because of diagnosed lens dysfunction and deteriorated visual acuity to far distances. Second, the control group included 20 patients (31 eyes) with normal visual acuity who had lens removal in the process of refractive lens exchange. The level of higher order aberration generated by the lens examined preoperatively was abnormally higher in examining group as compared with control group. Visual acuity to far distances, measured in examining group was preoperatively deteriorated (mean values = 0.6 logMar) and improved postoperatively (mean values = 0.3 logMar), statistically significantly in contrast to the group undergoing refractive lens exchange, where visual acuity pre and postoperatively comparable.

Background: This article tries to prove that one of the reasons for deterioration of visual acuity, like also quality of vision lies in healthy looking crystalline lens, if it generates high values of higher order aberrations.

Aim of the study: To assess how higher order aberrations, generated by the patient’s healthy-looking lens can influence visual acuity and quality of vision.

Methods: Two groups of patients underwent surgery to have their natural lens removed in the process of refractive lens exchange and congenital lens dysfunction. Congenital lens dysfunction is so far from an undiagnosed cause of deterioration of quality of vision and decreased visual acuity to far distances.

Results: Statistically significant differences were obtained in both preoperative values of higher-order aberration generated by the lens as well as preoperative and postoperative values of visual acuity to far distances. Visual acuity in the group with congenital lens dysfunction improved statistically significantly in contrast to the group undergoing refractive lens exchange.

Conclusions: Lack of visible cause of visual acuity deterioration be an impulse to extend diagnostics to include tests for higher order aberration, generated by the lens.

Keywords: Higher Order Aberrations; Lens Dysfunction; Low Vision; Crystalline Lens Removal; Itrace; Refractive Lens Exchange

Abbreviations: BCVA: Best Corrected Visual Acuity; RE: Right Eye; CLD: Congenital Lens Dysfunction; HOAs: Higher-Order Aberrations; LOAs: Lower-Order Aberrations; RLE: Refractive Lens Exchange

Introduction

The term “Congenital Lens Dysfunction” (CLD) was introduced by the author of this article to identify the cause of the impairment of visual function in terms of quality of vision and visual acuity to far distances. The underlying pathology is an abnormal lens structure that generates higher-order aberrations (HOAs). A very important element of the diagnosis is the absence of any visible pathologies that could be seen during biomicroscopic examination of the lens. This pathology was discovered thanks to the careful analysis of the test results obtained using the iTraceTM analyzer. This versatile device combining the functions of an aberrometer, and corneal topography allows, among others, for the separate analysis of HOAs generated by the cornea and those generated by the eye lens (Figure 1a, b). The term “Congenital Lens Dysfunction” was first described in the article “Usefulness of iTraceTM in Diagnosing Unclear Cases of the Deterioration in Visual Acuity. Congenital Lens Dysfunction as a New Disease Entity. Preliminary Reports” published in December 2020 [1]. Since then, the author’s view of congenital lens dysfunction has been slightly modified.

The main determinant of the diagnosis of CLD are high values of HOAs generated by the lens, with no obvious structural pathologies. The patients do not have cataracts, lenticonus, or a spherical lens. The patients also do not have any other pathologies, generated by other structures of the eye, cornea, optic nerve, retina. Using the word “congenital”, the author wanted to emphasize that this new term refers to a condition other than the condition of the lens known as “lens dysfunction”, which was introduced to understand the changes that occur in a lens which is undergoing opacification after the age of 40.

Despite the lack of visible pathologies, in most of cases a dysfunctional lens generates large, abnormally high HOA values, which translates into a reduction in the quality of vision and visual acuity to far distances, while maintaining correct vision to near distances. Other abnormalities, the presence of which is necessary in order to make the above diagnosis, include: poor quality of vision from childhood (patient’s medical history), presence of high or moderate myopia with accompanying astigmatism, however myopia is of a mixed, refractive-axial nature. The presence of pathology in the remaining eye structures, i.e., cornea, retina or optic nerve, does not exclude the presence of CLD, but it significantly influences correct diagnosis. Low values of HOAs generated by the cornea greatly facilitate proper diagnosis.

So far, generation of HOAs in the eye optical system has been considered only in the context of evaluation of corneal function, mainly in the processes of qualification to refractive surgery [2,3]. As a reminder, aberrations are divided into lower-order (LOA) and higher-order (HOA) aberrations. LOAs, which account for 85% of all aberrations generated by the optical system of the eye, include commonly known eye defects, including myopia, hyperopia, and regular astigmatism. These aberrations can be easily corrected using glasses or contact lenses [4].

HOAs include, among others, spherical aberration, trefoil, coma, tetrafoil, secondary astigmatism. They are most often written in the form of Zernike polynomials. The existence of HOAs in the optic system of the eye can cause blurry vision, diplopia, decreased contrast, dysphotopsia such as ‘glare’, ‘starbursts’ and ‘halo’, and blurred vision at night. These aberrations have a negative impact on vision, in eyes with a wide pupil, and therefore also in scotopic conditions [5]. The normal ranges of HOA generated by the cornea, depends on the pupil size and are between 0.046-0.338 µm (4mm) and 0.121-0.740 µm (6mm) [6]. The only correlation between the lens and values of HOA were observed in progressive nuclear cataract and concerns spherical aberration [7]. During a 3-year follow up, 59 patients aged 8 to 47, who met the criteria for the diagnosis of “congenital lens dysfunction”, were admitted to the Silesian Eye Treatment Centre (Figure 2a, b). In this group, 15 patients (23 eyes) underwent surgery to remove a dysfunctional lens.

Objective

The aim of the study is to prove the correlation between abnormally high values of HOA generated by the lens, as the only one reason of deterioration of visual acuity, examined preoperatively to far distances, like also correlation between high values of HOA and poor visual quality. A secondary aim is to assess if there is a correlation between normal visual acuity to far distances and low values of HOA, generated by the lens.

Material

Retrospective, comparative analysis of values of HOAs, visual acuity and quality of vision, obtained in two groups of patients. First, the examined group included patients with diagnosed abnormality-congenital lens dysfunction (CLD), second, control group included patients, who were qualified to refractive lens exchange (RLE). The only one abnormality observed in examined group were high values of HOA generated by the lens. 33 people (54 eyes) underwent surgery to remove their natural lens, followed by implantation of an artificial lens into the capsule. 15 patients (23 eyes) formed the examined group and were qualified for surgery to remove the lens due to its dysfunction. The second control group consisted of 20 patients (31 eyes) who wanted to get rid of refractive errors and qualified for refractive RLE (group 2). Because CLD was observed only in eyes with diagnosed myopia and astigmatism, only patients with such eye defects were included into the control group.

Preoperatively, each patient was examined using the iTraceTM analyser (Trecey® Technologies) version 6.2.0. Average values of HOAs generated by the cornea and the lens were assessed separately. In accordance with the procedure, the examination was repeated three times at short intervals (Figure 3a, b). For each patient, the values of logMar charts (far vision) and Snellen charts (near vision) obtained with best correction were assessed. Considering the subjective assessment of postoperative vision, each participant in both groups was asked about their quality of vision.

Eligibility Criteria for Surgery

Only patients who were diagnosed with myopia and astigmatism were included in the study. Examined group. Patients with abnormally high HOA generated by the lens (INTERNAL) and confirmed deterioration of visual acuity to far distances and concomitant poor quality of vision. There were no pathologies within the cornea, retina, vitreous and lens, which could have a clear impact on the decrease in visual acuity and the quality of vision. Control group Patients, which wanted to be free of eye defect with normal visual acuity too far and near distances after using best correction. Loss of accommodation properties. Another necessary element was to obtain consent for the extraction of the patient’s clear lens was the desire to improve vision in the group with CLD and to get rid of the refractive error in the group undergoing RLE. Only patients whose best corrected visual acuity (BCVA), measured to both far and near distances was normal, were qualified into the group undergoing RLE.

Exclusion Criteria

1. Abnormally high values of HOAs generated by the cornea in both groups. Patients with hyperopia and pure astigmatism.

2. Any pathologies observed in the cornea, retina, optic nerve or vitreous that clearly have a negative impact on visual acuity and the quality of vision.

3. Any visible pathologies in the structure of the lens, i.e., cataracts, lenticonus and keratoglobus, constituted an important exclusion criterion.

4. CLD suspicion in children was also a disqualifying factor, considering the possibility of further growth of the eyeball and thus a change in the scope of the refractive error.

Below is an example of a 4 yr. girl. She was diagnosed because of a very low visual acuity to far distances, observed in both eyes. Refractometry revealed high myopia and astigmatism of the right eye (RE)…….and left eye (LE)………. BCVA to the far in both eyes = 1.4 logMar. BVA without correction, in both eyes, to the near = D-0.5 (from 5cm), axial length: RE = 26.55 mm, LE= 26.28 No pathologies were found in the retina (Electroretinography), optic tract (Visual Evoked Potential), vitreous and cornea. No visible pathologies of the lens were observed. An examination using analyzer iTrace, module “Dysfunctional Lens Patient Display” revealed normal values of HOA generated by the cornea: RE=0.081, LE=0.102mm, and abnormally high HOA generated by the lens: RE=1.695mm, LE=1.695mm (figure 4a, b). Detailed types of HOA generated by above eyes are visible, using module “WF and CT summary display”.

Method

Each patient, apart from basic tests, including refractometry and intraocular pressure measurements, underwent corneal topography, endothelial cell density measurement and macular OCT. Ganglion cells thickness was examined when glaucoma was suspected. Examination of the anterior and posterior segment using direct/indirect bio microscopy, after pharmacological pupil dilation, was an obvious qualifying standard. The patient’s lens was removed using the phacoemulsification or phacoaspiration procedure. Main criteria for choosing intraocular lens have included: a value of preoperative myopia and astigmatism, a value of angle alpha, pupil size, probability to gain good postoperative level of visual acuity to far distances, patient preferences, and economic issue. Because of the above criteria, different types of intraocular artificial lenses was used, including monofocal, bifocal or multifocal toric lenses. All lenses were inserted into the lens capsule. A premium class, toric lens implantation was the surgical standard in the RLE group.

Because we still don’t know how complex structure of intraocular lens can influence the level of HOA, this parameter was not evaluated after lens exchange. Even spherical lens can generate astigmatism, postoperatively [8]. The procedures were performed by one surgeon in a private medical centre - the Silesian Eye Treatment Centre (Zory - Poland)

The following test results were subjected to comparative analysis:

1. Values of HOAs generated by the cornea and the lens (internal HOA) obtained preoperatively in both groups.

2. Values of BCVA to far distances, obtained preoperatively in both groups.

3. Values of BCVA to far distances, obtained before and after surgery in the CLD group.

4. Values of BCVA to far distances, obtained preoperatively and postoperatively in the group undergoing RLE.

5. Values of visual acuity to near distances obtained in both groups, preoperatively and postoperatively.

Additionally, the above results were assessed for the correlation between the values of HOAs generated by the lens and the preoperative values of BCVA to far distances obtained in both groups. In order to assess subjective changes in vision, each patient was asked about changes in the quality of vision and visual acuity to far distances obtained in the postoperative period.

Statistical Analysis

When developing statistical research, the correlation coefficient was examined, then it was checked whether this coefficient is statistically significant. When analyzing the statistical research, the correlation coefficient was considered. At a later stage, it was checked whether this coefficient was statistically significant.

An Information

We haven't asked for approval our institution's ethics committee for this study. Why? Because lens removal is a stable part of every surgery of cataract removal or refractive lens exchange. We haven’t changed the way of lens removal but only a reason.

Results

Analysis of the values of HOAs Obtained

The comparative analysis included averaged values of HOAs generated by the cornea and the lens (HOA internal) and its common value, generated in both groups, obtained in the preoperative period. These values are presented in Table 1. There were no statistically significant differences between the values of HOAs generated by the cornea in both groups. Statistically significant differences were found in the values of HOAs generated by the lens. They were very high in the CLD group. The HOA values obtained in the postoperative period were not analyzed due to the implantation of intraocular lenses of various structures. A range of HOAs and number of eyes where these values were achieved in preoperative period are presented in Table 2.

Visual acuity to far Distances

The mean values of BCVA to far distances obtained preoperatively and 2 months after the procedure in both groups were analyzed. These values are presented in Table 3. A particular value of BCVA, obtained preoperatively to far distances and number of eyes with such parameters are presented in Table 4. No statistical differences were observed in the values of BCVA to far distances obtained in CLE group, in the pre- and postoperative periods. In CLD group, statistically significant differences were found between pre and postoperative visual acuity, measured to far distances. BCVA to far distances improved by an average of 3 lines on logMar charts compared to preoperative visual acuity. Postoperative vision improvement was not achieved in 3 patients (3 eyes) with unilateral high myopia. Patients from CLD group who had preoperative visual acuity to far distances lower than logMar = 0.5 did not achieve full visual acuity to far distances. It is a logical consequence of the presence of an obstacle, practically from birth, which blocked the proper development of vision to far distances, as is the case with amblyopia due to disuse.

Visual Acuity and HOA values

When analyzing the obtained values, statistically significant correlations were found between

1. Normal visual acuity to far distances and low values of HOAs generated by the lens.

2. Deteriorated visual acuity to far distances and high values of HOAs generated by the lens.

3. The mean level of HOA in examining, CLD group was 2.701, as compared with control, CLE group, one the level of 0.182.

Subjective Assessment of Changes in the Quality of Vision

Patients from the CLD Group

Each of the patients undergoing lens extraction bilaterally reported an improvement in acuity and quality of vision. As previously mentioned, three patients with unilateral high myopia did not report an improvement in vision to far distances, only an improvement in the quality of vision. These people have confirmed that they have severe amblyopia.

Patients from RLE Group

Most of the patients did not notice any significant changes in BCVA and quality of vision in relation to the preoperative vision. As usual, there were a few complaints about the occurrence of negative and positive photopsia, seeing circles in the field of vision, related to the artificial lens structure.

Discussion

Lens Dysfunction. This term is synonymous with the progressive opacification of the lens and the resulting changes in vision. The presence of lens opacification, as well as pathologies of other eye structures can be easily diagnosed using appropriate diagnostic methods. Looking at literature on HOAs, no articles were found analyzing the effect of HOAs generated by the lens on the quality of vision and visual acuity. Virtually all articles focus on the descriptions of HOAs generated by the cornea. This is likely due to the lack of access to devices that can separate the aberrations generated by the lens from those generated by the cornea. The iTraceTM analyzer is one of only a few devices used in the world that allows for this type of analysis.

The first patient in whose case it was suspected that the cause of poor quality of vision and visual acuity observed in both eyes had not been described so far was a 44-year-old man. The patient underwent practically all ophthalmological diagnostic tests, and no pathologies were found within the cornea, lens, retina and vitreous body. Also, no pathologies were found in the neurological examination. The patient was diagnosed with myopia accompanied by astigmatism. Despite the use of best correction (right eye -5.0Dsph/-4.25Dcyl, left eye -8.62 Dsph/-5.5Dcyl), visual acuity to far distances did not exceed the value of 0.7 (logMar), with full acuity maintained in vision to near distances (D-0.5 on Snellen charts). Refractometry showed different, smaller values in terms of the size and axis of corneal astigmatism. The axial length of the eyeball indicated that we are dealing with mixed, refractive-axial myopia.

Examination of the eye using the iTraceTM analyzer for HOAs showed enormous values of HOAs generated only by the lens (Figure 5a, b). The patient underwent surgery in both eyes to replace the dysfunctional lens with a bifocal toric lens. There was an improvement in vision to far distances by 4 lines (logMar) and a significant improvement in the quality of vision. The visual acuity measurement repeated after 14 months gave an improvement of one line to far distances. The patient pointed out that the poor quality of vision was noticeable since an early age and that moderate myopia and astigmatism were diagnosed when he was 6.Poor quality of vision since a young age was the main element of vision that patients paid attention to after the extraction of a dysfunctional lens.

The results showed that visual acuity to far distances achieved in the CLD group improved statistically significantly but still has not reached normal values in some patients. Such a situation was observed when preoperative visual acuity to far distances was low and accompanied to abnormally high values of HOA, generated by the lens. This seems logical as the cause of poor vision likely occurred at birth or in early childhood, so vision could not develop properly. That is why the author called this yet unstudied or undescribed pathology ‘Congenital Lens Dysfunction’. There were some patients in the examining group, whose values of BCVA, examined to far distances, were between 0.3 and 0.2 (logMar), and who gained normal visual acuity postoperatively. HOA generated by those lenses, were only slightly elevated (about 400-500m).

A statistically significant correlation between high values of HOAs generated by the lens and abnormal values of visual acuity to far distances was found in the study group despite the absence of any visible pathology within the lens of the eye. Therefore, the question is whether the patient’s natural lens, which does not show any pathologies during ophthalmological examinations, can generate large, abnormal HOA values? The answer is YES, as is the case with the cornea. When evaluating the cornea in bio microscopy, in most cases we cannot know what HOA values it may generate. It is not uncommon that when abnormal visual acuity values are observed and there are no obvious reasons for this, doctors try to match the cause to the diagnosis. This results, among others, in indicating myopia with accompanying astigmatism as the cause of poor vision. As the results of this study show, this is not a good course of action.

Conclusions

Diagnosing poor visual acuity to far distances with good visual acuity to near distances and no visible pathologies within the structures of the eyeball that may cause poor vision, and the presence of moderate and severe myopia with accompanying astigmatism requires the extension of diagnostics to include a test assessing the values of HOA generated by the lens. This abnormal condition may be a consequence of congenial lens dysfunction, a pathology not described so far, the only manifestation of which is the generation of high values of HOA by the natural lens. In the diagnosis of this disease, it is necessary to use a device that allows for the differentiation between higher-order aberrations generated by the cornea and the lens. Such a device is the iTraceTM analyzer.

To Know more about  JOJ Ophthalmology

Click here:  https://juniperpublishers.com/jojo/index.php

To Know more about our  Juniper Publishers

Click here: https://juniperpublishers.com/index.php


Acute Hematocrit Change as an Indicator of Intracranial Hemorrhage on Neonatal Head Ultrasound- Juniper Publishers

  Intellectual & Developmental Disabilities- Juniper Publishers Abstract Purpose: To determine whether an indication related to a decre...