Biostatistics and Biometrics Open Access Journal
Abstract
The methods of ecological assessment of the
environmental quality of growing birch trees on fluctuating asymmetry of
leaves after their stop in growth are briefly presented. In comparison
with the average values of parameter measurements, each of the five
leaves from at least three birches improves the accuracy of modeling and
seven times reduces the complexity of measurements.
Keywords: three birches, on five leaves, 10 parameters, factor analysis, correlation coefficient, strong regularitiesIntroduction and Short Literature Review
In environmental technology is gradually coming to
an understanding of the need for modeling relationships between the
parameters of structure of plant leaves identification method [1]. Our
Russian inventions refers to the engineering of biology and
bioindication of the environment quality measurements of the growth of
the organs of different plant species, mostly woody plants, for example,
samples in the form of leaves of birch trees with a simple and small
leaf blades.
The technical result is an increase in the accuracy
of indication of the quality of the surrounding birch leaves of the
local environment, as well as simplifying and improving the performance
of measurements of leaf parameters. Thus, we
completely restore the principle of individuality of biological
measurements on the geometry of fluctuation of each sheet.
The method of measurement and analysis
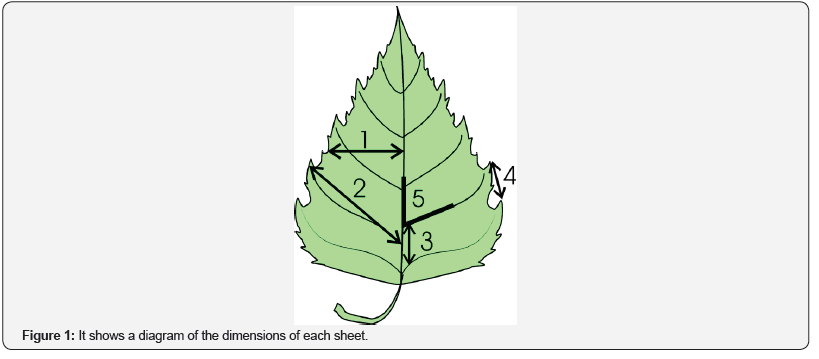
Figure 1 shows a diagram of the dimensions of each
sheet: 1 - the width of the left b′ and right b′′ halves of the leaf
(the measurement was carried out in the middle of the leaf blade), mm; 2
- length l′æ and l′′æ the second from the base of the leaf veins of the second order, mm; 3 – distance l′îñí and l′′îñí between the bases of the first and second veins of second order, mm; 4 – distance l′ê and l′′ê
between the ends of these veins, mm; 5 – angle α′ and α′′ between the
main vein and the second from the base of the leaf vein of the second
order [2-8].
Collection of material should be carried out after
stopping the growth of leaves (in the middle lane since July). For
environmental assessment of anthropogenic impact on the territory take
at least three birches in approximately the same conditions of growth,
with each birch take at least five leaves of different sizes on the part
of the estimated area, then the measurement of the five parameters of
the sheet is carried out with the use of geodetic protractor with the
price of dividing the measuring scale of 0.1 mm, with all at least 15
leaves are taken for the population of individual individuals,
therefore, the table of measurement results without averaging the
measured values is further compiled, and the resulting sample is
statistically simulated and subjected to factor analysis to identify
binary relations between 10 indicators, with all 100 biotechnical laws
identified in the software environment CurveExpert-1.40 by the formula
of the form

Antifungal resistance
where y - an indicator or a dependent quantitative
factor (10 parameters for five indicators from two halves of the sheet);
x - an explanatory variable or an influencing factor (the same 10
parameters from each sheet); 81...aa - the model parameters obtained by
identification.
According to the results of factor analysis by
identifying binary relations between 10 indicators perform environmental
assessment of the territory by the coefficient of correlation
variation, and then from 100 biotechnical laws are selected having a
correlation coefficient of at least 0,7 and consider pairwise five
parameters of the sheet, as well as environmental assessment is carried
out by differences between the structure and parameters of specific
equations.
The results of the measurements in a clean area of the city of Zvenigovo Republic of Mari El
According to the principle of individuality of each
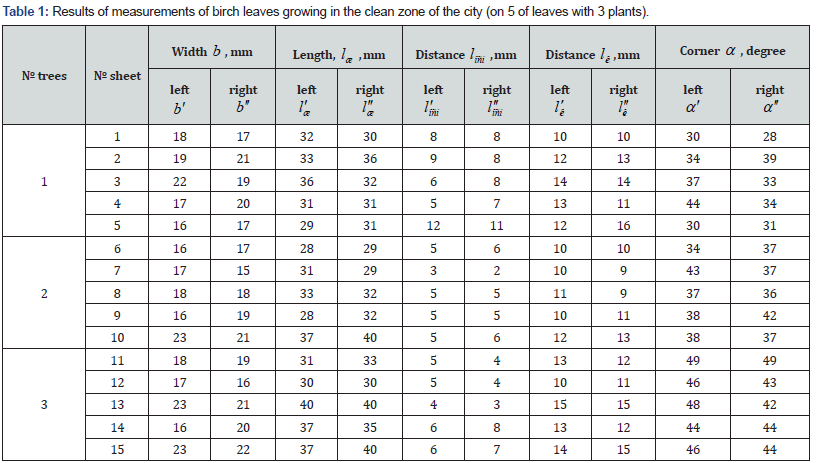
leaf, the results of measuring the parameters of 15 leaves of only three
birches in a clean area are listed in Table 1. Full factorial analysis
includes 10 factors and 102 = 100 factor relations. For all of them the
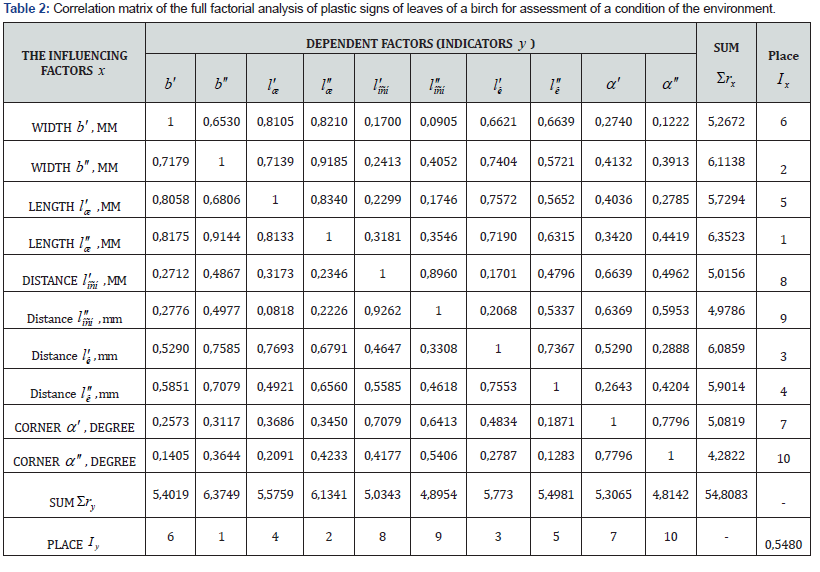
equation has the form of (1). The correlation matrix of the factor
analysis for assessment of a condition of the environment is given in
Table 2. The coefficient of correlation variation of the ecological set
of 15 leaves (5 leaves from 3 trees) is 54,8083 / 102 = 0,5480. This
criterion is used when comparing different sampling sites of birch
leaves. In comparison with Table 2, variability in fluctuating asymmetry
increased significantly, as 0.5480.
Analysis of binary relations between factors
To do this, we exclude monarny relations from the
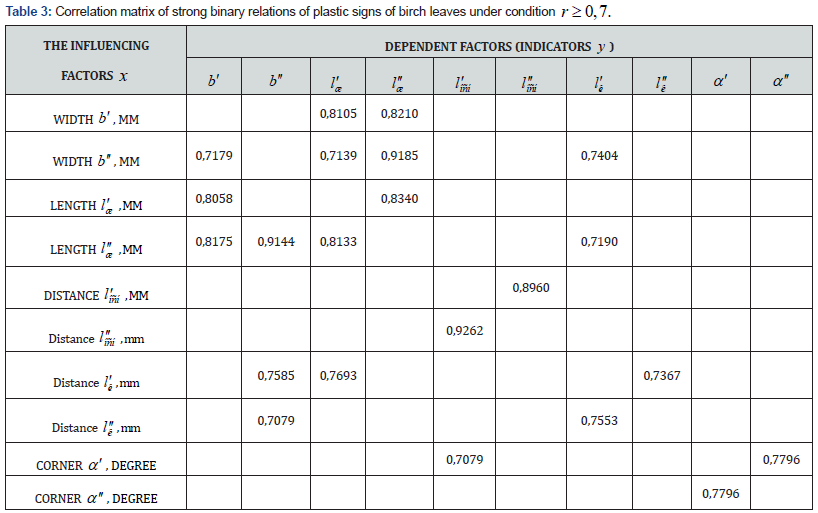
data 1, we leave only binary relations with strong factorial relations
(Table 3). There are 22 strong binary dependencies left. The formula l′′îñí→l′îñí
has the highest strength. The distance between the bases of the first
and second veins on the right side of the leaves most affects the
distance between the bases of the first and second veins on the left
side of the leaves.
For example, Figure 2 shows a graph of the effect of
îñíl′′→îñíl′ the distance between the bases of the first and second
veins on the right side of the leaves by the distance between the bases
of the first and second veins on the left side of the leaves when
measured by the proposed method on 15 leaves in three birches. Figure 3
shows a graph of the result b′′→æl′′ of the influence of the width on
the right side of the leaves on the length of the second vein on the
right side of the leaves.


On Figure 4 - graph of the result l′′æ→b′′
influence of the length of the second vein on the right side of the
leaves on the width on the right side of the leaves. On а Figure 5 shows
the graph of the result l′îñí→l′′îñí of the
influence of the distance between the bases of the first and second
veins on the left side of the leaves on the distance between the bases
of the first and second veins on the right side of the leaves. On a
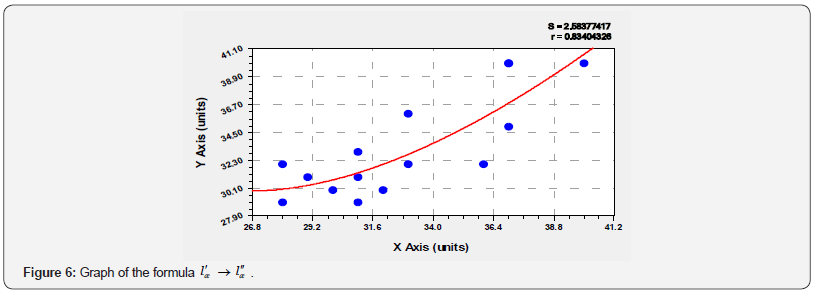
Figure 6 - graph of the result l′æ→l′′æ influence
of the length of the second vein on the left side of the leaves on the
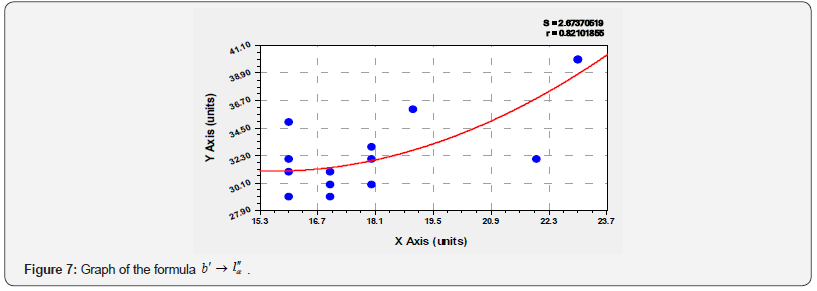
length of the second vein on the right side of the leaves. On a Figure 7
shows the graph of b′→l′′æ effect of width on the left side of leaves on the length of the second vein on the right side of leaves.
Comparison of the proposed methods with the prototype
Thus, the comparison shows that the proposed
information technology for processing the values of the same parameters
in individual leaves 57 / 22 = 2,59 times stricter than the prototype.
The correlation coefficient is also 0,7538 / 0.5480 = 1,38 times less,
which indicates better variability. Therefore, it can be concluded that
the adoption of the arithmetic mean values of the parameters of birch
leaves up to 100 (10 trees for 10 leaves) is artificial, smoothing the
variability of fluctuating asymmetry. In reality, it is much more
variable.
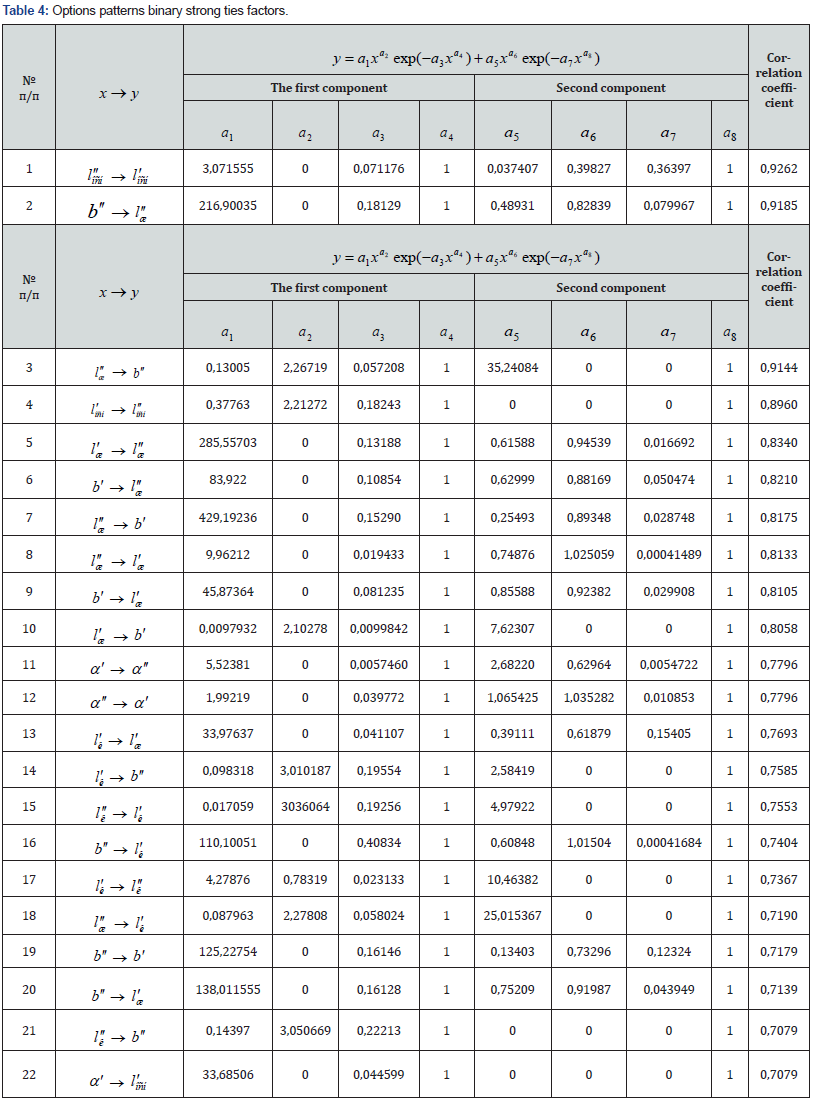
All 22 strong links in Table 3 are arranged without
the loss of a row and form a geometric pattern. This fact also points
to the application of the principle of individuality, that is, without
averaging the results of environmental measurements. Write out the
formula 22 binary factor strong ties, ranging in Table 4 in descending
order of correlation coefficient.
Matrix representation of the model (1) is compact,
but for clarity we will write the first three binary relationships
separately in the form of formulas:
•
Effect of the distance between the bases of the first and second veins
on the right side of the leaves on the distance between the bases of the
first and second veins (Figure 2) on the left side of the leaves

•
Effect of width on the right side of the leaves on the length of the second vein (Figure 3) on the right side of the leaves

•
The effect of the length of the second vein on the right side of the
leaves on the width on the right (Figure 4) side of the leaves

Conclusion
Thus, fluctuating asymmetry can be captured by
statistical modelling from a much smaller volume of measurements. The
smallest volume of measurements we recommend 15 (three trees of five
different leaf sizes from different places). This will reduce the volume
of measurements 100 / 15 ≈ 7 times. However, this increases the
accuracy of the analysis of fluctuating asymmetry. The advantage of the
proposed method is the technical simplicity of execution, since the
equipment requires only a measuring pair of compasses and surveying
protractor with scale division 0,1 mm. Therefore, the invention can be
widely implemented in school environmental clubs, school forestries, and
even kindergartens, as well as in geographical and other expeditions
with additional study of the quality of the territory on the properties
of the leaves of the birch trees.
To Know More About Biostatistics and Biometrics Open Access Journal Please click on:


No comments:
Post a Comment