Showing posts with label Artificial Intelligence. Show all posts

Wednesday, November 20, 2024

Artificial Intelligence System for Value Added Tax Collection via Self Organizing Map (SOM)- Juniper Publishers


Forensic Sciences & Criminal Investigation - Juniper Publishers

Abstract

Findings: Based on our experiments, our approach is an effective instrument for hot spots and heat map exploration since it employs visualizations techniques that are easy to understand. In the ANN-SOM similarity Heat map we observe that VAT vendors or entities, with similar VAT return characteristics, are grouped in the same area or node. Generally, in business, users are more interested in “abnormal clusters” or hot spots. That is, clusters of VAT vendors who have more suspicious behavior than normal nodes or clusters. However, when interpreting the ANN-SOM Heat map the abnormal clusters are those that have a smaller number of entities. That is, these nodes are composed of suspicious VAT vendors. Such VAT vendors require detailed human verification by VAT audit specialists. The results show that detection of suspicions VAT declarations is a very challenging task as VAT declarations datasets are extremely unbalanced in nature. Furthermore, the tax fraud domain is full of unlabeled data, which in turn makes it difficult to use supervised learning approaches. VAT fraud or suspicious behavior can be differentiated by observing VAT return form attributes such as VAT Liability, Exempt supplies, Diesel Refund and Input VAT on Capital Goods purchased.

Research, Practical & Social implications: The article highlights the use of SOMs in exploring hot spots in a large real-world data set from the taxation domain. The approach is an effective tool for hot spots exploration since it offers visualizations that are easy to understand for tax administration users. Tax auditors can select abnormal clusters for further investigation and exploration. The framework and method are designed with the objective of assisting with the VAT audit case selection. Furthermore, we envisaged that the model would improve the effectiveness and efficiency of the revenue collection agencies in identifying anomalies on VAT returns filed by the taxpayers. Moreover, Tax authorities may be able to select the most appropriate unsupervised learning technique from this work having considered other alternatives, their operational requirements and business context. Thus, leading to a multitude of available Artificial Intelligence aided VAT fraud detection algorithms and approaches. Additionally, the techniques proposed in this paper will help tax administrations with precise case selection using an empirical and data-driven approach, which does not depend upon labelled historic VAT datasets. Furthermore, we envisage the approach will result in a high hit ratio on suspicious VAT returns, and thus improve tax compliance due to the likelihood of detection.

Originality/value: The value of the study is that in as much as this paper’s focal point is on VAT fraud detection, we are confident that the present model may just as well be applicable to other tax types, like Company Income Tax and Personal Income Tax for instance. This research outcome shows the potential of artificial intelligence techniques in the realm of VAT fraud and criminal investigation. Furthermore, this review put forward high-level and detailed classification frameworks on VAT fraud detection. Additionally, the framework proposed herein presents tax auditors with a systemic case selection guide of suspicious VAT returns. Furthermore, it is crucial to have an all-encompassing view on detecting tax fraud in general and VAT fraud. This is to broaden the understanding and knowledge of the VAT fraud phenomenon among researchers.

Keywords: Self-organizing map; Cluster analysis, Anomaly detection; VAT fraud detection; Artificial intelligence; Robotics process automation; Algorithms and Machine learning; Criminal investigation

Introduction

In the Information Systems field, IS or IT business strategies and modelling could be referred to as an act or science of initiating a transaction or exchange through a predetermined series of actions (e.g., organizational management, planning, or technology processes). Research on digital platforms (or multisided markets) originated in IS economics and has been pronounced in the strategy field since early 2000s [1,2]. The adoption of Internet and mobile phone services have enabled industries to introduce a platform enabling business models commonly referred to as disrupting industry structures [3,4]. For instance, in transportation, lodging and meal delivery sectors (such as Uber, Airbnb and Mr. Delivery).

AI digital platform (e-platform) is an ICT value creation which facilitates transactions between several groups of users including buyers and sellers [2]. For example, content and search engine optimization, social media marketing and optimization are augmenting consumer buying powers as more and more consumers are voicing their opinions. Furthermore, customers express their views about the industry, their brands and related product attributes. Ineffective delivery of products and services regarding customer requirements could impact the corporate brand, image, loyalty, and values. This could lead to customer discontent thereby causing disengagement with products and brands through eWom [5]. Overall, digital technologies present considerable opportunities for enterprise leaders to rethink their business to create better experience for customers, employees, partners, and as well lower cost of services [6].

In this research, we explore how an Artificial Intelligence digital platform framework could be employed to explore value added tax fraud prediction in the revenue service sector. Notably, AI digital platforms appear to influence effective and productive revenue collection strategic decisions. The recent work and trends in the field of AI digital platforms varies namely, Apple Siri enabled smart mobile searches, the web search and capture of keywords, google duplex for hair-grooming appointments, restaurant reservations, voice tone and language patterns duplex are hardly distinguishable with human voice [7]. Recently, Amazon entered a partnership with Marriott International Inc. wherein Amazon Flywheel and Amazon Alexa Voice enabled platforms perform the task of assisting hotel guests from room servicing to housekeeping [8]. In spite of these developments, we suggest that very little research has existed around the use of AI in computer information systems that explores digital platforms designed to aid the efforts of revenue collection and the identification of tax fraud and evasion.

VAT fraud and as well as VAT criminal investigation can be explained as a deliberate misrepresentation of information in VAT returns or declarations to decrease the amount of the tax liability [9]. VAT fraud is a major problem for tax administrations across the world. It is carried out by criminals and organized crime networks. VAT fraud can occur in many sectors including electronics, minerals, cars, and carbon permits. The most attractive goods for fraudsters have been those of high value and low volume such as mobile phones or computer chips, which generate huge amounts of VAT in the lowest number of transactions and in the shortest possible time [10]. At the heart of the VAT system is the credit mechanism, with tax charged by a seller available as a credit against their liability on their own sales and, if more than the output VAT due, refunded to them. According to Keen & Smith [11], this creates opportunities for several types of fraud characteristic of the VAT namely: False Claims for Credit or Refund; Zero-rating of Exports and Misclassification of Commodities; Credit Claimed for VAT on Purchases that are not Creditable; Bogus Traders; Under-reported Sales; Failure to Register; Tax Collected but not Remitted.

The development of AI digital platform (e-platform) for VAT fraud detection is required to ensure that large amounts of revenue that could be used by the government for the much-needed socio-economic public services such as hospitals, schools and road infrastructure are generated. Artificial neural networks (ANN), when trained properly can work like a human brain. They learn by example, like people and are known to be exceptionally good classifiers. Furthermore, the neural network is preferred in this study due to its ability to solve classification problems [12]. Machine Learning algorithms are very likely to produce faulty classifiers when they are trained with imbalanced datasets. Fraud datasets are characterized by imbalanced datasets. An imbalanced dataset is one where the number of observations belonging to one class is significantly higher than those belonging to the other classes. Other algorithms tend to show a bias for the majority class, treating the minority class as a noise in the dataset. In many standard classifier algorithms, such as Naive Bayes, Logistic Regression, and Decision Trees, there is a likelihood of the wrong classification of the minority class. ANN are well suited to imbalanced datasets [13]. Hence, this research proposes a Self- Organizing Map (SOM) Neural Network algorithm to detect VAT fraud.

A self-organizing map (SOM) or self-organizing feature map (SOFM) is a type of artificial neural network (ANN). The SOM is trained using unsupervised learning to produce a low dimensional map. It is a discretized representation of the input space of the training samples, called a map. Self-organizing maps differ from other AI algorithms in that they use competitive learning instead of error-correction learning [14]. In a sense, it uses a neighborhood function to preserve the topological properties of the input space [15].

Background

The background for this research is multifold, that is, to create a VAT fraud detection AI framework as well as the application of a Self- Organizing Map (SOM) algorithm to detect VAT fraud. This paper focuses on VAT fraud detection. The fraud detection arena is characterized by extremely large amounts of unlabeled structured and unstructured data. Unsupervised machine learning algorithms are well suited to unlabeled datasets. Hence, we herein propose an unsupervised machine learning approach for detecting VAT fraud. We begin by describing the SOM algorithm. Thereafter, we discuss data collection and data preparation [9]. Additionally, we elaborate on issues relating to VAT variables feature selection, followed by an exploratory data analysis. Furthermore, we explain the machine learning technique and statistical algorithm employed in this study. Finally, we present results from actual digital platform-based experiments conducted on taxpayer level VAT dataset.

Justification

The traditional way for improving tax fraud detection by tax audit is costly and limited in terms of scope given the vast population of taxpayers and considering the limited capacity of tax auditors. Auditing tax returns is a slow and costly process that is very prone to errors. Conducting tax audits for example, involves costs to the tax administration as well as to the taxpayer. Furthermore, the field of anomaly and fraud detection is characterized by unlabeled historical data. To this end, the writers suggest the use of unsupervised machine learning (ML) algorithms which are well suited to unlabeled datasets. There is little research comparing the effectiveness of various unsupervised learning approaches in the VAT fraud realm. The detection of tax fraud can be constructively approached by techniques based on supervised ML techniques. However, those methods require enormous training datasets containing data instances corresponding to both verified tax fraud cases and compliant taxpayers. Many previous studies reviewed allude to the scarcity of labelled datasets in both developed and developing countries. The second problem with supervised ML approaches could be that only a small number of frauds are identified by tax administrations that are recorded in the training dataset. Thus, recorded fraud cases are not representative of the entire population. Therefore, a trained supervised models will be biased; however, it will have a high fraud hit ratio, but a low recall.

Consequently, the lack of the availability of labeled tax fraud is usually dealt with by unsupervised ML methods based on anomaly detection algorithms. Therefore, unsupervised methods are suitable as a decision support or selection tool in tax fraud systems. Therefore, unsupervised algorithms enable better and faster prioritization of tax audit cases, thus improving the effectiveness and efficiency of tax collection. Secondly, tax fraud cases based on accurate unsupervised learning may lead to a more efficient use of resources.

In the study various approaches are considered including Principal Component Analysis (PCA), k-Nearest Neighbors (kNN), Self-Organizing Map (SOM) and K-means, as well as deep learning methods including Convolutional Neural Networks (CNN) and Stacked Sparse AutoEncoder (SSAE). This paper can serve as a guideline to provide useful clues for analysts who are going to select ML methods for tax fraud detection systems as well as for researchers interested in developing more reliable and efficient methods for fraud detection. In this study, the VAT datasets obtained are from the South African tax administration. In particular, a dataset of the mining industry is chosen. This is because the South African diesel rebate scheme is very prone to abuse and VAT fraud. Additionally, in South Africa the mining sector is very important. It employs more than 464,000 people and accounts for 8.2% of GDP [16].

Objective of the Work

The objective of the work is to determine what type of AI technique or framework could be applied to improve tax collection. In particular, the present study explores the use of AI in VAT fraud detection. The main purpose of the study is to determine how corporate VAT fraud could be detected in real time. Corporates and private businesses, primarily use artificial intelligence to influence business models, sales processes, customer segmentation, strategy formulation as well as to understand customer behaviour, in order to increase revenue [4]. There is substantial research on the influence of AI on business strategies with the objective of increasing revenue [2]. However, there is limited research on the use of AI in information systems research to assist in the efforts of revenue collection and VAT fraud detection.

Detection of suspicions VAT declarations is a very challenging task as VAT declarations datasets are extremely unbalanced in nature. Furthermore, the tax fraud domain is full of unlabeled data, which in turn makes it difficult to use supervised learning approaches. In this research paper, we proposed an unsupervised learning approach. Regardless, it is crucial to have an all-encompassing review on detecting tax fraud in general.

Unsupervised algorithms are well suited to unlabeled historical datasets, common in the fraud detection or classification arena. The authors conduct experiments using an unsupervised Neural Network algorithm to classify suspicious Value Added Tax declarations. This algorithm can assist in the efforts of tax audits made by tax administrations. Consequently, it is envisaged that the chances of detecting fraudulent VAT declarations will be enhanced using AI techniques, proposed in this paper.

Literature Review

In the age of big data, detecting fraudulent activities within tax returns is analogous to finding a needle in a haystack. Anomaly detection approaches and ML techniques that focus on interdependencies between different data attributes, have been increasingly used to analyze relations and connectivity patterns in tax returns to identify unusual patterns [17]. In the surmise of Molsa [18] Artificial Intelligence & automation are poised to reshape the digital platform function. Phua, Alahakoon & Lee [19] in their paper, tabulate, compare and summarize fraud detection methods and techniques that have been published in academic and industrial research during the past 10 years. This is done in the business context of harvesting the data to achieve higher cost savings. Phua et al. [19] presents a methodology and techniques used for fraud detection together with their inherent problems. In their research, they juxtaposed four major methods commonly used for applying a machine learning algorithm. Firstly, supervised learning on labelled data. Secondly, hybrid approach with labeled data. Thirdly, semi-supervised approach with non-fraud data, and lastly, unsupervised approach with un-labeled data. Meanwhile, Shao et al. [20] describe the building of a fraud detection model for the Qingdao customs port of China. The model is used to provide decision rules to the Chinese custom officials for inspection of goods based on historical transaction data. The objective is to improve the hit rate. The model is appropriately named ‘Intelligent Eyes’ and has been successfully implemented with high predictive accuracy [20].

Tax administration agencies must use their limited resources very judiciously whilst achieving maximal taxpayer compliance albeit at the lowest cost of revenue collection. Whilst, at the same time, adhering to lower levels of taxpayer intrusion. The Quantitative Analytics Unit of the Securities Regulation Institute in Coronado, California, USA, developed a revolutionary new statistical-based algorithm application called “NEAT,” which stands for the “National Examination Analytics Tool” [21]. With NEAT, securities examiners can access and systematically analyze massive amounts of trading data from firms in a fraction of the time it has in the previous years. In one recent examination, NEAT was used to scrutinize in 36 hours exactly 17 million transactions executed by one investment adviser. Among its many benefits, NEAT can search for evidence of probable insider trading by comparing historical data of significant corporate activity like mergers and acquisitions against the companies in which a registrant is trading. They then use this information to analyze how the registrant traded at the time of those notable events. NEAT can review all the securities the registrant traded and quickly identify the trading patterns of the registrant for suspicious activities [21].

Theoretical Background

Artificial intelligence (AI) digital platform

An AI e-platform uses artificial intelligence techniques to make automated decisions based on data collection, data analysis and data scrutiny. An AI digital platform serves as a Computer Information Systems platform that showcases economic trends that may impact system automation efforts. AI techniques like ML use customer data, to learn how to best interact with customers thereby providing insights that could serve those customers with tailored messages at the right time without intervention from external factors to guarantee effective, efficient, and impactful product development and communication. In the current circumstances, this study endeavored to place AI digital platform development in the context of systemic developments which could be well-thought-out as digitalization of industries IT resources [22].

Additionally, an AI e-platform performs repetitive, routine, and tactical tasks that require less human intervention. It use-cases may include data analysis; media buying; automated decision making; natural language processing; generation of content; real-time personalized or tailored messaging [22]. Accordingly, AI digital platforms hold a vital role in helping managers to understand ML algorithms like k-nearest neighbor, Bayesian Learning and Forgetting, Self- Organizing Maps, Artificial Neural Network Self-Organizing Maps. These forms of algorithms help to gain a comprehensible understanding of how amenable and responsive a customer is to a specific product offering effort. Therefore, AI e-platform frameworks are required to process expansive and extensive data sets that can potentially unveil hidden knowledge and insights about products and their customers. Thus, enabling organizations to derive significant revenue growth, whilst strengthening customer relationships [23]. There is significant research on the impact of AI on business processes in information systems to increase revenue, however more research is needed to explore its potential in aiding revenue collection by tax administrations [24]. Consequently, in this current study we use unsupervised models to detect Value Added Tax fraud in order to improve tax compliance, and thus enhance revenue collection.

Social behaviours on tax fraud and compliance

Earlier on, we explained that an AI e-platform is required to understand customer needs to create appropriate and personalized messages and product offering. In the same vein, a tax administration’s understanding of its taxpayers is key to effective tax administration and revenue collection. The taxpayers’ attitude on compliance may be influenced by many factors, which eventually influence a taxpayer’s behavior. Those factors which influence tax compliance behavior differ from one country to another, and from one individual to another [25]. Namely, taxpayer’s perceptions of the tax system and Tax Authority [26]; peer attitude, norms and values; a taxpayers ’s understanding of the tax system or tax laws [27]; motivation such as rewards [28]; punishment such as penalties [29]; cost of compliance [30]; enforcement efforts such as audit; probability of detection; differences between cultures; perceived behavioral control [31]; ethics or morality of the taxpayer and tax collector; equity of the tax systems; demographic factors such as sex, age, education and size of income and use of informants [32].

Therefore, tax fraud detection, enforcement and the behavior of others affect taxpayer compliance [33]. The IRS Commissioner Charles Rossotti noted that when the number of audits is reduced, honesty suffers as fears of policing decline.

Additionally, if taxpayers begin to believe that others are cheating, then the temptations to shave their own tax burdens may become irresistible. Commissioner Rossotti’s observations recognize that tax fraud detection and enforcement affect social behaviors, and that these behaviors can, in turn, affect taxpayers’ compliance decisions [33]. Accordingly, the probability that a taxpayer will escape their tax obligations increases when the taxpayer suspects that his associates, colleagues, and acquaintances are evading taxes [34].

Vat Fraud Detection AI e-Platform Framework

(Figure 1)

Overview of the framework

The VAT Fraud Detection AI e-platform framework employs a Self-Organizing Map (SOM) neural network. The framework is designed with the objective of assisting with the VAT audit case selection. Furthermore, we envisage that the model should improve the effectiveness and efficiency of the revenue collection agencies in identifying anomalies on VAT returns filed by the taxpayers. The framework hereunder classifies and segregate taxpayers into clusters or categories that have the greatest likelihood of committing fraud. Thus, the framework selects taxpayers for audit on the probability that they have committed fraud. The VAT Fraud Detection AI Framework proposed herein, is an amalgam of a typical industry standard machine-learning life cycle and tax authorities’ VAT auditors’ standard guide.

Flow of the framework

Task 1 – Extract VAT return data: According to the industry standard machine learning life cycle, this task is conducted under the data gathering phase of the life cycle. This step’s goal is involved with the collection of data and the integration of data obtained from various sources such as files, database, the internet, or mobile devices. It is one of the most important steps of the life cycle. The quantity and quality of the collected data will determine the efficiency of the output. The more data we collect, the more accurate will be the classification or prediction.

Task 2 – Aggregate data: After collecting the data, we need to prepare it for further steps. In the ML life cycle this task is completed under the Data preparation phase. Data preparation is a step where we put our data into a suitable database or files and prepare it to use in our machine learning training. In our framework, for each VAT dealer, we aggregate all numerical continuous variable obtained from the return. In this study the summary values. over a period of 6 years, and are calculated for each individual VAT vendor. This effectively allows the algorithm to have a longer-term view of the vendor behaviour as opposed to monthly or yearly scrutiny. During this task will also conduct data pre-processing and exploratory data analysis.

Task 3 – Normalize data: This task is normally undertaken under the Data preparation phase of the Machine Learning Lifecycle. During data preparation we use a technique called normalization or standardization, to rescale our input and output variables prior to training a neural network model. The purpose is to normalize the data to obtain a mean close to zero. The review of the literature reveals that normalization could improve performance of the model [35]. Normalizing the data generally speeds up learning and leads to faster convergence. Accordingly, mapping data to around zero produces a much faster training speed than mapping them to the intervals far away from zero or using unnormalized raw data.

Task 4 – ANN-SOM Algorithm: Formally this stage is about selecting an appropriate Machine Learning Algorithm. This is an iterative process. During this study, we identified multiple machine learning algorithms applicable to our data and VAT fraud detection challenges. Therefore, as mentioned previously we shall use an unsupervised learning approach which is appropriate for unlabeled data. The algorithms we evaluated were K-means and Self Organizing Maps (SOM). According to Riveros et al. [36] the model trained with SOM outperformed the model trained with K-means. In their study they found that the SOM improved detection of patients having vertebral problems [36]. Likewise, after a few iterative processes, comparing the SOM and K-means performances, we chose the ANN-SOM algorithm.

Task 5 – Train and Test model: This stage is concerned with creating a model from the data given to it. At this stage we split the dataset into training and test datasets: 20% for testing and 80% for training. Herein, the training process is unsupervised. The remaining dataset is then used to evaluate the model. These two steps are repeated a number of times in order to improve the performance of the model [36].

Task 6 – Optimize model: A model’s first results are not its last. The objective of the optimization or tuning to improve performance of the model. Tuning a model involves changing hyper parameters such as learning rate or optimizer [37]. The result for tuning and improving the model should be repeatability, efficiency and to reduce the training time. Someone should be able to reproduce the steps one has taken to improve performance.

Task 7 – Deploy model: The aim of this stage is the proper functionality of the model after deployment. The models should be deployed in such a way that they can be used for inference as well as be updated regularly [37].

Task 8 – VAT audit Case selection: The cohort of VAT vendors with return declarations that have been identified by the SOM as suspicious land up in the “funnel” for further scrutiny. This step is comprised of human verification. This audit is merely a general audit of cases selected for further scrutiny. This contrasts with an Investigative Audit, which is concerned with the auditing of cases by a specialist auditor.

Task 9 –Investigative audit, criminal investigation, and enforcement: Investigative audits are different from other tax audits in that a centralized specialist team conducts them. Task 9 is undertaken based on the results obtained from the previous audits conducted in Task 8 above, where audit officers have identified evidence of serious fraud.

Task 10 - Tax compliance: The tax compliance task is involved with the scrutiny of compliance related attributes like filing returns on time, timely payments, accurate completion of returns and timely registration with the tax authority, among others.

Task 11 – Voluntary compliance: The aim of the VAT fraud detection AI framework is to increase voluntary compliance. The level of audit activity and frequency of audit will be dictated by the availability of staff resources. The convenience of the AI framework suggested herein, is that it will ensure that the available staff resources are deployed judiciously with the twin objectives of maximizing both revenue collection and voluntary compliance by VAT dealers.

The “filter” or “funnel” described in the task 8, symbolizes the audit process, which involves a detailed human verification and validation of lading. This in turn assists in the independent verification financial records such as sales invoices, purchase invoices, customs documents, and bank cash deposits. However, the scope of the human verification is limited to the subset of taxpayers that have been flagged as anomalies by the SOM algorithm we propose. Once human verification has confirmed the presence of suspicious VAT declarations, such cases are then dealt with in task 9. Task 9 is a depiction of the work performed by investigative audit, criminal investigation, and enforcement teams, on confirmed cases. With this framework we envisage, that the effectiveness and efficiency of this AI assisted compliance framework will enhance detection of suspicious VAT vendors. Consequently, we anticipate that tax compliance will improve as the fear of detection increases (Task 10). Voluntary compliance will be a consequence of an improved, effective, and efficient AI based case selection technique (Task 11).

Material and Methodology

Data collection

We employed a rich data set, that is, the totality of VAT returns covering 6 years from 2013 to 2018. In order to delineate our data collection techniques, we have chosen to concentrate on only one type of industry, that is, mining. We have collected VAT returns for the complete list of registered vendors for six tax years, that is, 2013 to 2018. The firms have been anonymized so that we cannot link them with any publicly available data, however, they have been assigned identifying numbers so that we can follow a firm over time. The data contains detailed information on the line items in the returns, which is the VAT 201 declaration form of the South African tax administration. For instance, from the VAT return we managed to acquire 35 continuous variables. For ethical and confidentiality reasons, we shall not list all 35 variables, but only a subset of variables (Table 1).

Data preparation

According to Peck et al. [38] data preparation is the cleansing and organizing of real-world data, which is known to consume more than 80% of the time of a data scientist’s work. Real-world data or raw data is dirty, full of missing values, duplicates and in some cases incorrect information [38]. Most machine-learning algorithms cannot deal with missing values. Hence, the data needs to be converted and cleansed. In handling missing values, we dropped rows and then applied linear interpolation using mean values. Depending on the importance of the variable or feature the number of the missing values, any one of these solutions can be employed [38].

Consequently, we are fortunate in that we obtained a clean and high-quality dataset. However, the VAT, return dataset we obtained was at monthly level. We subsequently summed up all variables to annual values. The aggregation of all numerical variables of the VAT returns spans a six-year period from in 2013 to 2018. Thereafter the rand value amount was converted into ratios for ease of comparison. Nevertheless, as stated before the details of some of the variables that we used in this study could not be reported herein, due to the confidential nature of the tax audit process. Doing so can increase the potential for reverse engineering of the audit process, which is clearly undesirable and unlawful. However, each VAT ratio is designed from a point of view that a significantly higher or lower ratio value in relation to the rest of the sample or observations could arouse suspicion. In the opinion of Pamela Castellón González & Juan D. Velásquez fraud cases are most likely to occur among the extreme values of variables [39].

Dataset

The dataset consists of 5065 observations with 35 continuous variables. The observations are of Value Added Tax declarations or returns filed with the South African tax administration. However, the structure of the dataset showing sample variables can be seen in Table 1. In addition, we do provide aggregate indicative results that demonstrate the effectiveness of our approach. Thus, the 35 variables or attributes we have selected for this study are: gross income profile, income source, expense profile, source of purchases, tax payable or refundable, sales destination, imports or export purchases, accuracy of the declarations, overdue payments of taxes due to the tax authority, market segments, taxpayer industry, demographics, and the size of the firm.

Exploratory data analysis

In this section we use graphs, visualization, and transformation techniques to explore the VAT dataset (Table 2) in a systematic way. Statisticians call this task exploratory data analysis, or EDA for short. EDA is a repetitive cycle to firstly, give rise to questions about our data. Secondly, during this phase, we look for answers by visualizing and transforming the dataset population and lastly, we use what we have learnt to refine the questions and/or generate new questions. EDA is not a formal process with a strict set of rules [38]. We hope this initial data analysis will provide insight into important characteristics of the data.

Furthermore, we anticipate that EDA can provide guidance in selecting appropriate methods for further analysis. Additionally, we shall use summary statistics to provide information about our dataset. During this stage, we envisage that the summary statistics will tell us something about the values in the dataset. This includes where the average and median lies and whether our data is skewed or not. According to Peck & Devore [38], summary statistics fall into three main categories. That is, measures of location, measures of spread and graphs [38].

The measures of location will tell us where the data is centered. It will also tell us where a trend lies. Therefore, we shall use Mean, Median and Mode. The arithmetic mean, also called the average, is the central value of a discrete set of numbers. Specifically, it is the sum of the values divided by the number of values. The median is the middle of a data set. The mode of the data set tells us which value is the most common. On the other hand, measures of spread will tell us how spread out our data set is. According to Peck & Devore [38], the Range (inclusive of the Interquartile range and the Interdecile range), the Standard deviation, the Variance and the Quartiles are examples of measure of spread. The Range depicts how spread-out, is our data. The Interquartile range will tell us where the middle 50 percent of our data is located. Whilst the Quartiles will illustrate the boundaries of the lowest, middle, and upper quarters of the dataset [38]. A correlation matrix was used to quantify dependencies between 35 continuous variables. For this, a Pearson correlation matrix was calculated for all 35 variables. A correlation value between two variables that has an absolute value greater than 0.7 is considered as high and therefore the variables are highly closely related to each other. The objective of this analysis is to establish whether two variables are correlated to each other, and not that they are necessarily causal. The sign of the actual value, which is either positive or negative, provides information about whether two variables are positively or inversely related to each other [40,41]. For example, the correlation value between sales and input vat is 0.98, meaning that there is a direct positive relationship between the two variables. This is rational, because input vat is charged on all purchases of goods and services, which will later become sales of goods and services by the entity. (Table 2).

The correlation matrix and heat maps generated across the 35 variables are a valuable visual representation of VAT data set trends. While the correlation matrix and the heat maps produce the same conclusion, the heat maps can provide further information about the distribution and localization of correlated variables. Our method of generating heat maps can visualize the correlations between multiple variables, providing a broader analysis than using a correlation matrix.

Summary statistics (Table 3)

Correlation matrix (Table 4)

Correlation plots (Figure 2 -7).

Results and Discussion

Data pre-processing

Normalizing the data as mentioned in Task 3, generally speeds up learning and leads to faster convergence. Accordingly, mapping data to around zero produces a much faster training speed than mapping them to the intervals far away from zero or using un-normalized raw data. Academic researchers [35] point to the importance of data normalization prior to the neural network training to improve the speed of calculations and obtain satisfactory results in nuclear power plant application. In the opinion of various authors statistical normalization techniques enhance the reliability and the performance of the trained model [42].

SOM training algorithm

In training algorithm, the SOM map is trained iteratively by taking training data vectors one by one from a training data vector sequence, finding the Best Matching Unit (BMU) for the selected training data vector on the map and updating the BMU and its neighbors closer toward the data vector. This process of finding the BMU and updating the prototype vectors are repeated until a predefined number of training iterations or epochs is completed. The SOM training progress plot is depicted in figure 8 below.

SOM neighbour distance

The neighbor distance is often referred to as the “U-Matrix”. This visualization is of the distance between each node and its neighbors. Typically viewed with a grayscale palette, areas of low neighbor distance indicate groups of nodes that are similar. Areas with large distances indicate the nodes are much more dissimilar. Furthermore, they indicate natural boundaries between node clusters. Them SOM Neighbor distance plot (Figure 9) [43-49].

Artificial neural network-SOM heat map

The ANN-SOM heat map is the outcome of the Neural Network Self-Organizing map (SOM) algorithm we trained on the VAT dataset, which has 35 continuous numeric variables. The heat map shows the distribution of all variables across the SOM. We stated before that the dataset used in this experiment spans a period of 6 years from 2013 to 2018. The outcome is a grid of 16 Nodes from 5065 observations belonging to the mining industry (Figure 10) [50-55].

Results and Conclusion

As already mentioned, our VAT dataset consists of 35 continuous variables. The continuous variables are made up of variables like Output VAT, Input VAT, Sales, Cost of Sales, VAT Refund, VAT Payable, to name just a few. The sample size consists of 5065 different VAT taxpayers all belonging to the mining industry. In our experiments, the ANN-SOM map size is 4x4. The SOM cluster heat map contains sixteen distinct clusters and the dots on the cluster represent individual taxpayers or entities. In the ANN-SOM Heat map above we observe that VAT vendors or entities, for example with similar VAT return characteristics, are grouped in the same area or node. In business, users are more interested in “abnormal clusters” or hot spots. That is, clusters of VAT vendors who have suspicious behaviour rather than normal nodes or clusters. We use three approaches to identify hot spots. That is, by using the ANN-SOM Heat map. Distance matrix Visualization and domain experts’ feedback based on component plane visualizations. Using distance matrix visualizations, homogenous clusters (low variation) will have shorter neighbor distances (the white regions) compared to high variation clusters (the dark regions) as shown in Figure 9. The value of a component in a node is the mean value of entities. (VAT Vendors) in the node and its neighbors. The average value of entities is determined by the neighborhood function and the final radius used in the final training (Figure 8). The color coding of the map is created based on the minimum and maximum values of the component of the map. In this research paper, we use the grey color map where the maximum value is assigned black, and the minimum value is assigned white.

However, when interpreting the ANN-SOM Heat map, the abnormal clusters are those that have a fewer number of entities. That is, these nodes are composed of suspicious VAT vendors. Such VAT vendors require detailed human verification by VAT audit specialists. Node 4, for example, has the largest number of entities at 4948. The entities clustered in Node 4 are homogeneous in nature, and thus depict VAT entities with normal behaviour. VAT fraud or suspicious behaviour can be differentiated by observing VAT declarations form attributes such as VAT Liability, Exempt supplies, Diesel Refund, and Input VAT on Capital Goods purchased. Detection of suspicions VAT declarations is a very challenging task as VAT declarations dataset are extremely unbalanced in nature. Furthermore, the tax fraud domain is full of unlabeled data, which in turn makes it difficult to use supervised learning approaches. In this research paper, we proposed an unsupervised learning approach. Nevertheless, it is crucial to have an all-encompassing review on detecting VAT fraud. This is to broaden the understanding and knowledge of the VAT fraud phenomenon among researchers and in the government marketing domain. Remarkably supervised learning algorithms have proved to be limited in the arena of VAT fraud detection, since the tax administrations have extremely low to non-existent labelled historic data. This in turn cripple the efficacy of supervised learning approaches.

In as much as this paper’s focal point is on VAT fraud detection, we are confident that the present model may just as well be applicable to other tax types, like Industry Income Tax and Personal Income Tax for instance. This research outcome shows the potential of AI techniques in the realm of VAT fraud. Furthermore, this review put forward high-level and detailed digital classification frameworks on VAT fraud detection. Additionally, the e-platform framework proposed present tax auditors with a systemic case selection guide of suspicious VAT returns. Consequently, combining the two frameworks into a single hybrid approach can improve the success of detecting other VAT fraud schemes. Tax administration may be able to select the most appropriate unsupervised learning technique from this work having considered other alternatives, their operational requirements and business context. Thus, leading to a multitude of available AI aided VAT fraud detection algorithms and approaches. Additionally, the techniques proposed in this paper should help tax administrations with precise case selection using an empirical and data-driven approach, which does not depend upon a labeled historic VAT dataset. Furthermore, we envisage the approach should result in high hit ratio on suspicious VAT returns, and thus improve tax compliance due to the increased likelihood of detection. We have demonstrated the use of ANN-SOM in exploring hot spots in a large real-world Value-Added Tax domain. Based on our experiments, our approach is an effective instrument for hot spots and heat map exploration since it employs visualizations techniques that are easy to understand. In future different profiling or clustering algorithms and sampling techniques can be applied to further improve the performance of the proposed approach. Notwithstanding, compared with supervised approaches, unsupervised methods are less precise. That is, they will not only identify tax fraud cases, but will also indicate taxpayers with irregular and suspicious tax behavior and dishonest taxpayers. Future research studies using hybrid algorithms may produce higher quality research outcomes.


To Know more about Journal of Forensic Sciences & Criminal Investigation
Click here: https://juniperpublishers.com/jfsci/index.php

To Know more about our Juniper Publishers
Click here: https://juniperpublishers.com/index.php


Tuesday, February 20, 2024

The Role of ‘’Artificial Intelligence’’ in Chemistry Examining the Strategy of ‘’Glaser’s Choice Theory’’ and ‘’Game Theory’’ in How to Synthesize Chemical Compounds - Juniper Publishers

 Petrochemical Science - Juniper Publishers


Abstract

Chemists have traditionally relied on experiments to gather data and analyze it in order to advance their understanding of chemistry. However, since the 1960s, computer methods have been developed to assist chemists in this process, leading to the emergence of a new discipline known as chemo-informatics. This field has found applications in various areas such as drug discovery, analytical chemistry, and material science. One approach that has gained momentum in recent years is the use of artificial intelligence (AI) in chemistry. AI has been employed for tasks such as predicting molecular properties, designing new molecules, and validating proposed retrosynthesis and reaction conditions. Its use has led to significant progress in drug discovery R&D by reducing costs and time-related problems. Despite these advancements, the concept of AI in chemistry remains relatively unexplored. The use of artificial intelligence (AI) in chemistry has experienced significant growth in recent years. Both journal and patent publications have seen a substantial increase, particularly since 2015. Analytical chemistry and biochemistry have shown the greatest integration of AI, with the highest growth rates. In summary, this review provides a comprehensive overview of how AI has progressed in various fields of chemistry and aims to provide insight into its future directions for scholarly audiences.

Keywords: Artificial Intelligence; Chemistry; Synthesis; Chemical Compounds; Glaser’s Choice Theory; Game Theory

Abbreviations: QSPR: Quantitative Structure Property; QSAR: Quantitative Structure Activity Relationships; ANN: Artificial Neural Networks; DNN: CASD: Deep Neural Networks; Computer-Assisted Synthesis Design; ML: Machine Learning; DL: Deep Learning; MDP: Markov Decision Processes; POSG: Partially Observable Stochastic Game

Introduction

When I was an undergraduate student, I always had problems with the synthesis of chemical compounds! I always wondered why we should preserve the method of synthesizing different materials somehow! This problem bothered me to the point that, at the time when the new generation of smart phones was beginning to emerge, it led me to the idea of finding a way to computerize the raw materials of chemical compounds to combine with each other and get the desired product. Actually, I was thinking of an algorithm! At that time, I still didn’t know anything about programming and data science; also, machine learning or artificial intelligence had not been so developed. My idea remained sterile until I met artificial intelligence; this is the beginning of a new era of chemistry!

Chemistry in Times of Artificial Intelligence

In 1956, John McCarthy coined the term “artificial intelligence” to refer to the branch of computer science concerned with machine learning processes that can perform tasks typically requiring human intelligence. This involves replicating human intelligence in machines, which has become a crucial aspect of the technology industry due to its ability to collect and analyze data at low cost while ensuring a safe working environment. Artificial intelligence has numerous applications, including natural language processing, reasoning, and strategic decision-making. It can also modify objects based on specific requirements. Artificial intelligence is not limited to engineering but also has many applications in the chemical field. It is useful for designing molecules and predicting their properties such as melting point, solubility, stability, HOMO/LUMO levels, and more. Additionally, artificial intelligence aids in drug discovery by determining molecular structures and their effects on chemicals. This process is time-consuming due to its multi-objective nature; however, artificial intelligence can expedite it by utilizing previously available datasets. In summary, artificial intelligence is a critical component of modern technology that enables machines to replicate human intelligence and perform complex tasks. Its applications extend beyond engineering into fields such as chemistry where it aids in drug discovery and molecular design.

This combination allows for the development of advanced water treatment systems that are highly efficient and effective in removing pollutants from water sources. By using nanotechnology, it is possible to create materials with unique properties that can selectively remove specific pollutants from water. Artificial intelligence can be used to optimize the performance of these materials and ensure that they are used in the most effective way possible. Furthermore, this technology can also be used to monitor water quality in real-time, allowing for early detection of potential contamination events. This is particularly important in areas where access to clean water is limited or where there are concerns about the safety of drinking water. Overall, the combination of artificial intelligence and nanotechnology has the potential to revolutionize the way we treat and manage our water resources. It offers a powerful tool for addressing some of the most pressing environmental challenges facing our society today.

Chemistry has experienced a significant increase in data, which coincided with the advent of powerful computer technology. This allowed for the use of computers to perform mathematical operations, such as those required for quantum mechanics, which is the foundation of chemistry. This deductive learning approach involves using a theory to produce data. However, it was also discovered that computers can be used for logical operations and software can be developed to process data and information, leading to inductive learning. For instance, understanding the biological activity of a compound requires knowledge of its structure. By analyzing multiple sets of structures and their corresponding biological activities, one can generalize and gain knowledge about the relationship between structure and biological activity. This field is known as chemoinformatics and emerged from computer methods developed in the 1960s for inductive learning in chemistry.

Initially, methods were developed to represent chemical structures and reactions in computer systems. Subsequently, chemometrics, a field that combined statistical and pattern recognition techniques, was introduced for inductive learning. These methods were applied to analyze data from analytical chemistry. However, chemists also sought to address complex questions such as:

1. Determining the necessary structure for a desired property;

2. Synthesizing the required structure;

3. Predicting the outcome of a reaction.

To predict properties quantitatively, researchers established quantitative structure property/activity relationships (QSPR and QSAR). Early efforts were made to develop computer-assisted synthesis design tools. Finally, automatic procedures for structure elucidation were needed to answer the third question.

Artificial Intelligence

Early on, it was recognized that developing systems for predicting properties, designing synthesis, and elucidating structures in chemistry would require significant conceptual work and advanced computer technology. Consequently, emerging methods from computer science were applied to chemistry, including those under the umbrella of artificial intelligence. Publications such as “Applications of Artificial Intelligence for Chemical Inference” emerged from the DENDRAL project at Stanford University, which aimed to predict compound structures from mass spectra. Despite collaboration between esteemed chemists and computer scientists and extensive development efforts, the DENDRAL project was eventually discontinued due to various reasons, including the waning reputation of artificial intelligence in the late 1970s.However, recent years have seen a resurgence of artificial intelligence in general and its application in chemistry in particular. This is due to several factors such as the availability of large amounts of data, increased computing power, and new methods for processing data. These methods are often referred to as “machine learning,” although there is no clear distinction between this term and artificial intelligence.

Databases

Initially, various computer-readable representations of chemical structures were explored for processing and building databases of chemical structures and reactions. Linear notations were preferred due to their conciseness but required a significant set of rules for encoding. However, with the rapid development of computer technology, storage space became more easily and cheaply available, enabling the coding of chemical structures in a manner that opened up many possibilities for structure processing and manipulation. Eventually, the representation of chemical structures by a connection table - lists of atoms and bonds - became the norm. This allows for atomic resolution representation of structure information and access to each bond in a molecule. Despite this shift, one linear code - SMILES notation - remains widely used due to its ease of conversion into a connection table and suitability for sharing chemical structure information online. A molecular structure can be viewed as a mathematical graph. To store and retrieve chemical structures appropriately, various graph theoretical problems had to be solved such as unique and unambiguous numbering of atoms in a molecule, ring perception, tautomer perception, etc. The use of connection tables enabled the development of methods for full structure, substructure, and similarity searching.

Prediction of Properties

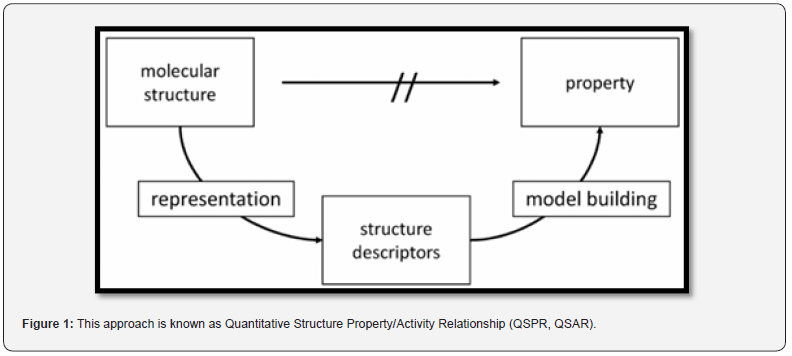
This approach is known as quantitative structure-activity relationship (QSAR) modeling. QSAR models have been successfully used to predict a wide range of properties, including toxicity, bioactivity, and physical properties such as solubility and melting point. Another approach to predicting properties is through the use of machine learning algorithms. These algorithms can analyze large amounts of data and identify patterns that can be used to make predictions. Machine learning has been applied to a variety of chemical problems, including drug discovery and materials design. Overall, the ability to predict chemical properties is essential for drug discovery, materials science, and many other fields. The development of methods for processing chemical structures and building databases has enabled the creation of powerful tools for predicting properties and accelerating scientific discovery (Figure 1).

This approach is known as Quantitative Structure Property/ Activity Relationship (QSPR, QSAR). Many different methods for the calculation of structure descriptors have been developed. They represent molecules with increasing detail: 1D, 2D, 3D descriptors, representations of molecular surface properties, and even taking account of molecular flexibility. Also, quite a variety of mathematical methods for modeling the relationship between the molecular descriptors and the property of a compound are available. These are the inductive learning methods and are sometimes subsumed by names like data analysis methods, machine learning, or data mining. They comprise methods like a simple multi-linear regression analysis, a variety of pattern recognition methods, random forests, support vector machines, and artificial neural networks. Artificial neural networks (ANN) try to model the information processing in the human brain and offer much potential for studying chemical data.

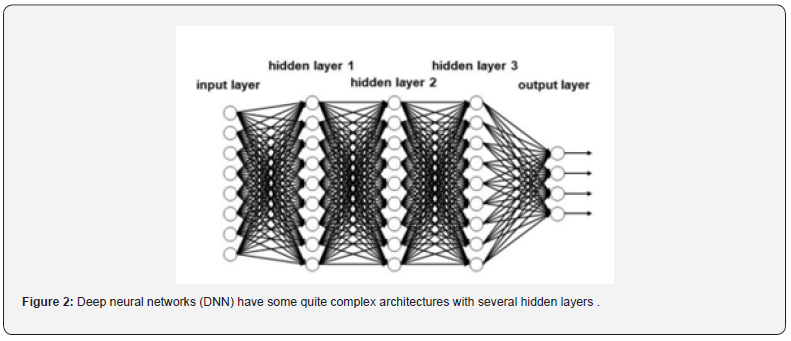
For establishing a relationship between the molecular descriptors and the property, values, so-called weights, have to be attributed to the connections between the neurons. This is most often achieved by the so-called backpropagation algorithm by repeatedly presenting pairs of molecular descriptors and their properties; these iterations quite often go into the ten-thousands and more. An ANN has the advantage that the mathematical relationship between the input units and the output need not be specified or known; it is implicitly laid down in the weights and can also comprise non-linear relationships. It was tempting to envisage that with artificial neural networks the field of artificial intelligence was awakening again. And in fact, in recent years terms like deep learning or deep neural networks have appeared in many fields including chemistry that provide a renaissance to the domain of artificial intelligence. A deep neural network (observe that the network has been rotated by 90 degrees compared to the one in Figure 2).

Deep neural networks (DNN) have some quite complex architectures with several hidden layers .This has the consequence that many weights for the connections have to be determined in order to avoid overfitting. Novel approaches and algorithms had to be developed to obtain networks that have true predictivity. Deep neural networks need a large amount of data for training in order to obtain truly predictive models. Most applications of DNN have been made in drug design and in analyzing reaction data (vide infra).

Reaction Prediction and Computer-Assisted Synthesis Design (CASD)

These new systems use machine learning algorithms and deep neural networks to predict reactions and suggest synthesis pathways. The accuracy of these systems has improved significantly, with some achieving success rates of over 90% in predicting reactions and suggesting synthetic routes. Such systems have the potential to revolutionize the field of organic synthesis by enabling chemists to design new molecules and synthesize them more efficiently. However, there are still challenges to overcome, such as the need for more comprehensive reaction databases and the development of more accurate machine learning models. Nonetheless, the progress made in recent years suggests that computer-assisted synthesis design will become an increasingly important tool for organic chemists in the future.

The development of computer-assisted synthesis design (CASD) systems has been hindered until recently due to limited reaction databases and search procedures. However, with the availability of large reaction databases and novel data processing algorithms, CASD systems have been developed using machine learning algorithms and deep neural networks to predict reactions and suggest synthesis pathways. These systems have achieved high success rates in predicting reactions and suggesting synthetic routes, with the potential to revolutionize organic synthesis. Nonetheless, challenges remain, such as the need for more comprehensive reaction databases and more accurate machine learning models. Methods for calculating values for concepts like synthetic accessibility or current complexity have also been developed to assist chemists in selecting molecules for further investigation. The combination of large reaction databases with novel data processing algorithms has matured CASD systems, making them a valuable tool for organic chemists in planning laboratory work.

Computer-assisted synthesis design (CASD) systems have recently emerged as a valuable tool for organic chemists, facilitated by the availability of large reaction databases and novel data processing algorithms. Machine learning algorithms and deep neural networks have been used to predict reactions and suggest synthesis pathways, achieving high success rates. However, challenges remain, such as the need for more comprehensive reaction databases and more accurate machine learning models. Methods for calculating values for concepts like synthetic accessibility or current complexity have also been developed to assist chemists in selecting molecules for further investigation. The combination of large reaction databases with novel data processing algorithms has matured CASD systems, making them a promising tool for planning laboratory work. In addition, the use of bioinformatics and chemoinformatics methods in combination has led to interesting insights in the study of biochemical pathways, including the identification of major pathways for periodontal disease and the derivation of flavor-forming pathways in cheese by lactic acid bacteria. Finally, novel artificial intelligence methods such as deep learning architectures are being applied to metabolic pathway prediction, offering exciting possibilities for pathway redesign.

Cosmetics Products Discovery

In recent years, chemoinformatics and bioinformatics methods that have established their value in drug discovery such as molecular modeling, structure-based design, molecular dynamics simulations and gene expression have also been utilized in the development of new cosmetics products. Thus, novel skin moisturizers and anti-aging compounds have been developed. Legislation has been passed in the European Union with the Cosmetics Directive that no chemicals are longer allowed to be added to cosmetics products that have been tested on animals. This has given a large push to the establishment of computer models for the prediction of toxicity of chemicals to be potentially included in cosmetics products.

Material Science

The prediction of the properties of materials is probably the most active area of chemoinformatics. The properties that are investigated range from properties of nanomaterials, materials from regenerative medicine, solar cells, homogeneous or heterogeneous catalysts, electrocatalysts, phase diagrams, ceramics, or the properties of supercritical solvents. Reviews have appeared. In most cases, the chemical structure of the material investigated is not known and therefore other types of descriptors have to be chosen to represent a material for a QSAR study. Materials could be represented by physical properties such as refractive index or melting point, spectra, the components or the conditions for the production of the material, etc. Use of chemoinformatics methods in material science are particularly opportune as in most cases the properties of interest depend on many parameters and cannot be directly calculated. A QSAR model would allow the design of new materials with the desired property.

Process Control

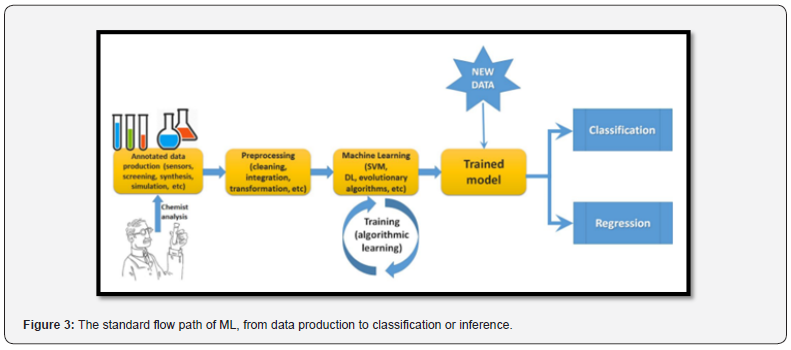
The problem of the detection of faults in chemical processes and process control have benefited quite early on from the application of artificial neural networks. An overall course on the application of artificial intelligence in process control has been developed by six European universities. Chemical processes rapidly generate a host of data on flow of chemicals, concentration, temperature, pressure, product distribution, etc. This data have to be used to recognize potential faults in the process and rapidly bring the process back to optimum. The relationships between the various data produced by sensors and the amount of desired product cannot be explicitly given, making it an ideal case for the application of powerful data modeling techniques. Quite a few excellent results have been obtained for such processes as Petrochemical or pharmaceutical processes, water treatment, agriculture, iron manufacture, exhaust gas denitration, distillation column operation, etc. (Figure 3).

Identification of Compounds with Genetic Algorithms

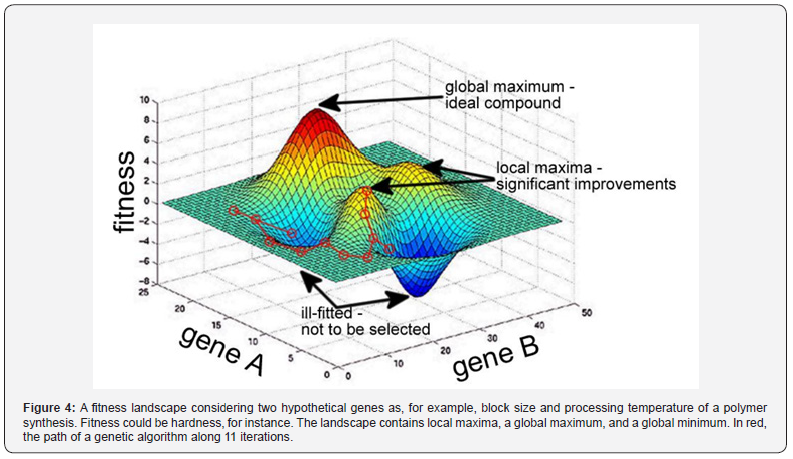
Bio-inspired computing involves the development of procedures that mimic mechanisms observed in natural environments. For example, genetic algorithms are inspired by Charles Darwin’s concept of evolution and use the principle of “survival of the fittest” to facilitate optimization. In this process, active compounds interbreed and mutate to produce new compounds with new properties. Compounds that show useful properties are selected for further synthesis, while those that do not have useful properties are ignored. After several generations, new functional compounds appear with inherited and acquired properties. This process requires accurate composition modeling, appropriate mutation methods, and robust fitness assessments that can be obtained computationally, reducing the need for expensive experiments. In genetic algorithms, each compositional or structural feature of a compound is considered a gene. Chemical genes include factors such as individual components, polymer block size, monomer compositions, and processing temperature. Genome contains all the genes of a combination, and the resulting properties are known as phenotypes. Genetic algorithms scan the search space of gene domains to identify the most suitable phenotypes based on a fitness function. The relationship between genome and phenotype creates a fitness perspective, as shown in the figure below for two hypothetical genes related to polymer synthesis processes aimed at high hardening rates. The fitness perspective is implicit in the problem model defined by gene domains and fitness function.

The genetic algorithm moves along the landscape generating new combinations while avoiding combinations that do not improve fitness. This mechanism increases the probability of achieving the desired properties. Bio-inspired computing involves mimicking natural mechanisms to develop optimization methods. Genetic algorithms, inspired by Charles Darwin’s concept of evolution, use the principle of “survival of the fittest” to create new combinations with new characteristics. Each trait is considered a combination of a gene, and the genome includes all the genes of a combination, resulting in a phenotype. Genetic algorithms scan the search space of gene domains to identify the most suitable phenotypes based on a fitness function. The relationship between genome and phenotype creates a fitness landscape that is implicit in the problem model defined by gene domains and fitness functions. This mechanism increases the probability of achieving the desired properties. The effectiveness of genetic algorithms has been shown in various fields, including catalyst optimization and material science (Figure 4).

Synthesis Prediction Using ML

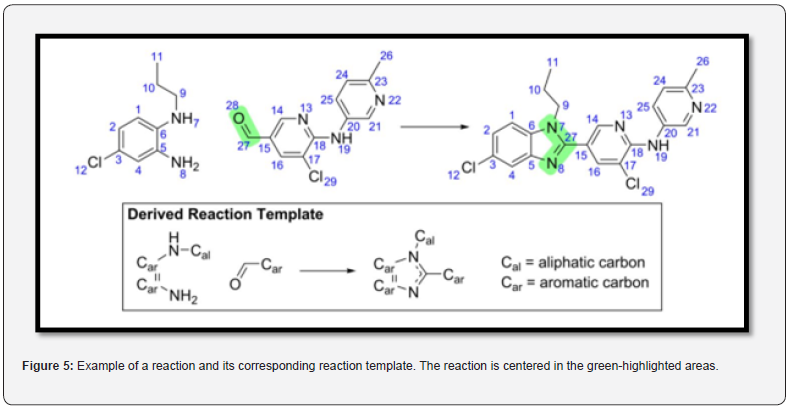
The challenging task of synthesizing new compounds, particularly in organic chemistry, has led to the search for machine-based methods that can predict the molecules produced from a given set of reactants and reagents. Corey and Wipke’s 1969 approach used templates produced by expert chemists to define atom connectivity rearrangement under specific conditions. However, limited template sets prevented their method from encompassing a wide range of conditions. The use of templates or rules to transfer knowledge from human experts to computers has gained renewed interest due to the potential for automatic rule generation using big datasets, as seen in medicine and materials science. Machine learning methods, such as neural networks, have been successful in predicting retrosynthesis outcomes using large datasets. Deep learning appears to be the most promising approach for exploring large search spaces. Recent experiments using link prediction ML algorithms on a knowledge graph built from millions of binary reactions have shown high accuracy in predicting products and detecting unlikely reactions (Figure 5).

The Corresponding Template Includes the Reaction Center and Nearby Functional Groups

Reproduced from the search for machine-based methods to predict the molecules produced from a given set of reactants and reagents in organic chemistry has led to the use of templates and rules to transfer knowledge from human experts to computers. However, limited template sets have prevented these methods from encompassing a wide range of conditions. Recent experiments using machine learning (ML) methods, such as neural networks and deep learning (DL), have shown high accuracy in predicting products and detecting unlikely reactions. DL appears to be the most promising approach for exploring large search spaces and has been used to predict outcomes of chemical reactions by assimilating latent patterns for generalizing out of a pool of examples. The SMILES chemical language has been employed in DL models to represent molecular structures as graphs and strings amenable to computational processing. DNNs have been used to predict reactions with superior performance compared to previous rule-based expert systems, achieving an accuracy of 97% on a validation set of 1 million reactions. Additionally, DNNs have been used to map discrete molecules into a continuous multidimensional space, where it is possible to predict properties of existing vectors and predict new vectors with certain properties. Optimization techniques can then be employed to search for the best candidate molecules.

Learning from data has always been a cornerstone of chemical research. In the last sixty years computer methods have been introduced in chemistry to convert data into information and then derive knowledge from this information. This has led to the establishment of the field of chemoinformatics that has undergone impressive developments over the last 60 years and found applications in most areas of chemistry from drug design to material science. Artificial intelligence techniques have recently seen a rebirth in chemistry and will have to be optimized to also allow us to understand the basic foundations of chemical data. This review examines the growth and distribution of AI-related chemistry publications over the past two decades using the CAS Content Collection.

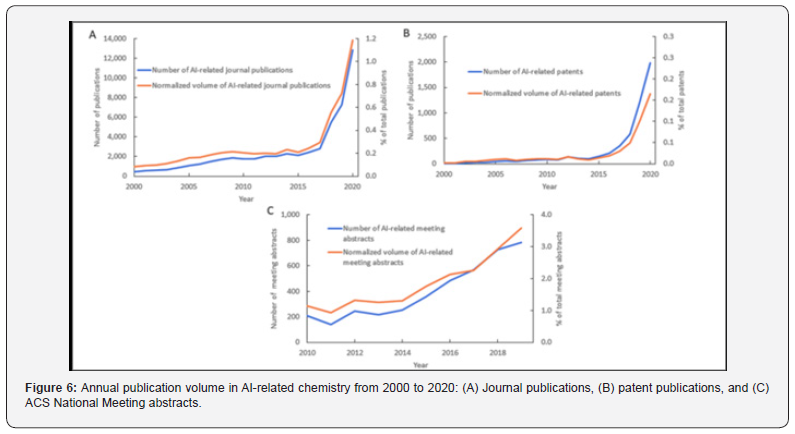
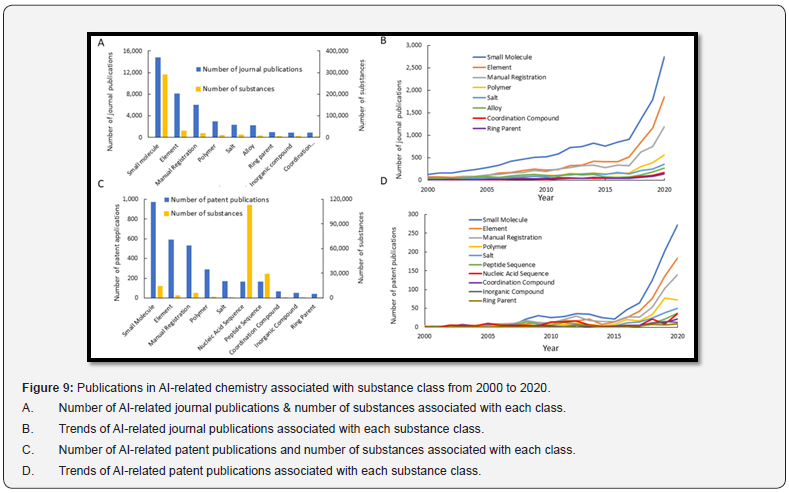
The volume of journal and patent publications has increased significantly, particularly since 2015. Analytical chemistry and biochemistry have integrated AI to the greatest extent and with the highest growth rates. Interdisciplinary research trends were also identified, along with emerging associations of AI with certain chemistry research topics. Notable publications in various chemistry disciplines were evaluated to highlight emerging use cases. The occurrence of different classes of substances and their roles in AI-related chemistry research were quantified, detailing the popularity of AI adoption in life sciences and analytical chemistry. AI can be applied to various tasks in chemistry, where complex relationships are often present in data sets. AI implementations have dramatically reduced design and experimental effort by enabling laboratory automation, predicting bioactivities of new drugs, optimizing reaction conditions, and suggesting synthetic routes to complex target molecules. This review contextualizes the current AI landscape in chemistry, providing an understanding of its future directions (Figure 6).

This review analyzes the growth and distribution of AIrelated chemistry publications over the past two decades using the CAS content collection. The volume of journal publications and patents has increased significantly since 2015 in particular, as analytical chemistry and biochemistry have integrated artificial intelligence with the largest amount and the highest growth rate. Interdisciplinary research trends were identified, along with emerging connections of artificial intelligence to specific chemistry research topics. Significant publications in various chemistry disciplines were evaluated to highlight emerging applications. The popularity of artificial intelligence adoption in life sciences and analytical chemistry was determined by examining the occurrence of different classes of materials and their role in artificial intelligence-related chemistry research. Artificial intelligence has reduced experimental design and effort by enabling laboratory automation, predicting the bioactivities of new drugs, optimizing reaction conditions, and suggesting synthetic routes to complex target molecules. This review examines the current landscape of artificial intelligence in chemistry and provides insight into its future directions. The CAS content corpus was searched to identify publications related to artificial intelligence from 2000 to 2020 based on various artificial intelligence terms in the title, keywords, abstract text, and concepts selected by CAS experts. Approximately 70,000 journal publications and 17,500 patents from the CAS content collection were identified as related to AI. The number of journal publications and patents increased over time and showed similar fast-growing trends after 2015. The proportion of research related to artificial intelligence is increasing, indicating an absolute increase in research efforts for artificial intelligence in chemistry.

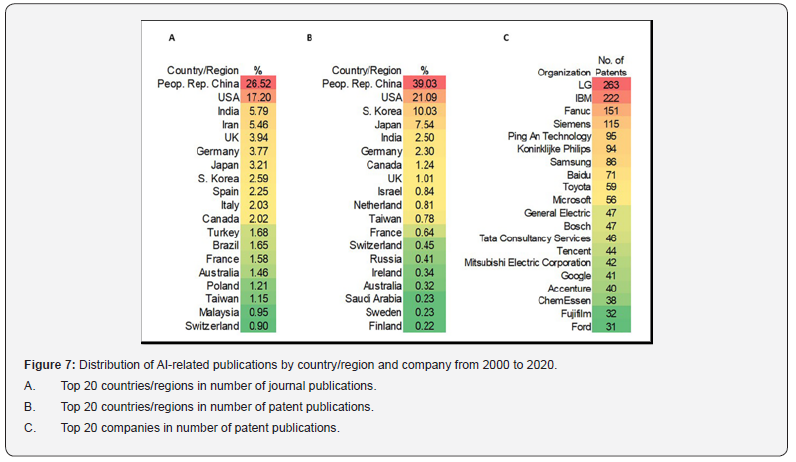
This review analyzes the growth and distribution of AI-related chemistry publications over the past two decades using the CAS Content Collection. The volume of journal and patent publications has significantly increased, especially since 2015, with analytical chemistry and biochemistry integrating AI to the greatest extent and with the highest growth rates. Interdisciplinary research trends were identified, along with emerging associations of AI with specific chemistry research topics. Notable publications in various chemistry disciplines were evaluated to highlight emerging use cases. The popularity of AI adoption in life sciences and analytical chemistry was quantified by examining the occurrence of different classes of substances and their roles in AI-related chemistry research. AI has reduced design and experimental effort by enabling laboratory automation, predicting bioactivities of new drugs, optimizing reaction conditions, and suggesting synthetic routes to complex target molecules. This review contextualizes the current AI landscape in chemistry and provides an understanding of its future directions. The CAS Content Collection was searched to identify AI-related publications from 2000 to 2020 based on various AI terms in their title, keywords, abstract text, and CAS expert-curated concepts. Roughly 70,000 journal publications and 17,500 patents from the CAS Content Collection were identified as related to AI. The numbers of both journal and patent publications increased with time, showing similar rapidly growing trends after 2015. The proportion of AI-related research is increasing, suggesting an absolute increase in research effort toward AI in chemistry (Figure 7).

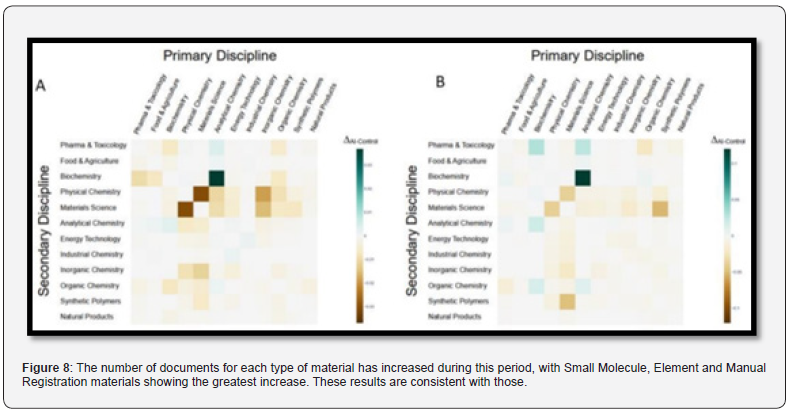
Here, the growth and distribution of AI-related chemistry publications over the past two decades is reviewed using the CAS content collection. The volume of journal publications and patents has increased significantly, especially since 2015, with analytical chemistry and biochemistry incorporating AI the most and with the highest growth rates. Interdisciplinary research trends were identified, along with emerging connections of artificial intelligence to specific chemistry research topics. Significant publications in various chemistry disciplines were evaluated to highlight emerging applications. The popularity of artificial intelligence adoption in life sciences and analytical chemistry was determined by examining the occurrence of different classes of materials and their role in artificial intelligence-related chemistry research. Artificial intelligence has reduced experimental design and effort by enabling laboratory automation, predicting the bioactivities of new drugs, optimizing reaction conditions, and suggesting synthetic routes to complex target molecules. This review examines the current landscape of artificial intelligence in chemistry and provides insight into its future directions. Then the countries/regions and organizations of origin of AIrelated chemistry documents were extracted to determine their distribution. China and the United States had the highest number of publications for both journal articles and patents. Medical diagnostics developers and technology companies make up a large portion of commercial licensees for chemical AI research. Publication trends in specific research areas were also analyzed, and analytical chemistry had the highest normalized volume in recent years. Energy technology and environmental chemistry and industrial chemistry and chemical engineering are also growing fields in terms of research related to artificial intelligence. Biochemistry is heavily featured in AI-related patent publications, likely due to its use in drug research and development.

This article examines the growth and distribution of AI-related chemistry publications using the CAS Content Collection over the past two decades. The volume of journal and patent publications has significantly increased, particularly since 2015, with analytical chemistry and biochemistry integrating AI to the greatest extent and with the highest growth rates. Interdisciplinary research trends were identified, along with emerging associations of AI with specific chemistry research topics. Notable publications in various chemistry disciplines were evaluated to highlight emerging use cases. The popularity of AI adoption in life sciences and analytical chemistry was quantified by examining the occurrence of different classes of substances and their roles in AI-related chemistry research. AI has reduced design and experimental effort by enabling laboratory automation, predicting bioactivities of new drugs, optimizing reaction conditions, and suggesting synthetic routes to complex target molecules.

This review contextualizes the current AI landscape in chemistry and provides an understanding of its future directions. The countries/regions and organizations of origin for AI-related chemistry documents were then extracted to determine their distributions. China and the United States contributed the largest numbers of publications for both journal articles and patents. Medical diagnostic developers and technology companies make up a large portion of the commercial patent assignees for AI chemical research. Trends of publications in specific research areas were also analyzed, with Analytical Chemistry having the highest normalized volume in recent years. Energy Technology and Environmental Chemistry and Industrial Chemistry and Chemical Engineering are also growing fields in terms of AIrelated research. Biochemistry is highly represented in AI-related patent publications, possibly due to its use in drug research and development. Interdisciplinary relationships do appear in AIrelated chemistry research, demonstrating how AI can be applied in research areas where the relationships between available data in separate domains are not obvious to researchers (Figure 8).

Difference in proportion of total AI-related publications and control group (non-AI related) by interdisciplinary pair: (A) journal publications and (B) patent publications. The distribution of AI-related research in chemistry can be analyzed by examining the number of papers related to different classes of materials. Overcoming challenges in material representation and data availability is critical to implementing artificial intelligence in chemistry. Therefore, identifying the most common types of materials studied in the literature can indicate areas where researchers have successfully addressed these challenges. CAS classifies materials into several classes, and the figure below shows the number of AI-related journal publications for common material classes, including alloy, coordinated compound, element, hand register, ring parent, small molecule, polymer, salt, and inorganic compound. Gives. Publications containing Small Molecule materials have the largest number, followed by publications containing Element and Manual Registration materials. This trend is probably due to the relative simplicity and ease of modeling of these materials compared to Coordination Compound and Polymer. The high number of documents containing manual recording material corresponds to the high volume of publications in biochemistry. The figure below also shows the total number of materials in AI-related journal publications for each material class. The process in substance counting is similar to document counting, although skewed by the higher number of small molecule substances in each document (Figure 9).

The popularity of AI applications in chemistry has grown rapidly in recent years, with some fields further along in adoption than others. The success of AI implementation is linked to the availability and quality of data, as well as opportunities for gaining insights and automating repetitive tasks. Analytical chemistry and biochemistry have seen significant AI deployment due to the availability of large training sets and data for macromolecules. The popularity of AI applications in drug discovery is reflected in the large number of publications involving small molecules. The increased availability of software and hardware tools, research area-specific data sets, and researcher expertise have contributed to the growth of AI in chemistry. While AI has been successfully adapted to many areas of chemical research, there are still areas where its impact has yet to be felt. With continued improvements in AI and interdisciplinary research, these areas may see increased adoption in the future.

Glasser’s Choice Theory

Choice theory posits that the behaviors we choose are central to our existence. Our behavior (choices) is driven by five genetically driven needs in hierarchical order: survival, love, power, freedom, and fun. The most basic human needs are survival (physical component) and love (mental component). Without physical (nurturing) and emotional (love), an infant will not survive to attain power, freedom, and fun.

“No matter how well-nourished and intellectually stimulated a child is, going without human touch can stunt his mental, emotional, and even physical growth”.

Choice theory suggests the existence of a “quality world.” The idea of a “quality world” in choice theory has been compared to Jungian archetypes, but Glasser’s acknowledgement of this connection is unclear. Some argue that Glasser’s “quality world” and what Jung would call healthy archetypes share similarities. Our “quality world” images are our role models of an individual’s “perfect” world of parents, relations, possessions, beliefs, etc. How each person’s “quality world” is somewhat unusual, even in the same family of origin, is taken for granted.

Starting from birth and continuing throughout our lives, each person places significant role models, significant possessions, and significant systems of belief (religion, cultural values, icons, etc.) into a mostly unconscious framework Glasser called our “quality world”. The issue of negative role models and stereotypes is not extensively discussed in choice theory. Glasser also posits a “comparing place,” where we compare and contrast our perceptions of people, places, and things immediately in front of us against our ideal images (archetypes) of these in our Quality World framework. Our subconscious pushes us towards calibrating-as best we can-our real-world experience with our quality world (archetypes). Behavior (“total behavior” in Glasser’s terms) is made up of these four components: acting, thinking, feeling, and physiology. Glasser suggests we have considerable control or choice over the first two of these, yet little ability to directly choose the latter two as they are more deeply sub- and unconscious. These four components remain closely intertwined, and the choices we make in our thinking and acting will greatly affect our feelings and physiology.

Glasser frequently emphasizes that failed or strained relationships with significant individuals can contribute to personal unhappiness. Spouses, parents, children, friends, and colleagues. The symptoms of unhappiness are widely variable and are often seen as mental illnesses. Glasser believed that “pleasure” and “happiness” are related but far from synonymous. Sex, for example, is a “pleasure” but may well be divorced from a “satisfactory relationship,” which is a precondition for lasting “happiness” in life. Hence the intense focus on the improvement of relationships in counseling with choice theory-the “new reality therapy”. Individuals who are familiar with both reality therapy and choice theory may have a preference for the latter, which is considered a more modern approach. According to choice theory, mental illness can be linked to personal unhappiness. Glasser champions how we are able to learn and choose alternate behaviors that result in greater personal satisfaction. Reality therapy is a choice theory-based counseling process focused on helping clients learn to make those self-optimizing choices [1].

The Ten Axioms of Choice

a. The only person whose behavior we can control is ourselves.

b. All we can give another person is information.

c. All long-lasting psychological problems are relationship problems.

d. The problem relationship is always part of our present life.

e. What happened in the past has everything to do with who we are today, but we can only satisfy our basic needs right now and plan to continue satisfying them in the future.

f. We can only satisfy our needs by satisfying the pictures in our quality world.

g. All we do is behave.

h. All behavior is total behavior and is made up of four components: acting, thinking, feeling, and physiology.

i. All of our total behavior is chosen, but we only have direct control over the acting and thinking components. We can only control our feelings and physiology indirectly through how we choose to act and think.

j. All total behavior is designated by verbs and named by the part that is the most recognizable.

In Classroom Management

William Glasser’s choice theory begins: Behavior is not separate from choice; we all choose how to behave at any time. Second, we cannot control anyone’s behavior but our own. Glasser emphasized the importance of classroom meetings as a means to improve communication and solve classroom problems. Glasser suggested that teachers should assist students in envisioning a fulfilling school experience and planning the choices that would enable them to achieve it. For example, Johnny Waits is an 18-year-old high school senior and plans on attending college to become a computer programmer. Glasser suggests that Johnny could be learning as much as he can about computers instead of reading Plato. Glasser proposed a curriculum approach that emphasizes practical, real-world topics chosen by students based on their interests and inclinations. This approach is referred to as the quality curriculum. The quality curriculum places particular emphasis on topics that have practical career applications. According to Glasser’s approach, teachers facilitate discussions with students to identify topics they are interested in exploring further when introducing new material. In line with Glasser’s approach, students are expected to articulate the practical value of the material they choose to explore[2].

Education

Glasser did not endorse Summerhill, and the quality schools he oversaw typically had conventional curriculum topics. The main innovation of these schools was a deeper, more humanistic approach to the group process between teachers, students, and learning.

Critiques

In a book review, [3] Christopher White writes that Glasser believes everything in the DSM-IV-TR is a result of an individual’s brain creatively expressing its unhappiness. White also notes that Glasser criticizes the psychiatric profession and questions the effectiveness of medications in treating mental illness. White points out that the book does not provide a set of randomized clinical trials demonstrating the success of Glasser’s teachings.

Quality of World

The Quality Realm is central to William Glasser’s views. A person’s values and priorities are represented in the brain as mental images in a space called the Superior Realm. Photographs of significant people, locations, ideas, and convictions could be filed away in their minds. According to Glasser, the pictures in a human’s Supreme bring them joy and fulfill some fundamental needs. Such images are personal and not subject to any societal norm checking. The Quality Planet is our ideal utopia.

Working of Glasser’s Choice Theory

Clients’ emotions and physiological reactions to stress may be improved via habitual and cognitive modification instruction. The educational field is a perfect illustration of this. Disappointed pupils who are unable to master particular ideas as well as acquire particular talents may be instructed to rethink what they consider a high-quality universe. Some changes can be implemented to emphasize the company’s history of problematic habits and encourage them to identify and address the underlying causes of that habit to prevent a recurrence. An essay on Schema Therapy states that both Theory and its subset, Reality Psychotherapy, do not focus on the past. Customers are urged to live in the now. They encourage people to consider alterations to their routine that could bring about more satisfying outcomes.

Conclusion of session Glasser’s Choice Theory

Glasser’s original version of the Choice Theory posits that at our most fundamental level, choices are made to satisfy a set of requirements. It is hypothesized that people want to choose the option they believe would be best for them, which does not imply that bad judgments will not have negative results. It has been shown, meanwhile, that Psychodynamic Approach may aid individuals in developing more effective approaches to managing issues. Choice Theory originates in traditional habits and has contributed greatly too many academic disciplines.

Game Theory

Game theory is the study of mathematical models of strategic interactions among rational agents. [1]It has applications in all fields of social science, as well as in logic, systems science and computer science. The concepts of game theory are used extensively in economics as well. [2] The traditional methods of game theory addressed two-person zero-sum games, in which each participant’s gains or losses are exactly balanced by the losses and gains of other participants. In the 21st century, the advanced game theories apply to a wider range of behavioral relations; it is now an umbrella term for the science of logical decision making in humans, animals, as well as computers.

Modern game theory began with the idea of mixed-strategy equilibria in two-person zero-sum game and its proof by John von Neumann. Von Neumann’s original proof used the Brouwer fixed-point theorem on continuous mappings into compact convex sets, which became a standard method in game theory and mathematical economics. His paper was followed by the 1944 book Theory of Games and Economic Behavior, co-written with Oskar Morgenstern, which considered cooperative games of several players. [3] The second edition of this book provided an axiomatic theory of expected utility, which allowed mathematical statisticians and economists to treat decision-making under uncertainty. Therefore, it is evident that game theory has evolved over time with consistent efforts of mathematicians, economists and other academicians. Game theory was developed extensively in the 1950s by many scholars. It was explicitly applied to evolution in the 1970s, although similar developments go back at least as far as the 1930s. Game theory has been widely recognized as an important tool in many fields. As of 2020, with the Nobel Memorial Prize in Economic Sciences going to game theorists Paul Milgrom and Robert B. Wilson, fifteen game theorists have won the economics Nobel Prize. John Maynard Smith was awarded the Crafoord Prize for his application of evolutionary game theory [4- 12].

Different types of Games

Cooperative / Non-Cooperative

A game is cooperative if the players are able to form binding commitments externally enforced (e.g. through contract law). A game is non-cooperative if players cannot form alliances or if all agreements need to be self-enforcing (e.g., through credible threats). [13] Cooperative games are often analyzed through the framework of cooperative game theory, which focuses on predicting which coalitions will form, the joint actions that groups take, and the resulting collective payoffs. It is opposed to the traditional non-cooperative game theory which focuses on predicting individual players’ actions and payoffs and analyzing Nash equilibria.[14,15] The focus on individual payoff can result in a phenomenon known as Tragedy of the Commons, where resources are used to a collectively inefficient level. The lack of formal negotiation leads to the deterioration of public goods through over-use and under provision that stems from private incentives. [16]Cooperative game theory provides a high-level approach as it describes only the structure, strategies, and payoffs of coalitions, whereas non-cooperative game theory also looks at how bargaining procedures will affect the distribution of payoffs within each coalition.

As non-cooperative game theory is more general, cooperative games can be analyzed through the approach of non-cooperative game theory (the converse does not hold) provided that sufficient assumptions are made to encompass all the possible strategies available to players due to the possibility of external enforcement of cooperation. While using a single theory may be desirable, in many instances insufficient information is available to accurately model the formal procedures available during the strategic bargaining process, or the resulting model would be too complex to offer a practical tool in the real world. In such cases, cooperative game theory provides a simplified approach that allows analysis of the game at large without having to make any assumption about bargaining powers.

Symmetric / Asymmetric

A symmetric game is a game where the payoffs for playing a particular strategy depend only on the other strategies employed, not on who is playing them. That is, if the identities of the players can be changed without changing the payoff to the strategies, then a game is symmetric. Many of the commonly studied 2×2 games are symmetric. The standard representations of chicken, the prisoner’s dilemma, and the stag hunt are all symmetric games. Some scholars would consider certain asymmetric games as examples of these games as well. However, the most common payoffs for each of these games are symmetric. The most commonly studied asymmetric games are games where there are not identical strategy sets for both players. For instance, the ultimatum game and similarly the dictator game have different strategies for each player. It is possible, however, for a game to have identical strategies for both players yet be asymmetric. For example, the game pictured in this section’s graphic is asymmetric despite having identical strategy sets for both players (Table 1).

Zero-Sum / Non-Zero-Sum

Zero-sum games (more generally, constant-sum games) are games in which choices by players can neither increase nor decrease the available resources. In zero-sum games, the total benefit goes to all players in a game, for every combination of strategies, always adds to zero (more informally, a player benefits only at the equal expense of others). [17] Poker exemplifies a zero-sum game (ignoring the possibility of the house’s cut), because one wins exactly the amount one’s opponents lose. Other zero-sum games include matching pennies and most classical board games include Go and chess (Table 2).Many games studied by game theorists (including the famed prisoner’s dilemma) are non-zero-sum games, because the outcome has net results greater or less than zero. Informally, in non-zero-sum games, a gain by one player does not necessarily correspond with a loss by another. Constant-sum games correspond to activities like theft and gambling, but not to the fundamental economic situation in which there are potential gains from trade. It is possible to transform any constant-sum game into a (possibly asymmetric) zero-sum game by adding a dummy player (often called “the board”) whose losses compensate the players’ net winnings.

Simultaneous / Sequential

Simultaneous games are games where both players move simultaneously, or instead the later players are unaware of the earlier players’ actions (making them effectively simultaneous). Sequential games (or dynamic games) are games where players do not make decisions simultaneously, and the player’s earlier actions affect the outcome and decisions of other players. [18] This need not be perfect information about every action of earlier players; it might be very little knowledge. For instance, a player may know that an earlier player did not perform one particular action, while they do not know which of the other available actions the first player actually performed. The difference between simultaneous and sequential games is captured in the different representations discussed above. Often, normal form is used to represent simultaneous games, while extensive form is used to represent sequential ones. The transformation of extensive to normal form is one way, meaning that multiple extensive form games correspond to the same normal form. Consequently, notions of equilibrium for simultaneous games are insufficient for reasoning about sequential games.

Perfect Information and Imperfect Information

A game of imperfect information. The dotted line represents ignorance on the part of player 2, formally called an information set. An important subset of sequential games consists of games of perfect information. A game with perfect information means that all players, at every move in the game, know the previous history of the game and the moves previously made by all other players. In reality, this can be applied to firms and consumers having information about the price and quality of all the available goods in a market. [19] An imperfect information game is played when the players do not know all moves already made by the opponent such as a simultaneous move game.[20] Most games studied in game theory are imperfect-information games.[citation needed] Examples of perfect-information games include tic-tactoe, checkers, chess, and go [21-23]. Many card games are games of imperfect information, such as poker and bridge.[24] Perfect information is often confused with complete information, which is a similar concept pertaining to the common knowledge of each player’s sequence, strategies, and payoffs throughout gameplay. [25] Complete information requires that every player know the strategies and payoffs available to the other players but not necessarily the actions taken, whereas perfect information is knowledge of all aspects of the game and players.[26] Games of incomplete information can be reduced, however, to games of imperfect information by introducing “moves by nature”.[27].

Bayesian Game

One of the assumptions of the Nash equilibrium is that every player has correct beliefs about the actions of the other players. However, there are many situations in game theory where participants do not fully understand the characteristics of their opponents. Negotiators may be unaware of their opponent’s valuation of the object of negotiation, companies may be unaware of their opponent’s cost functions, combatants may be unaware of their opponent’s strengths, and jurors may be unaware of their colleague’s interpretation of the evidence at trial. In some cases, participants may know the character of their opponent well, but may not know how well their opponent knows his or her own character. Bayesian game means a strategic game with incomplete information. For a strategic game, decision makers are players, and every player has a group of actions. A core part of the imperfect information specification is the set of states. Every state completely describes a collection of characteristics relevant to the player such as their preferences and details about them. There must be a state for every set of features that some players believe may exist.

Example of a Bayesian game

For example, where Player 1 is unsure whether Player 2 would rather date her or get away from her, while Player 2 understands Player 1’s preferences as before. To be specific, supposing that Player 1 believes that Player 2 wants to date her under a probability of 1/2 and get away from her under a probability of 1/2 (this evaluation comes from Player 1’s experience probably: she faces players who want to date her half of the time in such a case and players who want to avoid her half of the time). Due to the probability involved, the analysis of this situation requires understanding the player’s preference for the draw, even though people are only interested in pure strategic equilibrium.

Combinatorial Games

Games in which the difficulty of finding an optimal strategy stems from the multiplicity of possible moves are called combinatorial games. Examples include chess and go. Games that involve imperfect information may also have a strong combinatorial character, for instance backgammon. There is no unified theory addressing combinatorial elements in games. There are, however, mathematical tools that can solve some particular problems and answer some general questions. Games of perfect information have been studied in combinatorial game theory, which has developed novel representations, e.g., surreal numbers, as well as combinatorial and algebraic (and sometimes non-constructive) proof methods to solve games of certain types, including “loopy” games that may result in infinitely long sequences of moves. These methods address games with higher combinatorial complexity than those usually considered in traditional (or “economic”) game theory.[31,32] A typical game that has been solved this way is Hex. A related field of study, drawing from computational complexity theory, is game complexity, which is concerned with estimating the computational difficulty of finding optimal strategies. Research in artificial intelligence has addressed both perfect and imperfect information games that have very complex combinatorial structures (like chess, go, or backgammon) for which no provable optimal strategies have been found. The practical solutions involve computational heuristics, like alpha-beta pruning or use of artificial neural networks trained by reinforcement learning, which make games more tractable in computing practice.

Infinitely Long Games

Games, as studied by economists and real-world game players, are generally finished in finitely many moves. Pure mathematicians are not so constrained and set theorists in particular study games that last for infinitely many moves, with the winner (or other payoff) not known until after all those moves are completed. The focus of attention is usually not so much on the best way to play such a game, but whether one player has a winning strategy. (It can be proven, using the axiom of choice, that there are games - even with perfect information and where the only outcomes are “win” or “lose” - for which neither player has a winning strategy.) The existence of such strategies, for cleverly designed games, has important consequences in descriptive set theory.

Discrete and Continuous Games

Much of game theory is concerned with finite, discrete games that have a finite number of players, moves, events, outcomes, etc. Many concepts can be extended, however. Continuous games allow players to choose a strategy from a continuous strategy set. For instance, Cournot competition is typically modeled with players’ strategies being any non-negative quantities, including fractional quantities. Continuous games allow the possibility for players to communicate with each other under certain rules, primarily the enforcement of a communication protocol between the players. By communicating, players have been noted to be willing to provide a larger amount of goods in a public good game than they ordinarily would in a discrete game, and as a result, the players are able to manage resources more efficiently than they would in discrete games, as they share resources, ideas and strategies with one another. This incentivizes, and causes, continuous games to have a higher median cooperation rate. [35].

Differential Games

Differential games such as the continuous pursuit and evasion game are continuous games where the evolution of the players’ state variables is governed by differential equations. The problem of finding an optimal strategy in a differential game is closely related to the optimal control theory. In particular, there are two types of strategies: the open-loop strategies are found using the Pontryagin maximum principle while the closed-loop strategies are found using Bellman’s Dynamic Programming method. A particular case of differential games are the games with a random time horizon.[36] In such games, the terminal time is a random variable with a given probability distribution function. Therefore, the players maximize the mathematical expectation of the cost function. It was shown that the modified optimization problem can be reformulated as a discounted differential game over an infinite time interval.

Evolutionary Game Theory

Evolutionary game theory studies players who adjust their strategies over time according to rules that are not necessarily rational or farsighted.[37] In general, the evolution of strategies over time according to such rules is modeled as a Markov chain with a state variable such as the current strategy profile or how the game has been played in the recent past. Such rules may feature imitation, optimization, or survival of the fittest. In biology, such models can represent evolution, in which offspring adopt their parents’ strategies and parents who play more successful strategies (i.e., corresponding to higher payoffs) have a greater number of offspring. In the social sciences, such models typically represent strategic adjustment by players who play a game many times within their lifetime and, consciously or unconsciously, occasionally adjust their strategies. [38].

Stochastic Outcomes (And Relation to other Fields)

Individual decision problems with stochastic outcomes are sometimes considered “one-player games”. They may be modeled using similar tools within the related disciplines of decision theory, operations research, and areas of artificial intelligence, particularly AI planning (with uncertainty) and multi-agent system. Although these fields may have different motivators, the mathematics involved are substantially the same, e.g., using Markov decision processes (MDP).[39] Stochastic outcomes can also be modeled in terms of game theory by adding a randomly acting player who makes “chance moves” (“moves by nature”). [40] This player is not typically considered a third player in what is otherwise a two-player game, but merely serves to provide a roll of the dice where required by the game.

For some problems, different approaches to modeling stochastic outcomes may lead to different solutions. For example, the difference in approach between MDPs and the minimax solution is that the latter considers the worst-case over a set of adversarial moves, rather than reasoning in expectation about these moves given a fixed probability distribution. The minimax approach may be advantageous where stochastic models of uncertainty are not available but may also be overestimating extremely unlikely (but costly) events, dramatically swaying the strategy in such scenarios if it is assumed that an adversary can force such an event to happen. General models that include all elements of stochastic outcomes, adversaries, and partial or noisy observability (of moves by other players) have also been studied. The “gold standard” is considered to be partially observable in stochastic game (POSG), but few realistic problems are computationally feasible in POSG representation.

Metagames

These are games the play of which is the development of the rules for another game, the target or subject game. Metagames seek to maximize the utility value of the rule set developed. The theory of metagames is related to mechanism design theory. The term metagame analysis is also used to refer to a practical approach developed by Nigel Howard, whereby a situation is framed as a strategic game in which stakeholders try to realize their objectives by means of the options available to them. Subsequent developments have led to the formulation of confrontation analysis.

Pooling Games

These are games prevailing over all forms of society. Pooling games are repeated plays with changing payoff table in general over an experienced path, and their equilibrium strategies usually take a form of evolutionary social convention and economic convention. Pooling game theory emerges to formally recognize the interaction between optimal choice in one play and the emergence of forthcoming payoff table update path, identify the invariance existence and robustness, and predict variance over time. The theory is based upon topological transformation classification of payoff table update over time to predict variance and invariance and is also within the jurisdiction of the computational law of reachable optimality for ordered system.

Mean Field Game Theory

Mean field game theory is the study of strategic decision making in very large populations of small interacting agents. This class of problems was considered in the economics literature by Boyan Jovanovic and Robert W. Rosenthal, in the engineering literature by Peter E. Caines, and by mathematicians Pierre-Louis Lions and Jean-Michel Lasry.

Representation of Games

The games studied in game theory are well-defined mathematical objects. To be fully defined, a game must specify the following elements: the players of the game, the information and actions available to each player at each decision point, and the payoffs for each outcome. (Eric Rasmusen refers to these four “essential elements” by the acronym “PAPI”.) A game theorist typically uses these elements, along with a solution concept of their choosing, to deduce a set of equilibrium strategies for each player such that, when these strategies are employed, no player can profit by unilaterally deviating from their strategy. These equilibrium strategies determine an equilibrium to the game-a stable state in which either one outcome occurs or a set of outcomes occur with known probability.

In games, players typically have a ‘Dominant Strategy’, where they are incentivised to choose the best possible strategy that gives them the maximum payoff and stick to it even when the other player/s change their strategies or choose a different option. However, depending on the possible payoffs, one of the players may not possess a ‘Dominant Strategy, while the other player might. A player not having a dominant strategy is not a confirmation that another player won’t have a dominant strategy of their own, which puts the first player at an immediate disadvantage. However, there is the chance of both player’s possessing Dominant Strategies, when their chosen strategies and their payoffs are dominant, and the combined payoffs form an equilibrium. When this occurs, it creates a Dominant Strategy Equilibrium. This can be because of a Social Dilemma, where a game possesses an equilibrium created by two or multiple players who all have dominant strategies, and the game’s solution is different to what the cooperative solution to the game would have been.

There is also the chance of a player having more than one dominant strategy. This occurs when reacting to multiple strategies from a second player, and the first player’s separate responses having different strategies to each other. This means that there is no chance of a Nash Equilibrium occurring within the game. Most cooperative games are presented in the characteristic function form, while the extensive and the normal forms are used to define noncooperative games.

Extensive Form

The extensive form can be used to formalize games with a time sequencing of moves. Extensive form games can be visualized using game trees (as pictured here). Here each vertex (or node) represents a point of choice for a player. The player is specified by a number listed by the vertex. The lines out of the vertex represent a possible action for that player. The payoffs are specified at the bottom of the tree. The extensive form can be viewed as a multi-player generalization of a decision tree.[50-60] To solve any extensive form game, backward induction must be used. It involves working backward up the game tree to determine what a rational player would do at the last vertex of the tree, what the player with the previous move would do given that the player with the last move is rational, and so on until the first vertex of the tree is reached. The game pictured consists of two players.

The way this particular game is structured (i.e., with sequential decision making and perfect information), Player 1 “moves” first by choosing either F or U (fair or unfair). Next in the sequence, Player 2, who has now observed Player 1’s move, can choose to play either A or R. Once Player 2 has made their choice, the game is considered finished and each player gets their respective payoff, represented in the image as two numbers, where the first number represents Player 1’s payoff, and the second number represents Player 2’s payoff. Suppose that Player 1 chooses U and then Player 2 chooses A: Player 1 then gets a payoff of “eight” (which in realworld terms can be interpreted in many ways, the simplest of which is in terms of money but could mean things such as eight days of vacation or eight countries conquered or even eight more opportunities to play the same game against other players) and Player 2 gets a payoff of “two”. The extensive form can also capture simultaneous-move games and games with imperfect information. To represent it, either a dotted line connects different vertices to represent them as being part of the same information set (i.e., the players do not know at which point they are), or a closed line is drawn around them [60-70].

Normal Form

The normal (or strategic form) game is usually represented by a matrix which shows the players, strategies, and payoffs (see the example to the right). More generally it can be represented by any function that associates a payoff for each player with every possible combination of actions. In the accompanying example there are two players; one chooses the row and the other chooses the column. Each player has two strategies, which are specified by the number of rows and the number of columns. The payoffs are provided in the interior. The first number is the payoff received by the row player (Player 1 in our example); the second is the payoff for the column player (Player 2 in our example). Suppose that Player 1 plays up and that Player 2 plays Left. Then Player 1 gets a payoff of 4, and Player 2 gets 3 [70-90] (Table 3).

When a game is presented in normal form, it is presumed that each player acts simultaneously or, at least, without knowing the actions of the other. If players have some information about the choices of other players, the game is usually presented in extensive form. Every extensive-form game has an equivalent normal-form game, however, the transformation to normal form may result in an exponential blowup in the size of the representation, making it computationally impractical.

Chemical game theory is an alternative model of game theory that represents and solves problems in strategic interactions or contested human decision making. Differences with traditional game theory concepts include the use of metaphorical molecules called “knowlecules”, which represent choices and decisions among players in the game. Using knowlecules, entropic choices and the effects of preexisting biases are taken into consideration.

A game in chemical game theory is then represented in the form of a process flow diagram consisting of unit operations. The unit operations represent the decision-making processes of the players and have similarities to the garbage can model of political science. A game of N players, N being any integer greater than 1, is represented by N reactors in parallel. The concentrations that enter a reactor correspond to the bias that a player enters the game with. The reactions occurring in the reactors are comparable to the decision-making process of each player. The concentrations of the final products represent the likelihood of each outcome given the preexisting biases and pains for the situation [91-100].

Now that finally enough has been explained about the theory of games, I want to state the fact in simple words that it is actually possible to produce chemical compounds using artificial intelligence and good strategies such as game theory and selection theory. Easier and faster. The main thing that should be noted is that with this method, reaching the final answer, especially in the production of pharmaceutical products, is much simpler, more accurate, and faster.


To Know more about Recent Advances in Petrochemical Science
Click here: https://juniperpublishers.com/rapsci/index.php

To Know more about our Juniper Publishers
Click here: https://juniperpublishers.com/index.php

Artificial Intelligence System for Value Added Tax Collection via Self Organizing Map (SOM)- Juniper Publishers

  Forensic Sciences & Criminal Investigation - Juniper Publishers Abstract Findings:  Based on our experiments, our approach is an effec...