Abstract
Objective: Surveys are often conducted but rare collecting data against cheating behaviors by detecting abnormality responding to items. The aim of this study is to design indices for screening out suspiciously careless cases for improving survey quality and effectiveness.
Methods: We interpreted a result of bully survey on prevalent rates of workplace bullying resulting from respondent’s subjectivity bias in part, simulated data using four indices (i.e., Chi-square test, Z-score, Gini coefficient, and Delta coefficient) for detecting cheating respondents, and finally demonstrating an online computer module that combines model person fit with the study equality indices of personal responding time consumed to items to monitor the behavior abnormality.
Results: We found that prevalent rates of workplace bullying might be overestimated at 7.5% due to cheating behaviors and the inflated self-labeling endorsement on their responses, two equality indices of 1-Gini coefficient (>0.70) and Chi-square (<2.0) are recommended for use in computer online module, and (3)an online computer adaptive testing was designed to join with the suggested indices for detecting abnormality in a survey.
Conclusion: Prevalent rates of workplace bullying should be guaranteed against those suspicious respondents’ cheating behaviors. We recommend using two equality indices in a computer online module to ensure and secure the survey quality in future.
Keywords: Equality index; Computer adaptive testing; Workplace bullying; Gini coefficient; Chi-square deviation indicator
Abbrevations: APP: Application; CAT: Computerized Adaptive Testing; CTT: Classic Test Theory; IRT: Item Response Theory; MNSQ: Mean-Square; MSE: Mean-Squared Error; SD: Standard Deviation; SE: Standard Error
Introduction
During the last 20 years, workplace bullying has been measured and assessed in a range of different studies to investigate mental health issues [1]. Despite all this attention on the bully phenomenon, little is known about how the use of different measurement and estimation methods influences the findings on workplace bullying. The prevalence of bullying was reported at 24% for hospital nurses [2], higher than seen in studies of Japanese nurses (19%) [3], Korean intensive care unit (ICU) nurses (15.2%) [4], and workers in general services (2%-17%) [1].
We have not seen any study checking data in correction (or called purification) to respondents before conducting statistically analyses. That is to remove those suspiciously possible cheating respondents answering questions in a survey. Otherwise, the findings on workplace bullying would be biased and overestimated. Nielsen et al. [5] addressed that self-labelling (i.e., with a single quest to answer whether she/he is a bullied victim [6,7] with definition studies yielded far lower estimates of bullying than self-labelling studies without definitions. For studies using the behavioral method (i.e., with several items to respond with regards to encountered negative acts or behaviors in a workplace [1,8] with an operational criterion, prevalence rates seem to vary between 3% and 17%, depending on the cut-off criterion utilized [9].
Cheating behaviors and cutting points
If the vital few (e.g., victims of bullying as in nominator) was over-counted (e.g. using self-labelling method or a lenient cut-off criterion) or the trivial many (e.g. not bullied and limited work criticism as in denominator) was under-counted, the prevalent rate will be beyond the expectation. A specific definition is thus needed in the self-labelling method, and a statistically scientific detection is required to decrease the over count and the under count phenomenon in a survey. We name it detecting cheating behavior in this study. Some researchers [10-12] proposed person fit statistics to detect non-fitting examinees in a test. But none were seen in exploring an online detection to screen out suspiciously careless cases before conducting analyses for improving study quality and effectiveness. Especially, we are in the age with all forms of web-based technology, advances in mobile health (mHealth) and health communication technology, which are rapid and ubiquitous around the world [13].
The NAQ-R inventory and the computer instrument
A notable behavioral experience inventory used in research on workplace bullying is the version of the Negative Acts Questionnaire-Revised (NAQ-R) [14], which has been validated in several studies and countries [2,8,15,16]. The NAQ-R investigates the frequency and persistency of the respondent’s exposure to 22 different types of unwanted and negative behaviors. The range of negative perceptions is widely included from such subtle and indirect acts as gossiping to such more direct behaviors as threats of physical abuse. All items are described with behavioral terms without the word bullying. Respondents are asked to indicate how often they have been exposed to the 22 negative acts using a response scale ranging from «Never» to «Daily». Hence, the NAQ-R is a behavioral experience tool used for examining the extent to which the psychological aggression and harassment is perceived by the test-taker.
The NAQ-R is evident of a unidimensional construct and can be applied to measure exposure to workplace bullying through the computerized adaptive testing (CAT) administration [2]. The CAT requires fewer items to answer than the traditional pen-andpaper approach (an efficiency gain of 32%), suggesting a reduced burden for respondents [2]. However, the CAT-based NAQ-R is just administered on a computerized nursing cart (i.e., not an online CAT version) and is not equipped with any functionality of detection in monitoring respondents with cheating behaviors in a survey to improve the quality of data collection.
Objectives
First, we interpreted a result of bully survey on prevalent rates of workplace bullying that show the over-count in response to the subjectivity bias in part. Second, a simulation study was conducted to explore possible and feasible indices that can help us detect cheating respondents on a CAT-based NAQ-R. Third, an online CAT NAQ-R was developed by combining model person fit with the study equality indices together to ensure data purification and survey quality.
Methods
Study participants
The study sample was recruited from three hospitals (Hospital A: 1236-bed medical center; B: 265-bed local hospital; C: 877-bed region hospital) in southern Taiwan in the summer of 2012. No incentive for participation was offered. A total of 963 nurses completed a pen-and-paper format of NAQ-R questionnaire. This study was approved and monitored by the Research Ethics Review Board of the Chi-Mei Medical Center. Demographic data were anonymously collected including gender, work tenure in hospitals of all types, age, marital status, and education level.
Scales used for reporting exposure to bullying
The 22-item NAQ-R with 5 response alternatives (1=never, 2=occasionally, 3=monthly, 4=weekly, 5=daily) was used to measure exposure to workplace bullying within the past 6 months. A single self-labeling victimization question was additionally provided to respondents for answering their experience being bullied (without a specific definition of workplace bullying) during the last 6 months in order to calculate the prevalent rate of workplace bullying for each study hospital. With permission from the author [17], the NAQ-R was professionally translated into Chinese by authors in Taiwan using a back-translation technique (English-Chinese-English).
According a study in Belgian employees[18], six different groups of respondents were identified based on their exposure to negative behaviors: Not bullied (35% ), Limited work criticism (28% ), Limited negative encounter (17% ), Sometimes bullied (9% ), Work related bullying (8% ) and Victims of bullying (3% ). Using the study sample, we combined the aforementioned six categories as three ones and calculated prevalent rates for each hospital in following four formats:
a) Using cutting points at > -2 logits according to the threshold step difficulties for the NAQ-R assessment of the previous paper [2].
b) Using cutting points of raw summation scores at >33 according to previous study [18].
c) Dividing study sample into two clusters (bullied and not bullied) using self-labelling method.
d) Separating the bullied in (iii) into two parts at a cutting point of summation score >30, defined in the previous paper [2], to know how many percentages are classified as bullied, but with low scores (i.e., with possible cheating behaviors in response).
Simulation to select viable indices for detecting cheating respondents
We simulated data for analyzing thresholds of the study four indices (i.e., Chi-square test, Z-score, Gini coefficient [19], and Delta coefficient [20] as described in Equations below) used for detecting abnormality of responding time consumed to items.

Where Oi is observed time spent on each item, E is the mean of all time spent averaged on an item, I is the item length a respondent answers, Xi is the observed time spent in second on items, X-bar is the mean of observed time spent on items, and k is the number of item length. For detail information of calculations on Delta and Gini, interested readers are recommended referring to see Multimedia Appendix 1. A simulation study was performed onto 28 scenarios (i.e., four kinds of item length across 5, 10, 20, and 30 quests and data following six uniform distributions with a range of standard deviation from 0.5 to 3.0 for widely dispersing item difficulties, and one normal distribution, (Table 1A & 1B) with a 10-category scale (i.e., seconds spent on items ranging from 1 to 10). Three hundred persons were first extracted from a normal distribution representing their true scores in speed answering items. Accordingly, we could simulate four indices on 28 scenarios to generate Rasch [21,22] simulation responding data [23], and then record their medians and 95% confidence intervals under conditions on different scenarios of item difficulties and item length.
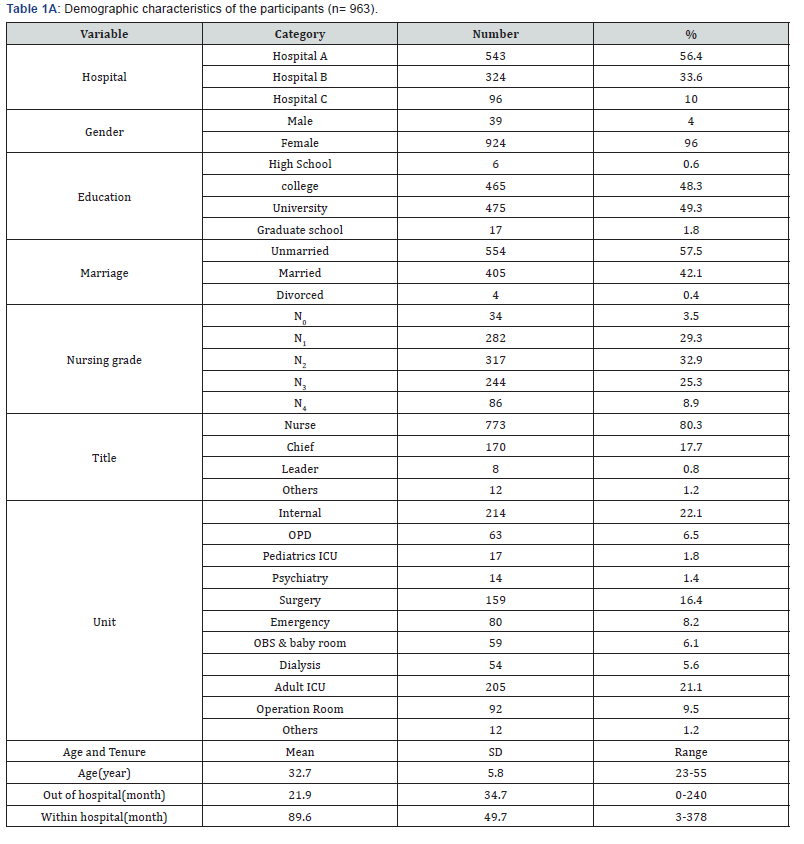

Note: Random seconds were generated by the simulation of Rasch model when samples follow normal distribution and item difficulties are dependent of the study scenarios.
An online NAQ-R assessment APP was designed for use on smart phones
An online routine was designed for participants to report their estimated measures (i.e., in a unit of logit, log odds), the more measure, the higher probability to group into a bullied victim. The item parameters (i.e., overall item difficulties and threshold difficulties) use for constructing an online CAT were extracted from the previous paper [2] and then uploaded to the website. The first CAT item will be randomly selected from the item pool. The next item to be answered is the item with the maximal variance among the remaining items according to the provisional person ability [24,25]. All the responses will be automatically saved in the study website database.
Statistical tools and data analyses
MedCalc 9.5.0.0 for Windows (MedCalc Software, Mariakerke, Belgium) were used to calculate prevalent rates of workplace bullying for each hospital.
Results
Prevalent rates for hospitals
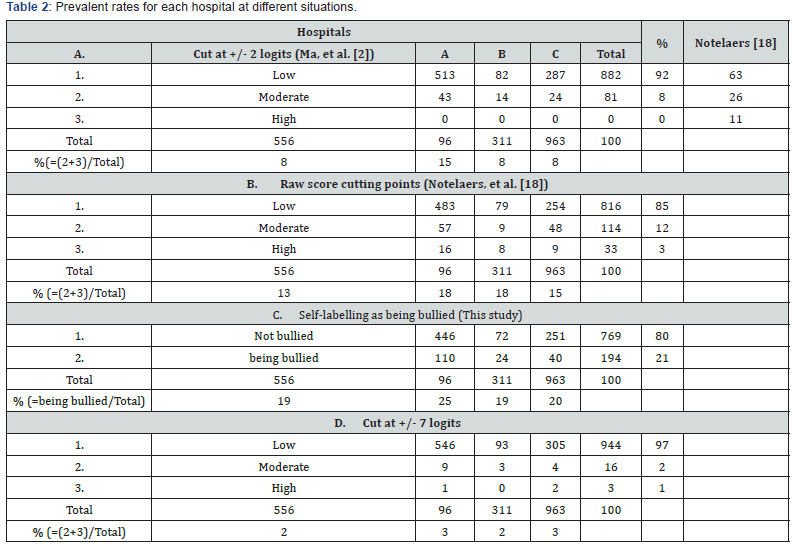
Low prevalent rate in panel A: It can be seen in Table 2 (panel A) that Hospital B has a highest prevalent rate (=15%) of workplace bullying higher than those two counterparts (8%, respectively). Prevalent rates in panel A are apparently far lower than those in panel B and panel C, indicating some possible cheating behaviors in response might be in existence in in this study. That is over-count in the denominator (i.e., eligible sample size).
High prevalent rate in panel C compared to panel B: An incremental quantity of 6% in panel D in comparison to panel C is found. We ascribed the high prevalent rates to the reason of up-self-labelling without a definition of bully before when answering the single question. After removing these 6% from panel C, the prevalent rates are equivalent to those in panel B.
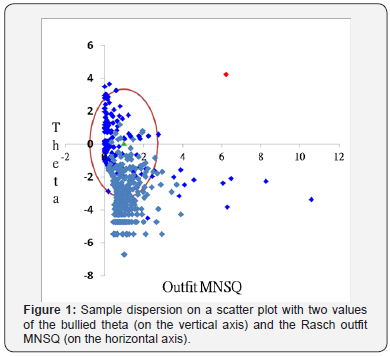
A positively skewed sample: We drew a scatter plot in Figure 1. The study sample is dispersed on two axes (bullied theta on the vertical axis and the Rasch outfit mean square errors of person fit statistics [10] on the horizontal axis). Apparently, person estimates are not following a normal distribution (i.e., a positively skewed one), vital few (e.g., victims of bullying as in nominator) at the top and trivial many (e.g., not bullied and limited work criticism as in denominator) at the bottom. We are convinced to have some cheating respondents (7.5% with outfit MNSQ greater than 2.0) at low scores resulting in low prevalent rates in panel A.
Phenomenon of up-self-labelling as bullied: Fifty-three nurses were self-evaluated as being bullied with low scores below a cutting point at 30 [2], indicating a phenomenon of upself- labelling as bullied inflating the prevalent rates in panel C. The issue is whether we have additional indices to detect those cheating respondents in a survey besides the model’s person fit statistics [10,26] are used in (Figure 1).
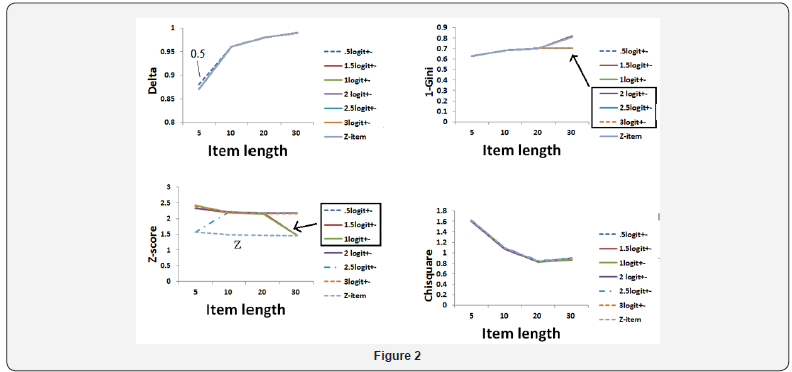
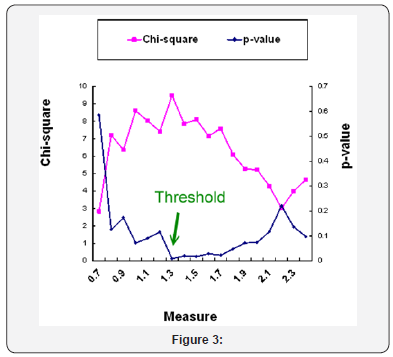
The simulation to select viable indices for detecting abnormality: The simulation results in Figure 2 show that (1) Delta coefficient is dependent of item length, the more number of items and the higher Delta value. (2) The index of Z-score is also dependent on the dispersion of item difficulties and the item length. (3) The (1-Gini) coefficient is ideal and acceptable as an index for detecting abnormality when setting criterion at lower than 0.60. (4) The Chi-square can be set at the value greater than 2.0, also some arguments are raised in dependence of item length. In all, we recommend using these two equality indices of (1-Gini) and the Chi-square to detect cheating respondents.
Online CAT assessment
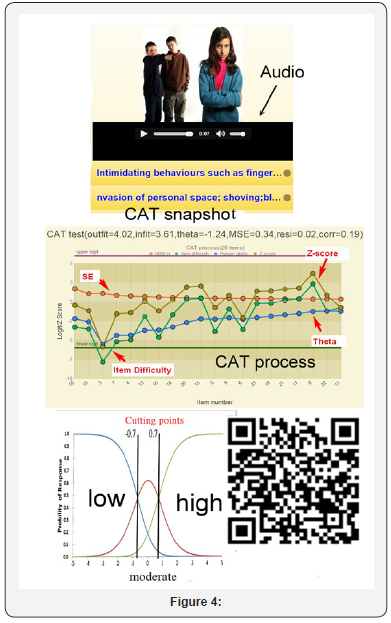
By scanning the QR code (Figure 3, bottom right), the CAT icon appears on the smart phone. The mobile CAT survey procedure was demonstrated item-by-item in action Figure 3. Person fit (i.e., infit and outfit mean square [MNSQ]) statistics showed the respondent behaviors. Person theta is the provisional ability estimated by the CAT module. The MSE in Figure 3 was generated by this formula as below: 1/√ (Σ variance (i)), where i refer to the CAT finished items responded to by a person [27]. In addition, the residual (resi) in Figure 3 was the average of the last 5 change differences between the pre-and-post estimated abilities on each CAT step. CAT will stop if the resi value is less than 0.05. The corr refers to the correlation coefficient between the CAT estimated measures and its step series numbers using the last 5 estimated theta (= person measure) values. The flatter the theta trend, the higher the probability that the person measure is convergent with a final estimation.
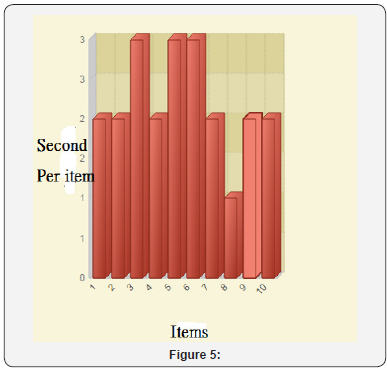
After finishing the online CAT NAQ-R assessment, a repot of time spent on each item is shown on the mobile screen Figure 4 along with both suggested equality indices (i.e., 1-Gini <0.60 and Chi-square>2.0), which can be another form of detection utility saved in the website server as an indicator we examine whether the respondent had a cheating behavior in the NAQ-R assessment. Interested readers are recommended to see the multimedia at reference [27].
Discussion
Key findings
The results from this study indicate that some cheating or up-self-labelling behaviors might be in existence in a survey, two equality indices of (1-Gini) and the Chi-square are recommended to users for detecting cheating respondents in practice, and an online CAT NAQ-R is required to combine model person fit with the equality indices jointly together to ensure data purification and survey quality.
What this adds to what was known
The prevalence of bullying was reported at nearly 20% panel in Table 2, similar to the previous published paper at 24% for hospital nurses [2], higher than seen in studies of Japanese nurses (19%) [3]; and ICU nurses in Korea (15.2%) [4], and workers in general services (2%-17%) [1]. The reason for higher prevalent rates of workplace bullying might be attributed to those who self-labelling as being bullied without a definition of the concept beforehand to over-count the perception of a victim bullying [5,9]. If we remove those possible up-self-labelling cases, the prevalent rates will be decreased from panel C to panel B.
On the other hand, if we conduct the data purification process (i.e. discarding those sample with cheating behaviors) before conducting statistical analyses, our findings for prevalent rates can be increased to a higher level (i.e., from panel A to panel B) and consistent with the level in literature: in Japan at 19% [3], ICU nurses in Korea (15.2%) [4], and workers in general services (17%) [1]. Rasch-based CAT is generally different from the traditional pen-and-paper test for which all items are answered while providing little information to use for analyzing the CAT users’ responses. For instance, outfit MNSQ values of 2.0 [26] in Figure 1 can be a threshold when examining whether patient responses are distorted or abnormal, i.e., whether respondents unexpectedly do not fit the model’s requirements and are deemed highly possibly careless, mistaken, cheating, or awkward [28-30] (e.g., the outfit MNSQ of 4.02 is shown in Figure 3 as cheating or awkward behaviors). This is another advantage of IRT over the traditional classic test theory (CTT): it gives more useful information to readers. That is, any significantly aberrant or cheating behavior on CAT will be detected and found by the CAT module algorithm [2,11,31].
What it implies and what should be changed
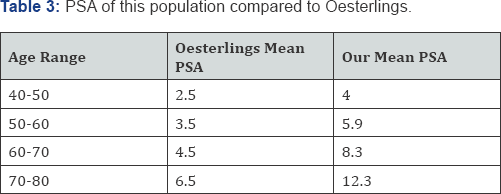
It can be seen in Figure 1 that many respondents with low bully scores suffer a high outfit MNSQ, indicating a possible cheating behavior might be in existence. Additional other indices, such as (1-Gini) and Chi-square algorisms in line with time spent on items, are required in use for detecting cheating respondents to gain an accurate prevalent rate of workplace bullying. An online CAT based NAQ-R routine can be equipped with Rasch outfit MNSQ, (1-Gini) and Chi-square equality indices in a survey Figure 3. Cut points can be used for respondents to identify the degree of workplace bullying. We provided a way to determine the cut points of person strata for CAT-based NAQ-R assessment using the Rasch threshold step difficulties [2]; Figure 3-5 which is theoretically based on the expected response counts that are different from the traditional CTT using the summation counts to calculate the cutting points. Furthermore, the most straightforward approach in tradition is to compute an overall sum score on the base of the individual items. This sum score may then be applied as a measure of the level of exposure to bullying, which can be further included in correlation analysis, regression analysis, and so on. It is problematical to use the raw score for further statistical analysis instead of using the Rasch interval estimated measures [22].
Strengths of this study
Many studies have reported the advantage of CAT over the traditional pen-and-paper one. That is, traditional questionnaires have a large respondent burden because they require patients to answer questions that do not provide any information for the patient estimation [32]. However, we have not seen any online CAT that can be used for smartphones with audio and multimedia as well as incorporated with a detection functionality using respondent’s consumption time across all items on internet. It is very easy to apply the online CAT to other kinds of health-related assessment if the designer uploads relevant parameters into the database (e.g., definitions about threshold difficulties; the number of questions in the item bank). It is worth noting that item overall (i.e., on average) and step (threshold) difficulties of the questionnaire must be calibrated in advance using Rasch or other item response theory models, and pictures and the corresponding audio files used for the subject or response categories for each question should be wellprepared with a web link that can be shown simultaneously with the item appearing in the animation module of CAT. Further, the parameters corresponding to the exact fields of the database need to be correctly uploaded. As with all forms of web-based technology, advances in mobile health (mHealth) and health communication technology are rapid. Mobile online CAT is promising and worth promoting the patients’ health literacy in future. Interested readers are recommended to see multimedia appendix for the calculation of Delta and Gini coefficients [33].
Limitations and future studies
Our study has some limitations. First, although we believe that all respondents’ bully perception scores do not follow a normal distribution, there is no evidence to support our assumption of cutting points suitable to other different workplaces, which might influence the classification of workplace bullying for the NAQ-R scale. We recommend additional studies to compare and explore the cut point determination using Rasch analysis in future. Second, equality indices are recommended in this study, but not necessary in these two, because there may be other more evidence based indices that can be efficient and effective to detect abnormal pattern of those cheating respondents in a survey. Third, the CAT parameters were based on a previously published paper [2]. All of the person measures were estimated from those released parameters. If any one set (either item or threshold parameters) were different from the real world for nurses in Taiwan, the classification will be problematic in analysis in Table 2. That is, parameters from one hospital will be different from those in other hospitals, and those from other cultures will be different from those with other nations. Additional studies are needed to reexamine whether the psychometric properties of the NAQ-R suitable for other types of workplaces.
Conclusion
Prevalent rates of workplace bullying should be guaranteed against those suspicious respondents’ cheating behaviors. We recommend using two equality indices in a computer online module to ensure and secure the survey quality in future.
Additional Files
Multimedia 1
Online NAQ-R assessment using Rasch computerized adaptive testing.
To
Know More About Psychology
and Behavioral Science International Journal Please Click on:
https://juniperpublishers.com/pbsij/index.php
To Know More About Open
Access Journals Publishers Please Click on: Juniper
Publishers

