Oceanography & Fisheries - Juniper Publishers

Abstract
In 2015, the Earth Observation Group (EOG) created the VIIRS Boat Detection (VBD) product, which is now employed by various fishery agencies to oversee fishing activities and ensure compliance with closures. VBD data offer real-time insights into the movements of fishing vessels, aiding in the detection of illegal fishing practices within restricted areas and intrusions into exclusive economic zones (EEZs). The Indian Ocean, a critical hub for global fisheries contributes over 14% of the world’s wild-caught fish production. The fishing grounds in the Indian Ocean region are amorphous clusters, which depict cyclical patterns in the number of boat detections, corresponding to the monsoon season from June to September, and fishing restrictions imposed by the government. An exponential increase in boat detections was also observed since October 2016. Contrarily, the vessels detected at the anchorage are predominantly shipping vessels, and their temporal pattern shows less pronounced cyclical variation compared to fishing grounds. Employing the ‘Pelt’ algorithm to detect change points in monthly boat counts for the anchorage from 2012 to 2022 revealed a significant change in the average number of boat detections per month in October 2018. This study highlights the utility of VIIRS boat detection data in monitoring fishing activity and its response to seasonal and regulatory influences in the Indian Ocean, ultimately contributing to more effective fisheries management and conservation efforts.
Keywords: VBD; Fishing grounds; Anchorages; Monsoon; Indian Ocean
Abbreviations: EOG: Earth Observation Group; VBD: VIIRS Boat Detection; EEZs: Exclusive Economic Zones; DMSP: Defense Meteorological Satellite Program; OLS: Operational Linescan System; VIIRS: Visible Infrared Imaging Radiometer Suite; JPSS: Joint Polar Satellite System; USAID: United States Agency for International Development; VMS: Vessel Monitoring System; AIS: Automatic Identification System; VNF: VIIRS Night fire
Introduction
Since the 1970s, it has been established that fishing boats emitting strong light can be identified using nighttime visible low-light imaging data obtained by polar-orbiting meteorological sensors [1]. Among the sensors capable of low-light imaging, two notable ones are the U.S. Air Force Defense Meteorological Satellite Program (DMSP) Operational Linescan System (OLS) and the NASA/NOAA Visible Infrared Imaging Radiometer Suite (VIIRS). These sensors employ light enhancement techniques to enable the detection of moonlit clouds during the night, meeting the requirements of meteorologists for both daytime and nighttime visible and thermal cloud imagery.
The OLS digital archive spans from 1992 to the present, offering relatively coarse resolution (2.7km ground sample distance) global data. On the other hand, the VIIRS sensor, in operation since 2012, provides significant advancements in low-light imaging. It boasts finer pixel resolution (742m × 742m) and in-flight calibration to radiance units [2]. In 2015, the Earth Observation Group (EOG) developed the VIIRS boat detection (VBD) algorithm with support from NOAA’s Joint Polar Satellite System (JPSS) with aid from the United States Agency for International Development (USAID) [3]. VBD data are generated in near real-time, with nightly records available for Southeast Asia since April 2012, and globally from 2017 onwards. In addition to the nightly data, EOG also produces monthly and annual summary grids.
Numerous fishery agencies, including those in the Philippines, Indonesia, Thailand, Japan, and South Korea, rely on VIIRS boat detection (VBD) data for monitoring fishing activities and identifying vessels operating in restricted areas [4]. VBD provides valuable maritime domain awareness, especially when it comes to identifying locations of “dark” vessels which lack Vessel Monitoring System (VMS) or the Automatic Identification System (AIS) [5]. To delineate fishing grounds and assess usage patterns over time, the monthly and annual summary grids are very useful. Recently, a global long-term VBD cumulative detection grid, spanning 2012-2021 has been developed and the findings will be shared in this report.
Methods
Besides, the monthly and annual summary grids, all the nightly VBD data have been stored in a database designed for easy retrieval based on criteria specified by users. Each pixel in the VBD data is assigned a label based on its clarity and location, often referred to as quality flags or QF. To construct a multiyear cumulative detection grid, pixels labeled QF 1, 2, 3, 8, and 10, corresponding to strong boat detection, weak detection, blurry detection, recurring detection, weak and blurry detections have been selected [4,6].
The accumulations of these detections have been aggregated into a global grid with 15 arc-second grid cells, which are approximately half a kilometer on each side at the equator. These grids provide information on the number of detections, the count of valid VIIRS observations, and the average radiance for each grid cell. To account for differences in data availability over various time periods in Southeast Asia and other parts of the world, the percentage frequency of detection is calculated by dividing the number of detections by the count of valid observations. This normalization ensures a fair comparison between these regions.
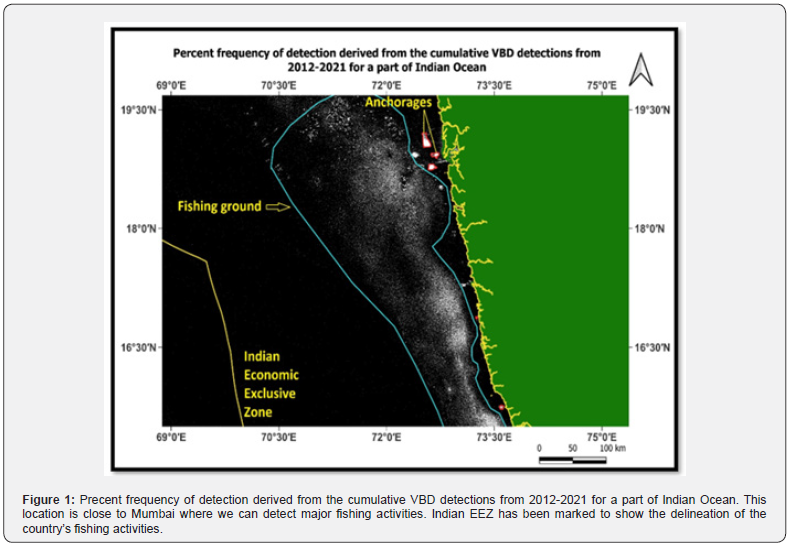
Vector polygons of ‘fishing grounds’ and ‘anchorages’ were drawn on the percentage frequency VBD grid. The anchorages have definite shapes, like a square or rectangle, whereas fishing grounds are closer to those anchorages and structureless. Some of the fishing grounds also coincide with ‘upstream’ gas flare locations detected in the VIIRS Night fire (VNF) dataset which have been eliminated before extracting temporal profiles [6]. EOG has developed methods for extracting temporal profiles from the database for specific spatial features identified in the summary grids.
Results
The Indian Ocean hosts some of the world’s most significant fisheries, contributing to more than 14% of the global catch of wild-caught fish [6]. Fishery agencies have the potential to depend on VIIRS boat detection (VBD) data to enforce regulations and implement management measures effectively. VBD data can offer real-time insights into the actions of fishing vessels, including signs of unlawful fishing practices within restricted zones and intrusions into exclusive economic zones (EEZs) [7]. Figure 1 shows the percent frequency of VBD detection in the northern Indian Ocean. The fishing grounds show up as large light gray features. The fishing grounds in the Indian Ocean seems to be in amorphous clusters [8]. Although fishing grounds encompass the largest expanse with VBD detections, the percentage of detection for an individual half-kilometer grid cell within these fishing grounds is quite low, seldom surpassing 1%. However, there are concentrated groups of non-fishing VBD features, primarily located near the shoreline, which exhibit higher percentage frequencies of detection, typically ranging from 1% to 3%. These non-fishing features comprise anchorages, platforms, and aquaculture sites. Figure 2 shows the temporal profile of fishing ground seen in figure 1.
The equation of the exponential curve shown in Figure 2 is:
y = 4E −15e0.0009x
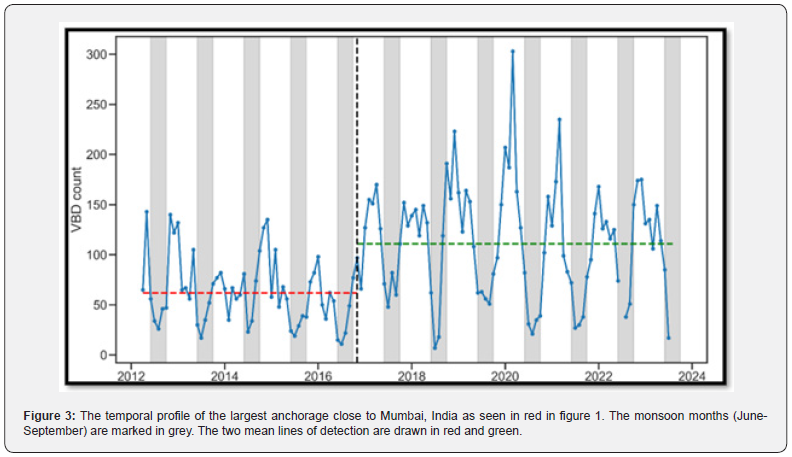
The temporal profile of the fishing ground clearly demonstrates a cyclical seasonal pattern and a steady increase of fishing activity since October 2016. The decline in VBD in the fishing grounds during the monsoons (June -September) is not simply the effects of cloud obscuration but aversion of the fishing boats to the inclement weather and rough seas. Besides, fishing communities cease their fishing operations in concordance with government regulations, which ban commercial fishing during the monsoons to allow breeding and restoration of fishing stock [9-11]. The monsoon is the spawning season for fish and the ban helps in replenishing the fish stock and protect the fishermen from the rough sea. It is interesting to see the differences in the temporal profiles of the fishing ground in Figure 2 and the anchorage in Figure 3. The boats detected from the largest anchorage (Figure 3) are shipping vessels - not fishing boats. The anchorage’s temporal profile indicates that shipping activities are not heavily impacted by the monsoon. The cyclical pattern, although apparent, is not as distinct as it is for the temporal profile of the fishing ground.
To identify potential variations in the average number of anchored boats, a kernel-based offline multiple change point detection algorithm known as ‘Pelt’ was employed, which stands for “Pruned Exact Linear Time” [12]. By applying the ‘Pelt’ algorithm to the time series data of monthly boat counts for the anchorage from 2012 to 2022, only one significant change in the average number of boats was detected. This change occurred in October 2018, where the average number of boats per month shifted from 66 to 111. The average line for 66 is shown in red, and the average line for 111 is shown in green.

Conclusion
At night, the ocean presents itself as an extensive, dark canvas where any form of illumination becomes easily detectable by the VIIRS day/night band. However, the VIIRS boat detection data, despite being generated on a nightly basis, do not provide any indication of these sharply defined structures. The true nature of these structures becomes apparent when we examine them over a longer timeframe, accumulating detections across multiple years. In the Indian Ocean, due to south-west monsoon we see seasonal variations in fishing grounds, but the anchorages do not indicate the same. Moreover, the ban on fishing activity during the monsoons also has a significant effect and thus a distinct cyclical pattern of detections are noticed for the fishing grounds. Also, an exponential growth of fishing activity was noticed since October 2016. As for the profile of the largest anchorage, a rise in the average number of fishing boats was noticed in October 2018. It will be interesting to compare and study fishing grounds around the world which show similar rhythms.
To Know more about Oceanography & Fisheries Open Access Journal
Click here: https://juniperpublishers.com/ofoaj/index.php
To Know more about our Juniper Publishers
Click here: https://juniperpublishers.com/index.php


