Addiction & Rehabilitation Medicine - Juniper Publishers

Abstract
Experimentation plays a significant role in Science and Technology, which is an application of handling experimental units, and then the determination of one or more responses from that. In every experiment, some inputs (x) transform into results that have one or more observable response variables (y). Therefore, from the results, the conclusion can be drawn by experiment. For obtaining an unbiased conclusion a researcher needs to plan & design the experiment and analyze the results obtained. When dealing with a continuous range of values then the true connection between y and x’s might not be known. In such cases, statistical analysis like Response Surface Methodology plays a crucial role, which is a combination of statistical and mathematical techniques useful for designing and analyzing problems where a response of interest is affected by several variables, and the objective is to optimize this response. It generally helps in reviewing the empirical relationship among one or more measured responses and various independent variables in the form of a polynomial equation. Mapping of those responses associated with the experimental domain helps in generating an optimized method.
Introduction
Response Surface Methodology [1-9] (RSM) plays a crucial role, which is a combination of statistical and mathematical techniques useful for designing and analyzing problems where a response of interest is affected by several variables, and the objective is to optimize this response. It generally helps in reviewing the empirical relationship among one or more measured responses and various independent variables in the form of a polynomial equation. Mapping of those responses associated with the experimental domain helps in generating an optimized method.
The wide applications of RSM are in particular situations where numerous input variables strongly impact some performance measures of the method. Thus, the performance measures are called the response. The input variables are termed independent variables, and they are elements of the control of the researcher. The arena of RSM comprises the experimental approach for exploring the range of the independent variables, an empirical statistical model to create a suitable relationship between the results and the independent variables, and optimization of the methods with suitable independent variable values that yield desirable values of the response.
In maximum RSM conditions, the relationship between the independent variables and the response is unknown. Thus, the initial step of RSM is to identify a suitable guess for the right functional relationship between the independent variables and the responses. Generally, a low-order polynomial equation of the independent variables is employed. If the response is well demonstrated by a linear function of the independent variables, then the opting function is the first-order model [10].

If the system is with curvature, then a higher degree polynomial must be followed, for example, the second-order model [11-12].

Steps involved in designing of an experiment
a. Consider variables in the experimental criteria and notify how they are related to each other
b. Write a precise, testable hypothesis for the experiment
c. Design experimental actions to operate independent variable
d. Allocate subjects to groups
e. Plan how the dependent variable can be measured
Experiments are context-dependent, and apt experimental design will affect all of the considerations of the experimental system to yield data that is valid and relevant for research.
Types of RSM [13]
Standard Full 2nd Order Polynomial Model
It is starting point for many design points, which is based on a modified quadratic equation where each output parameter is a quadratic function of the input variables. The result obtained from this method is satisfactory when changes in output variables are made gently.
In this model, write the output parameter function in terms of input variable as given below, where, f is a quadratic polynomial function:
output = f (inputs)
Kriging Model
It is a multi-dimensional interpolation model that associates a polynomial model analogous to one of the standard response levels, which is stated as a comprehensive model of the design space, plus a detailed local deviation that can intercept design points of the model.
The method denotes the output parameter as a function of input variables as given below:
output = f (inputs) + z(inputs)
Where f is a quadratic polynomial function and z is the deviation term
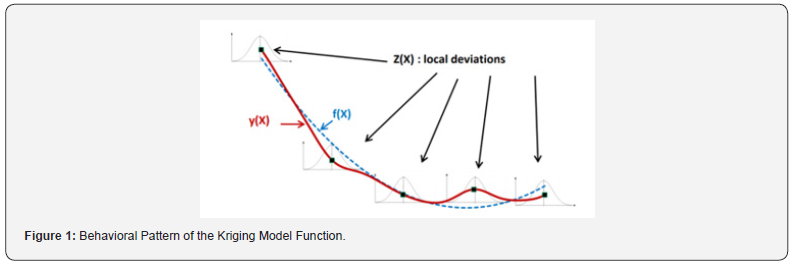
Meanwhile, this model fits the contact surfaces at all design points, so it will always give appropriate goodness of fit criterion. Which has improved results than the standard response surface model, if the output elements are stronger and nonlinear. The major disadvantage is that fluctuations can occur on the response surface. Figure 1 shows the behavioral pattern of the function related to this model. where the behavior of the estimated function comprises a general function (f) combined with a local function (z).
Non-Parametric Regression Model
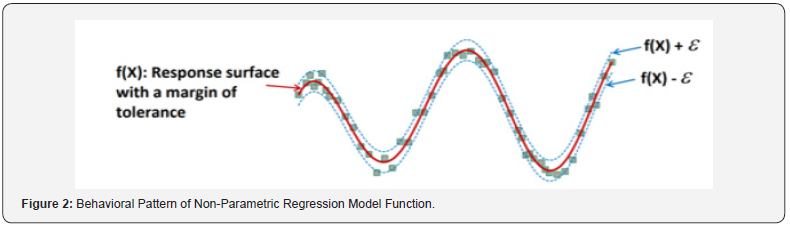
It tends to be a general class of RSM model, where the epsilon (Ԑ) tolerance forms a fine covering around the output response surface and spreads around it. This covering space should comprise all the design sample points. Instability regression is created to estimate the regression function directly, which means instability regression can directly study the effect of independent variables on a dependent parameter without notifying a particular function to create the relationship between the independent and dependent variables. Figure 2 shows the behavioral outline of the function related to the non-parametric regression model. The behavior of the predictable function consists of a principal response surfaces with a margin of tolerance on both side.
Neural Network Model
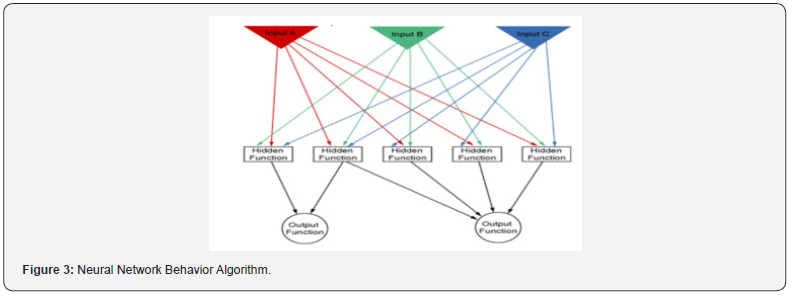
It represents a mathematical practice based on natural neural networks in the human brain, which connects every input variable to weights by arrows. Which can find the inactive or active hidden functions, that are the threshold elements allows the output function to connect or disconnect based on a set of their input variables. Finally, every time the procedure is repeated. It adjusts these weight functions to diminish the error between the response levels with the design points. Figure 3 shows the behavioral algorithm of the cellular network model, which consists of input variables, hidden functions, and output functions.
Sparse Grid Model
It is a type of adaptive response surface, which can continuously correct itself automatically. It usually needs extra design points than other methods. The capability of it is that it adjusts the design points only in the directions that requires. For which, it requires less design points to complete the same quality response level. This model is also fit for cases that contain multiple discontinuities.
Methods of RSM [14]
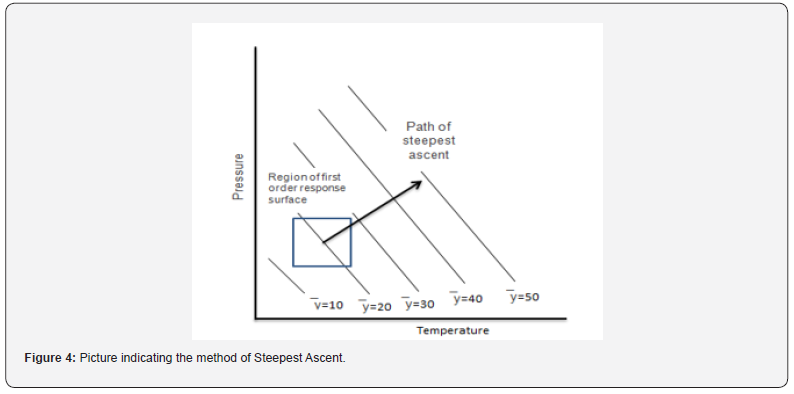
RSM is often a step-wise procedure where the response surface points remote from the optimum. This method focuses on the travel from the existing point to the optimum point with a sequence.
There are two methods for getting the optimum point:
i. The method of steepest ascent
ii. The method of steepest descent
i. Method of Steepest Ascent: It is a course of moving consecutively in the direction of the extreme increase in the response to the optimum response, which is indicated in Figure 4.
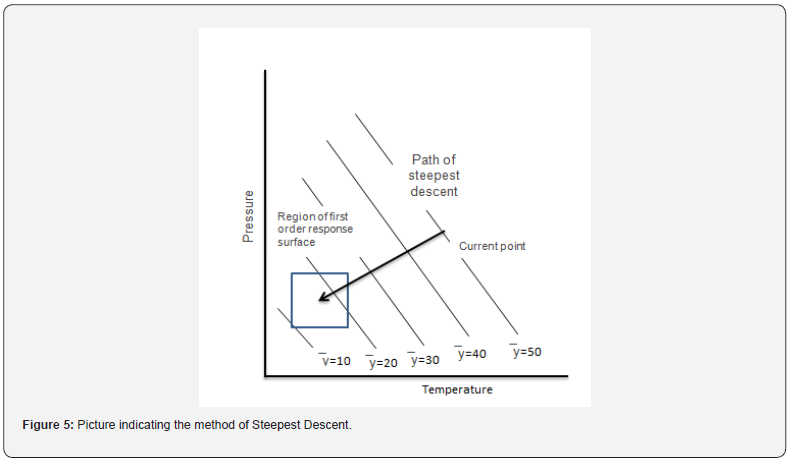
ii. Method of steepest descent: It is a course of moving consecutively to minimize the response, which is indicated in (Figure 5).
Types of response surface modeling [15-16]
i. Central Composite Design (CCD)
ii. Box-Behnken Design (BBD)
i. Central Composite Design (CCD)
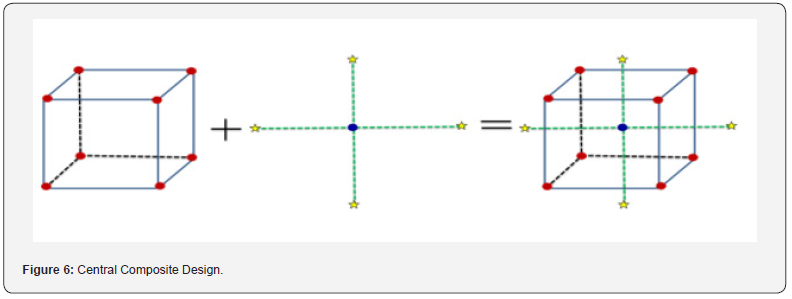
The central composite design is the most widespread and adaptable response surface design and maximum researchers pick this design. The central composite design was published by Box and Wison in the year 1951. A central composite design always has 2 levels and k influencing factors. It comprises axial points and center points. Initially, produce a 2k factorial or a 2k-p fractional factorial design, and then affix extra runs denoted to as axial points (Figure 6). The 2k and 2k-p part of the design permits to fit of first-order terms and relations. Similarly, the axial points help to the extra level required to fit the second-order model.
ii. Box-Behnken Design (BBD)
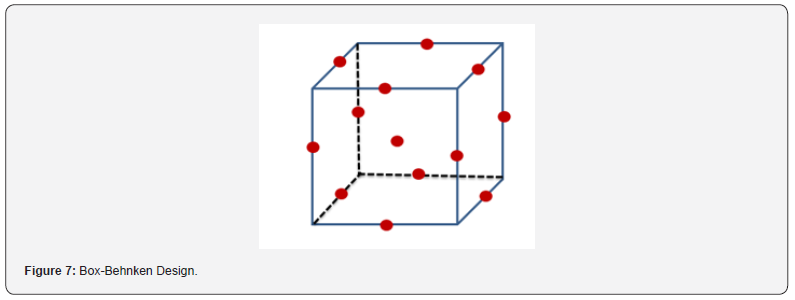
It is the famous response surface method for a three-level factor, suitable for the second-order model to the response. In 1960, Box and Behnken were first established this method. It is a blend of two-level factorial designs with incomplete block designs. The advantage of this design is it does not contain corner points, which means any points at the out of the cubic region formed by the two-level factorial level combinations (Figure 7).
Data analysis
After finishing the experimental work by a suitable RSM design, the output responses may be modelled and the data is fitted with polynomial equation to find the relation between the responses and factors studied. ANOVA is used to test the statistical significance of the model. ANOVA allows the decision of inclusion or exclusion of coefficient of linear terms, interaction terms and quadratic terms in the model based on p-value. If the p-value is less than 0.05 means the response is affected by the varying levels of the input parameters, and that terms have to include in the regression model or else if p-value is greater than 0.05 declares no effects of varying levels of input factors on response, and that should be eliminated from the regression model [17].
Multiple regression model can be adjusted by coefficient of determination values like R2, adjusted R2 and predicted R2. The variation of output response based on the input factors will be explained by R2 value. Addition of new terms to the regression model will increases the R2 value. Adjusted R2 is the modified version of R2, which helps in the adjustment of terms in the regression model, adjusted R2 get increased, if the added terms improve the model. Predicted R2 indicates how well a regression model predicts output responses for new observations and is calculated by removing each observation from the data set systematically. R2 is always higher than adjusted and predicted R2 values. The difference between the predicted and adjusted R2 values should be less than 0.2 in order to obey the fit statistics. Adequate precision measures signal to noise ratio and a ratio of greater than 4 is desirable which tells that the model can be used to navigate the design space. When the error provided by the regression model lack of fit is significantly lower than a random pure error (p-value > 0.05), it indicates that the regression model is well fitted. Lake of fit data must be non-significant and it can be estimated only when replicas usually for centra point are included in the experimental design [18].
Diagnostic plots [19]
a. Normal probability plot: These plots indicate whether the residuals follow normal distribution represented by a straight line. S-shaped curve indicates that transformation of response is necessary to provide better analysis.
b. Residual Vs. Predicted plot: A graph is plotted between residuals and predicted response values in ascending order denoted by a random scatter.
c. Residuals Vs. Run: This is a plot of residuals versus experimental run order denoted by a random scatter.
d. Predicted Vs. Actual: The plot is drawn between predicted versus actual response values.
e. Box-Cox plot for power transforms: This plot is for power transformation based on the best λ value and if a 95% confidence interval around this λ includes 1 then transformation is not recommended.
f. Residual Vs. Factor: This is a plot of residuals versus any factor of choice denoted by a random scatter. If the curvature effect is seen it indicates that the contribution of the independent factor is not taken into consideration.
g. Model graph [20]: To interpret the selected model various graphs are provided in the design expert software. For factorial designs, the most commonly used graphs are one factor, interaction, and cube. For response surface and mixture designs 2D Contour and 3D Surface plots are used.
h. Perturbation plot: These plots compare all factor effects at a particular point in design space and the response is plotted by varying only 1 factor over its range and keeping all other factors constant. The steepest slope or curvature indicates the response is sensitive to that factor and the flat line indicates the response is not affected by that factor.
i. One factor effects plot: These plots show linear effects by changing the levels (-1 : low, +1 high) of a factor and predicting the responses.
j. Interaction graph: These plots appear as two nonparallel lines which indicates that one factor effect depends on another factor level.
k. Contour plot: It is a 2D representation of response plotted against numeric factor combination which shows the relationship between responses.
l. 3D Surface plot: It is a contour plot projection which gives shape along with contour and color.
m. Cube plot: It shows the predicted values from the coded model for the combinations of -1 and +1 levels of any 3 factors.
Optimization by desirability functions approach
This approach finds a factor setting that provides the most desirable response. Each response is assigned a number between 0-1 for a completely undesirable to desirable or ideal response value. Finally overall desirability is obtained by combining the individual response desirabilities using a geometric mean [21].
Conclusion
RSM can be used for the approximation of both experimental and numerical responses. Two steps are necessary, the definition of an approximation function and the design of the plan of experiments. The success of RMS depends on an estimation of y at different locations in the response surface. Therefore, the experimenter can draw a conclusion about whether the system contains optimum or improvement in response. Before any experimenter starts the analysis of the response surface, the application of RMS first begins with investigation of factors or variables. In order to obtain an efficient experiment, unimportant independent variables need to be separated from important ones. One should never start an analysis of the surface until significant factors are identified. After that, the response surface study can start. Four steps for response surface analysis are (1) perform a statistically designed experiment, (2) estimate the coefficients in the response surface equation, (3) check on the adequacy of the equation (via a lack-of-fit test), and (4) study the response surface in the region of interest. Besides statistical and mathematical techniques the graphical representation of the response surface is also helpful in finding answers to problems. Due to broader applications in real-word problems, RMS will continue to attract statisticians, engineers, and scientists in order to develop, improve, and optimize new or existing products and processes.
To Know more about Global Journal of Addiction & Rehabilitation Medicine
To Know more about our Juniper Publishers


