Tuesday, October 22, 2019

Geometric Simulation for 3D-Printed Soft Robots-Juniper Publishers

Robotics & Automation Engineering Journal

Introduction

Robots fabricated by soft materials can provide higher flexibility and thus better safety while interacting with natural objects with low stiffness such as food and human beings. With the growth of three-dimensional (3D) printing, it is even possible to directly fabricate soft robots [1,2] with complex structures and multiple materials realizing highly dexterous tasks like human-interactive grasping and confined area detection [3]. However, with such increased degrees of freedom (DoF), the design of soft robots becomes a very difficult task. It can be made possible by integrating simulation into the design phase. However, the shape deformation comes from many different and complex factors including manufacturing process, material properties, actuation, etc. Especially with the limited understanding of layer-based additive process in AM, it is challenging to formulate a complete mathematical model for the simulation.
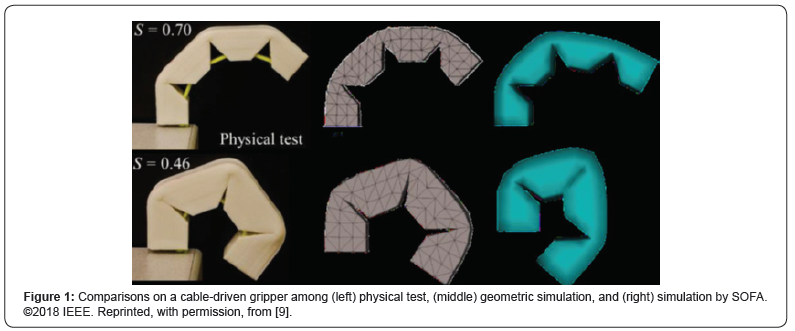
SOFA [4] is one of the most widely used frameworks for physical simulation. It is also applied in the simulation of soft robots that supports interactive deformation [5]. However, it may suffer from the problem of numerical accuracy, particularly if there is large deformation. Unfortunately, one benefit of soft robot is its capability of adapting to highly curved contact by large deformation, which needs to be precisely simulated for many applications. There is another type of simulation methodology to simplify the simulation model of deformation to a geometry optimization problem [6]. It was originally developed in the computer graphics area for visualization, but it has been proved to work superbly in physical simulation like self-transformation structures [7] and the computational efficiency is remarkable [8]. This geometric simulation is particularly suitable for soft robots [9] (Figure 1), because the actuation of soft robots is commonly defined by geometry variations (e.g., cable shortening and pneumatic expansion), and it is actually indirect to first obtain apply them in the conventional deformation simulation. It is shown that the geometric simulation gives better convergence and accuracy than the conventional methods. Therefore, the aim of this review is to share this technique with a broader audience in the robotic community, and discuss the potentials capabilities, and future works of this technology.

Geometric Simulation

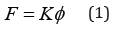
The common way of Finite Element Analysis (FEA) is to apply Hooke’s law to each element and then assemble the equations to compute the deformation with the applied force:
where 𝐹 is the global nodal force vector, 𝐾 is the global stiffness matrix, and 𝛷 is the global nodal displacement vector. In the geometric simulation, the formulation is developed by shape projection on the elements in terms of point positions:
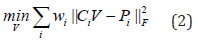
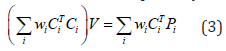
where 𝐕 ∈ ℛ𝑛×3 stacks all the point positions of 𝑛 vertices, Ci ∈ ℛ𝑒×𝑛 is the centering matrix for the 𝑖-th element among 𝑒 elements, Pi ∈ ℛ 𝑒×3 is the variables defining the shape projections for the element, and 𝑤𝑖 is the weight for the element, which is commonly set as the volume. This minimization can be solved by taking derivative and thus a sparse symmetric positive definite system:
This geometric optimization is formulated to minimize the elastic energy with reference to shape variations similar to the physical phenomenon during deformation. To compare Eq. (3) with Eq. (1), they have the same form with:
Therefore, the geometric simulation actually has the benefits as the FEA, but it should be noted the force vector 𝐹 here is defined purely by the shape projections. As a result, this is a direct approach to take the geometric actuation as input and compute the deformed shape of soft robots by numerical optimization using a geometry-based algorithm. To complete the formulation, the shape projections should be carefully defined to model different actuations in the simulation and to model the material properties geometrically. In the state-of-the-art work [9], the geometric constraints of actuations are modeled as a type of element, e.g., aligning the cable with the edge of elements and shorten the edges, or scaling the size of elements for volume expansion in pneumatic actuations. In such way, the actuation can be directly integrated in the optimization without additional computation burdens. In terms of modeling the material properties geometrically in the framework, a calibration step is done to learn the relationship between material properties and shape parameters between hard and soft assignments. Should the element be rigid or preserve its volume is determined by the shape parameters and modeled by the shape projection. It is shown that the calibration method can be used to simulate the deformation of objects with two materials. Different from using constrained nonlinear optimization, the geometry optimization can converge in a few iterations, thanks to the shape projection operator.

Discussion

The development of geometric simulation was motivated by the observation that most actuations of soft robots such as length shortening of cable and volume changing of chamber are based on geometry variation. The geometric optimization tries to preserve shape during deformation with the function of representing actuations as different type of geometric constraints to be imposed on specially designed elements. It shows promising results in terms of accuracy and efficiency, and it is also shown to be possible in the dynamic models [10].

Conclusion

The preliminary results of the geometry-based framework are attractive, and its efficiency opens the opportunity of iterative design for soft robot. However, the current development is still limited with simple structures, materials, and actuations. Therefore, to make this simulation more practical and user friendly, the future works should include extending to different actuations such as thermo, magnetism or electro ones; multiple actuations acting together; multiple materials; non-linear material like hyperplastic material [11]; and multiple bodies with collision detections.


To Know More About Robotics & Automation Engineering Journal Please click on:
 
To Know More About Open Access Journals Please click on: ttps://juniperpublishers.com/index.php

Monday, October 21, 2019

The Use of Plastic Waste as Transition Materials in the Production of Pavement Blocks-Juniper Publishers

Civil Engineering Research Journal 

Abstract

Many developing countries are facing a lot of challenges with management of huge quantities of solid waste generated on daily basis. Plastic waste which is part of solid waste poses a menace to sustainable development due to its slow rate of degradability and the indiscriminate way it is disposed. To lessen the negative impacts on the environment and the associated effects on human health, plastic waste is being considered as materials in transition and are being used in the production of pavement blocks and other materials for construction purposes. The study reports some physical and mechanical properties of plastic waste pavement blocks produced by one company in Ghana which has taken a major lead in the direction of adding value to plastic waste for construction. Results are compared to two other pavement block types made from cement and fired clay pavement blocks and discussed. Using plastic waste as transition materials for pavement blocks may among other benefits listed, translate to reduction in construction cost and large quantities of plastic waste polluting the environment and may contribute to cleaner cities and towns.
Keywords: Plastic waste; Transition materials; Pavement blocks; Environment; Construction

Introduction

Economic growth and changing consumption patterns are resulting in rapid increase in the use of plastics in the world. Thus, consumption of plastic material has increased from 5 million tons in the 1950s to 100 million in the 2000s. In Ghana per capita generation of plastic waste has been reported to be between 0.0016- 0.035kg/person/day. And, plastics make up between 18-20% component materials in the waste stream [1]. There are however concerns about plastic waste disposal methods commonly employed in many developing countries as they do not deal effectively with the large tonnes of plastic waste generated. These disposal methods include dumping plastic waste in landfills, incineration and open littering. Since plastics take several years to degrade, there are challenges associated with their improper disposal which include:
i. Blocking drains and choking of gutters which may contribute to floods
ii. Release of toxic gases into the atmosphere when openly burnt. Some of these gases may be harmful to humans and cause greenhouse effects.
iii. Discarded bottles and containers may serve as breeding grounds for mosquitoes when filled with rainwater.
iv. Washing of the littered plastic materials into water bodies including oceans contributing to decline of ocean life.
Common pavement materials used in Ghana include the cement pavement blocks and the fired clay pavement bricks. Portland cement imported into the country is used in the production of cement pavement blocks and is associated with increasingly high cost due the unstable value of foreign exchange. Fired claypavers produced from available local clay materials are not very popular with a lot of people because they are perceived by many as expensive. The production of fired clay pavers currently in the country relies on firewood burnt at very high temperatures. This firing method is not sustainable and associated with consumption of a lot energy. In recent times, due to the ecological and environmental challenges associated with the disposal of plastic waste, there are a lot of interest in turning plastic waste into a resource in construction. Pavement blocks produced from waste plastic and other materials like sand, quarry dust etc., is recently being promoted in many developing countries as a more affordable and a sustainable material which may be used in construction and Ghana is no exception. Though it is generally known that these plastic waste pavement blocks are strong and durable, there is little scientific data in Ghana to support this claim. This paper therefore reports a study on three types of pavement blocks produced from plastic waste, fired clay, and cement with regards to some of their physical and mechanical properties.

Materials and Methods

Materials

The pavements samples under study were obtained from three different commercial paving factories in Ghana. The raw materials used in the production of these pavers comprised of cement, quarry dust and fine aggregates (sand), for the cement pavers, clay for the clay pavers, and waste plastics and sand for the plastic pavers. Six samples of each paver types were randomly selected and tested for each of the various physical and mechanical properties which include density, compressive strength, flexural strength, abrasive resistance, water of absorption and durability in sea water. Plastic pavement blocks were commercially produced in bigger sizes of 30cm by 30cm. They were cut into 4 equal part with half remaining. And test run on samples of dimension 20cm by 10cm with a thickness of 5cm. This is to make sure all types of pavement blocks have comparable sizes. Cement and fired clay pavement blocks are of hexagonal shape and with dimensions 23cm by 14cm with thickness 5m and 20m by 10.5 with thickness 6.5cm respectively. The samples were cured for more than 28 days to ensure maximum mechanical strength development before the various test were conducted.

Method

Antifungal resistance

Density: The density of the various paving bricks was determined using Archimedes principle of water displacement. Dry weights of various pavers were measured and fully immersed in a tank containing water. The volume of water displaced was measured for each pavement type, and the average volume of water displaced was recorded for five samples each of the various pavers. The densities of the various pavers were determined by dividing the dry weight by the volume of water displaced [2].
Compressive strength: The compressive strength is the most prioritized property to be achieved in the production of paving bricks in almost every factory that is actively involved in manufacturing of pavers [3]. Hydraulic universal testing machine which has a maximum capacity up to 2500KN was used to determine the compressive of the various pavers in this study. The load was applied to the nominal area of the cement, clay and rubberized pavers to determine the various compressive strengths. The corrected compressive strength was computed using correcting factors (BIS, 2006).
Flexural strength: Flexural strength is one of the tests performed on paver blocks which serves as a quality indicator and it is considered as a basis for comparison in terms of wearing resistance. Flexural strength test was performed by subjecting the various pavers to a thwartwise force which is perpendicular to its longitudinal axis. A center line was indicated on top of the pavers which is perpendicular to its length. The pavers were supported by two support rods over a span of 150mm and were tested under a central line load until failure occurred, using the INSTRON universal testing machine. The flexural strength values recorded are the average of five samples each for the various paver [4].
Water of absorption and durability in sea water: Water of absorption is the determination of the rate of absorption by measuring the increase in mass of the pavers resulting from absorption of water over a period. The pavers were fully immersed in a tank of fresh water for 24 hours and the weight measured to determine the percentage of water absorption. And, the pavements were fully immersed in a tank of sea water for four months to determine its durability by applying a load to determine the compressive strength using the universal testing machine. The percent water of absorption is determined using equation (1),

Results

Density

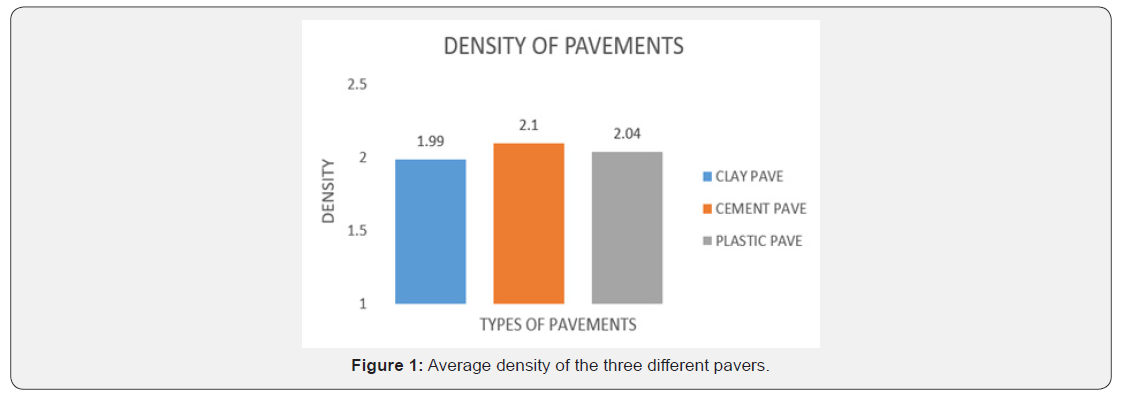
The density values of the various pavers are presented in Figure 1. The values range between 1.99g/cm3 to 2.04 g/cm3, with fired clay pavement block having the lowest and cement pavement block having the highest.

Compressive Strength

As shown in Figure 2 above, clay brick pavement blocks recorded the highest compressive strength followed by the plastic pavement blocks with the cement pavement blocks recording the least compressive strength.

Flexural Strength

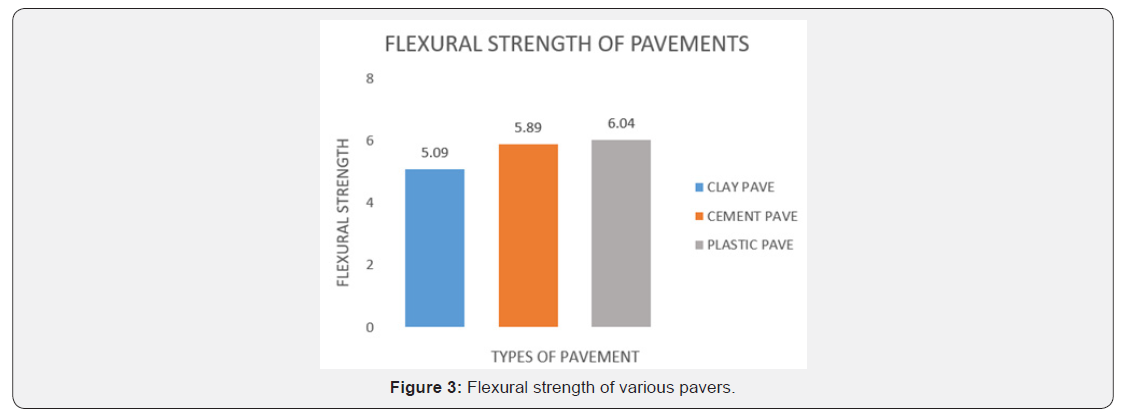
Figure 3 shows the test results of flexural strength of plastic paver, cement paver and clay bricks to be 6.04MPa, 5.86MPa and 5.09MPa respectively.

Water of Absorption

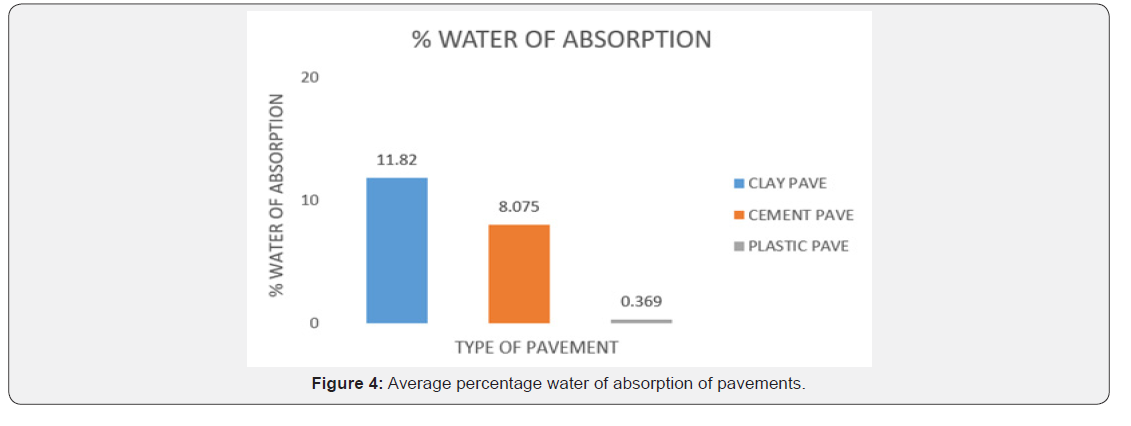
Figure 4 shows the percentage water of absorption test results for clay bricks, cement blocks and plastic pavers as 11.82, 8.075 and 0.369 respectively

Abrasion Resistance

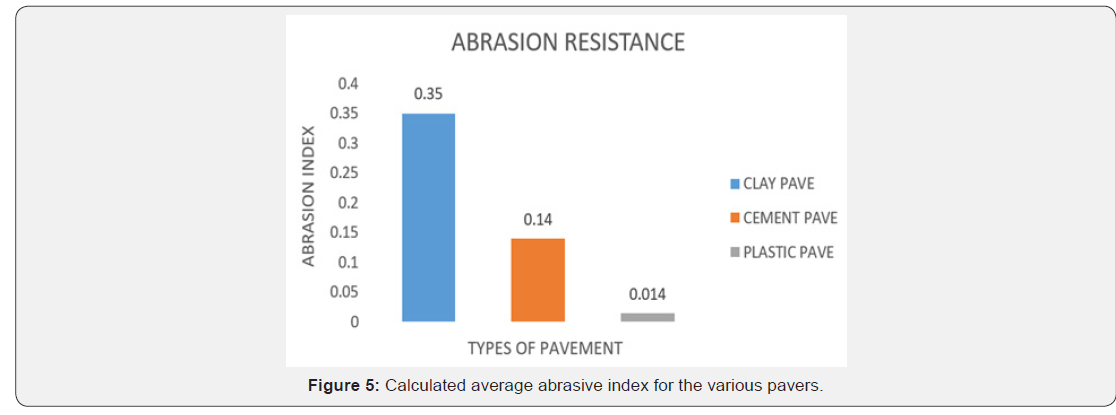
Abrasive resistance is a measure of the resistance of paving brick to the wearing action due to traffic and can be calculated using equation (2).
The maximum abrasion index for Type III i.e. pedestrian and light traffic pavement is 0.50 and the minimum abrasion limit for a 28day cured concrete paver is 1.20 for footpaths and car parks (ASTM C 902-15). The three types of pavers have abrasion index of 0.35, 0.14 and 0.014 for clay, cement and fired clay pavement blocks respectively Figure 5.

Durability in Sea water

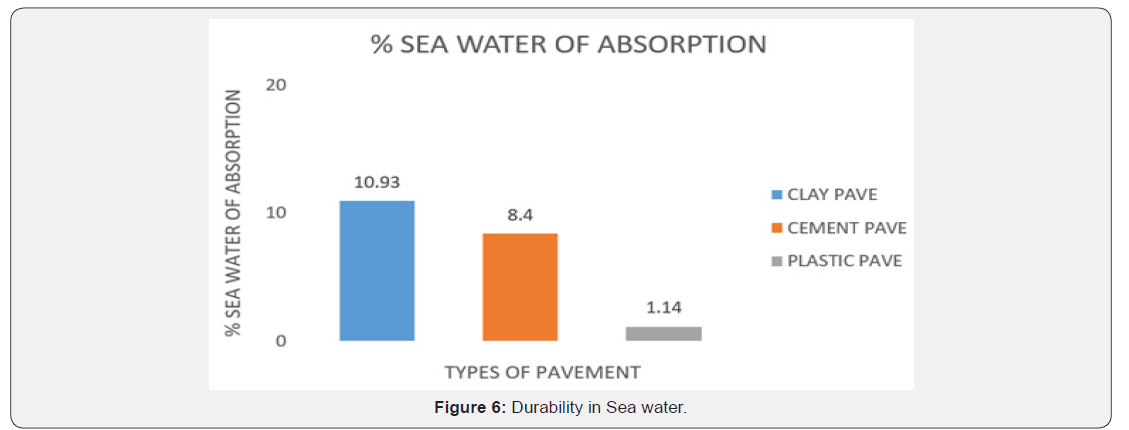
Percentage of seawater absorbed by the three different pavement blocks are shown in Figure 6 above.

Discussion

The density of burnt brick pavers has been stated to be between 1.826g/cm3 and 1.985g/cm3, and specific gravity of special masonry varies between 1.20g/cm3 and 2.40g/cm3(ASTM C-902). From the results in Figure 1, Clay pavers had the minimum density value followed by the plastic and cement pavers of densities 2.04g/ cm3 and 2.10g/cm3 respectively. The 3 types however fall within the standard specification. Clay pavement blocks recorded higher average compressive strength, followed by plastic pavement blocks and then cement pavement blocks. Clay pavement blocks have highest thickness compared to plastic and cement pavement blocks and this may have contributed to the high compressive strength. Also, the compressive strength of the plastic pavement blocks was not determined on full blocks but on a cut-out section, may have caused a reduction in the compressive strength of plastic pavement blocks as noted by Vila et al. [5]. The production of clay bricks currently in Ghana relies on firewood and requires much energy during firing. Harmful gases such CO2 may also be released into the environment which is not eco-friendly. When firing is not well controlled, clay bricks can develop cracks which may lead to reduction in strength.
Cement pavers recorded the least compressive strength value as compared to the rubberized pavers. Poor compaction is a major factor that influence the strength of cement pavers which creates more pores to absorb water. Secondly, decreased strength in concrete pavers can be attributed to variation in the mix proportions in the batching process. Improper mixing proportions and insufficient compaction hinders the achievement of maximum density and creates voids which contributes to reducing the strength of the concrete pavers. Increasing void content and decreasing density decreases the compressive of the concrete pavers [6]. Plastic pavers recorded higher compressive value than cement pavers. Melting of plastics for plastic pavers requires less energy since plastics have low melting points and melting is done at low temperatures. The melting process does not release harmful gases into the environment, and it is cheaper to produce. Therefore, plastic pavers may be used commercially for non-traffic application. The high flexural strength average value obtained for plastic modified pavement block as compared to the concrete pavers and clay bricks may be due to good adhesion of molten plastic to the sand particles and low porosity. This is an indication that the plastic pavement blocks could withstand higher flexural stresses than the rest
Results obtained for water of absorption indicated that clay brick absorbed maximum water as compared to cement paver and plastic paver. The maximum water absorption by the clay bricks may have occurred as a result of the presence of pores and due to the hydrophilic nature of clay. Increased absorption of water may result in loss of bondage of clay particles hence reduced strength of clay pavement blocks in service. The cement pavers absorbed less water as compared to the clay bricks. This is because the cement creates stronger bonds between the particles, and this minimizes the pores through which water get absorbed by the concrete pavement block [7]. However average value obtained for both fired clay and cement pavement blocks are more than the minimum value of 5%. Thus, the use of these pavement blocks may not be durable especially in waterlogged areas. Water absorption values obtained for plastic pavers are within the specified standard of less than 5%. This may be due the low porosity of the rubberized paver and due to the hydrophobic nature of plastics. The water of absorption of plastic pavers have been found to further decrease when the proportion of plastic waste is increased. The low porosity of the plastic pavers may contribute to little or no damage under severe conditions such as heavy rains as compared to clay bricks and cement pavers. Clay bricks and cement pavers may absorb water under severe condition, and this has a tendency of weakening the bonds that exist between their structures which may lead to formation of micro cracks. Hence any load applied on clay bricks and cement pavers, may act on the stress concentration points because of the presence of micro cracks and this may cause decrease in strength. The very low abrasion resistance value recorded by the plastic pavers indicates that plastic pavers have high ability to withstand wearing action than clay bricks and cement pavers which may be as a result of the good adherence of the plastic with the sand aggregates. Seawater durability is the ability of pavers to resist permeability of saline solution and have improved strength to be serviceable. Four months durability in Sea water test results are shown in Figure 4 for the various types of pavers under study.
The permeability of sea water in pavers causes two main actions to occur; chemical reaction which usually occurs within the pavers resulting in softening and disruptive expansion of the pavement blocks, and crystallization of salts which occurs on the surface of the pavers. As pavers absorb sea water, the dissolved salts in the form of crystals are left within the joint and the pores of the pavers which may cause expansion and increases porosity thereby reducing the strength of pavers [8]. As indicated by results in Figure 6, plastic pavers absorbed less Sea water. This may be due to the low porosity exhibited and due to the structure of plastics, i.e. strong with close intermolecular links and so this type of pavers resists sea water [9-14] absorption as compared to the cement and clay pavers. Therefore, plastic pavers may remain stronger in terms of durability in high saline environment.

Conclusion

In this study clay pavement and plastic pavement blocks obtained higher average compressive strength than the cement pavement blocks. Durability studies suggested that plastic pavement blocks may perform better in areas prone to flooding and high saline content. Though the various pavement blocks may be used for footpath, light traffic, walkway etc., the plastic pavement blocks made from waste plastic and sand may be cheaper and represent an alternative way of turning waste material into useful product for a more sustained construction. Plastic waste use as transitional material in construction is a demonstration of how waste could be turned into a resource for cost effective, yet a durable and sustainable material for construction. Other advantages include minimizing plastic waste in the environment, the landfills and water bodies contributing to cleaner cities and towns and creation of more jobs.

To Know More About Civil Engineering Research Journal   Please click on:
 
To Know More About Open Access Journals Please click on: ttps://juniperpublishers.com/index.php

Friday, October 18, 2019

Intra-Thyroidal Thymic Tissue May Display Radiological Features Suggestive of Malignancy - A Case Report-Juniper Publishers

Journal of Head Neck & Spine Surgery

Abstract

Introduction: Thyroid “incidentalomas” are increasing in frequency, thought mainly to be a result of the enhanced sensitivity of ultrasonography and the increasing use of this imaging technique. We present two cases of thyroid nodules in paediatric patients which were found to be intrathyroidal thymic tissue.
Case report: The first case displayed ultrasonographic features that were highly suspicious for papillary thyroid cancer with microcalcification, however following diagnostic hemithyroidectomy the lesion was diagnosed as intra-thyroidal ectopic thymic tissue. Histologically, calcified Hassall’s corpuscles would account for the calcified appearance of the nodule on ultrasound scan. We describe a further case of intra-thyroidal ectopic thymic tissue in another paediatric patient who presented with a thyroid mass.
Discussion:It is important to consider thymic remnant tissue as a differential diagnosis for incidental thyroid nodules.
Keywords: Paediatric; Otolaryngology; Incidental finding; Endocrine gland neoplasms; Thyroid malignancy

Introduction

Thyroid nodules are less commonly found in children, affecting 0.2-1.5%, when compared to adult patients [1]. Paediatric thyroid lesions are however more likely to be malignant and must be carefully investigated [1,2]. There are sporadic reports of intra-thyroidal thymic tissue in the literature, however increasing ultrasound scan use and enhanced sensitivity of ultrasonographic images has resulted in a rise in incidentally found thyroid lesions, which is likely to increase further [3,4]. This has created a diagnostic dilemma for clinicians and lead to an increase in diagnostic thyroid surgeries and an increase in detection of microcarcinomas. Thymic tissue has a distinctive appearance on ultrasound with features that may be misinterpreted as a malignant thyroid nodule [3].
We report two cases of intra-thyroidal ectopic thymic tissue in paediatric patients, both presenting with a thyroid mass. One patient displayed radiological features that were suspicious of malignancy. Both patients underwent diagnostic hemi-thyroidectomy.

Case Report

Case 1

A 4-year-old girl with no co-morbidities presented with cervical lymphadenopathy following an upper respiratory tract infection. An ultrasound noted cervical lymphadenopathy and a solitary thyroid nodule with appearances suspicious of papillary thyroid cancer. There was no family history or other risk factors for thyroid malignancy. Blood tests revealed normal thyroid function, calcitonin and thyroid auto-antibodies.
A repeat ultrasound scan of the neck revealed a hypo-echoic nodule within the left lobe of the thyroid, displaying micro-calcification and was taller than wide leading to a U5 (malignant) diagnostic ultrasound grading (Figure 1). Following diagnostic hemi-thyroidectomy, the nodule was histologically found to be ectopic thymic tissue within the thyroid lobe, with calcification of Hassall’s corpuscles, which would account for the calcified appearance on ultrasound scan.

Case 2

A 12-year-old boy with no co-morbidities presented with a midline neck swelling that had appeared 6 weeks previously. Clinically he was found to have a 4.0 x 5.0cm, non-tender neck mass in the midline with no movement on tongue protrusion. Thyroid function, calcitonin and thyroid auto-antibodies were normal.
Ultrasound revealed a 4.0cm hyper-echoic thyroid lesion arising from the isthmus. Fine needle aspiration cytology (FNAC) was reassuring with morphological features consistent with a benign colloid nodule and classified as Thy 2, however due to the size of the mass the child underwent hemi-thyroidectomy which revealed nodular hyperplasia; ectopic intrathyroidal thymic tissue was also identified throughout the sample.

Discussion

Intra-thyroidal thymic tissue is an uncommon cause of neck swellings and has rarely been reported in the literature with published data from a small number of case reports [3,5]. The thymus is involved in adaptive immunity and T-cell function; it proliferates in the neonatal period and first decade of life and is vital for development of a mature immune system [6]. Embryologically, the thymus is derived from the endoderm of the third and fourth pharyngeal pouch during the 6th gestational week and as the thymo-pharyngeal duct elongates during the 7th week the thymus migrates inferiorly and medially towards the superior mediastinum [4,6]. Ectopic thyroid tissue can therefore be found anywhere from the angle of mouth to the superior mediastinum [5], meaning ectopic thymic tissue can easily be misinterpreted as a pathological neck lump, particularly in the paediatric population.
There are various reports of ectopic thymic tissue. Most commonly it is found as aberrant tissue within the neck, known as ectopic cervical thymic tissue [5]. There are only sporadic reports of in thyroidal thymic tissue, however it has previously been misdiagnosed as papillary thyroid cancer on ultrasound, similar to the case presented [3,5]. The exact epidemiology of intra-thyroidal thymic tissue remains unclear, however one study from Japan suggests that it is present in 1% of children [7]. Similar numbers were found in a study of perinatal thyroid glands [8]. With the increasing use and enhanced sensitivity of ultrasound, higher numbers of ectopic thymic tissue located within the thyroid gland may be detected and potentially misdiagnosed as malignancy, leading to diagnostic surgery, as in the two cases presented.
We present the cases of two children with intra-thyroidal thymic tissue who were referred to our paediatric head and neck tertiary referral service with thyroid masses. One child had a thyroid lesion that was radiologically suspicious for a papillary thyroid cancer with micro-calcifications and a mass that was taller than wide. Micro-calcifications are considered a highly suspicious feature on ultrasound, suggestive of papillary thyroid cancer and would result in a U5 grading on ultrasound according to the British Thyroid Association guidelines [9,10]. Hyperechoic foci within ectopic thymic tissue may be misinterpreted as micro-calcifications, which could mimic a malignant thyroid lesion. The other child had incidental thymic tissue identified throughout the thyroid gland in association with nodular hyperplasia.
The cases presented highlight the complexities of preoperative diagnosis of intra-thyroidal thymic tissue. However, with increasing usage of ultrasound imaging it is important to consider thymic remnant tissue as a differential diagnosis for thyroid nodules, especially as the imaging findings may mimic a malignant thyroid lesion. Unfortunately, due to the suspicious ultrasound features diagnostic thyroid surgery may still be inevitable.

To Know More About Journal of Head Neck & Spine Surgery  Please click on:
 
To Know More About Open Access Journals Please click on: ttps://juniperpublishers.com/index.php

Thursday, October 17, 2019

Effect of Police Confinement Training Period on Respiratory Muscle Power and Hemoglobin in Khartoum State, Sudan-Juniper Publishers

International Journal of Pulmonary & Respiratory Sciences

Abstract

Introduction: Adequate aerobic capacity and muscle strength are essential elements to perform the activities that are required from professional soldiers & officers to optimize their peak performance & maintain physically demanding tasks. The newly recruited police officers will be subjected to 6_8 week's confinement in which they will have a training program including exercise & initial police training. The objective of this study was to assess the respiratory muscle power, blood pressure and hemoglobin during this period.
Method: This was a cross sectional study conducted during the period from July to September 2017 in Soba, faculty of police science and law, Khartoum, Sudan. Eighty-one policemen trainee were randomly selected, aged between 20 and 30 years underwent evaluation before & after the confinement period (40 days). Maximal respiratory pressure (MEP and MIP) was measured using respiratory pressure meter for respiratory muscle power. Hemoglobin, pulse & blood pressure was also measured.
Results: The mean values of MEP & MIP were significantly higher after the end of the confinement period (P>0.05). Also there was significant change in the mean of hemoglobin before & after the confinement period (p= 0.03). There was no change in pulse & blood pressures.
Conclusion: Police training confinement improves respiratory muscle power & hemoglobin level.
Keywords: Police training; Respiratory muscle power; Hb level in police training

Introduction

Exercise is a stressful situation that produces marked changes in body functions including the respiratory system. The physical inactivity is directly related to morbidity and mortality from many diseases [1]. Therefore, physical training is one of the major bases for good health and wellbeing and currently globally recommended [2]. During exercise the body's demand for oxygen increases as the breathing must also rise. This requires numerous muscles surrounding the lungs to contract in a highly coordinated manner. As the intensity of exercise increases, the respiratory muscles contract more forcefully and quickly to keep pace with the increase in oxygen demand. Training of the respiratory muscles increases their strength and improves lung function and was found to reduce the severity of obstructive sleep apnea in cervical spinal cord injury and improves breathing pattern in patients with COPD [3,4].
Maximal inspiratory pressure (MIP) and maximal expiratory pressure (MEP) are useful indices for assessment of respiratory muscles performance in adults as well as in children [5]. Several cross-sectional and cohort studies have shown significant improvement of lung function as a result of exercise in both children and adolescents [6-9]. However, measurement of respiratory muscles strength has not been widely investigated in relation to physical training. In this context, the present study aimed at assessing pulmonary function as well as respiratory muscles strength among policewomen trainees compared to healthy untrained sedentary group of medical students.
The common physiological changes that alter the body during exercise are the cardiopulmonary changes; mainly they include increase in pulmonary ventilation (breathing) which directly proportionate to the intensity & metabolic needs of exercise. Breathing may increase from typical resting rate of 15 breaths per min up to 40-50 breath per minute. As the intensity of exercise continue to increase a person reaches a maximum point above which oxygen consumption will not increase any more. This point is known as VO2 MAX and can be improved by long term endurance by increasing aerobic enzyme activity & improving glycogen stores in muscle.
A previous study was done by Awad et al. [10] 2012 on the effect of police training on some cardiopulmonary & hematological parameters in Khartoum state, Sudan. The aim of their study was to investigate the effect of training of male police officers on the spirometeric lung function test parameters, respiratory muscle power, blood pressure, hemoglobin & white blood cells. A cross sectional study conducted during the period from October to December 2012, in which 59 policemen trainee were randomly selected with another 30 medical students as control. The maximum inspiratory and expiratory pressure (MIP&MEP) were found to be significantly higher in police trainee MIP 106.9+28.17 cmH2O (P=0.005) and MEP 137.51+ 31.68 cmH2O (P=0.000) compared to control MIP 88.13+30.96 cmH2o and MEP 103.57+ 29.9 cmH2O. There was significant increase in Hb value, the mean of Hb in policemen was 14.5g/dl compared to control group 13.7g/dl.
Another study done by Segizbaeva MO et al. [11] on the effect of inspiratory muscle training on resistance to fatigue of respiratory muscles during exhaustive exercise. Daily inspiratory muscle strength training was performed for 3 weeks in 10 male subjects .the study found that inspiratory muscle training results in a significant increase in MIP (+18%) [11]. A study done by Branch Rasht, Islamic Azad University 2011 on the effect of one period of training on hemoglobin, hematocrit and RBCs of athlete girls. In which13 athlete girls were selected none randomly for 8 weeks of training .They found that there was significant decrease in HB after the period of training (P=0.045) [12]. Some of the studies suggest that in endurance- trained athletes hematological parameters such as hematocrit, hemoglobin concentration, and red blood cell (RBC) count are reduced, mainly due to exercise-induced plasma volume expansion, which sets in within a few days of exercise training [13]. One of the studies suggests that the physical training itself has no significant effect on hematological variables in athletes compared with controls. The specific type of duration of training is of major importance in adaptation of the RBC system and the iron metabolism [14].
Some of the studies performed to assess the influence of duration of training on hematological parameters among runners and compared them with age- and sex-matched controls group. They found that there is an increase in the counts of RBC and hemoglobin concentration in the runners compared to controls group [15-18]. The aim of this study was to investigate the effects of police training during confinement period on respiratory muscle power, blood pressure, pulse and hemoglobin.

Methods

A cross sectional descriptive study was conducted during July to September 2017 in the faculty of police sciences and law, Soba, Khartoum state, Sudan. Study population included 81 newly recruited subjects. The subjects were healthy with no symptoms of present illness aged between 20_30 years. Any subject with a history of cardiorespiratory diseases & acute respiratory infection were excluded from the study. The students were informed by consent to get sociodemographic data. Their weight was recorded without shoes on a weighing scale. Pulse was counted & blood pressure measured in a sitting position with a sphygmomanometer. Respiratory muscle power was measured by respiratory pressure meter (RPM), in measuring the maximum expiratory pressure (MEP) the subject was asked to inhale to the total lung capacity (TLC) & then exhale with as much effort as possible through the controlled leak of the meter for at least 3 seconds. The reading displayed was the maximum average expiratory pressure over 1 second. While the maximum inspiratory effort (MIP) was conducted by having the subjects expire to a residual volume (RV) & then perform a maximum inspiratory maneuver. The reading displayed was the maximum average inspiratory pressure over one second. Blood sample was collected into a container tube containing K3_EDTA (anticoagulant), and HB was measured using sysmex KX-21 automated hematology.

Results


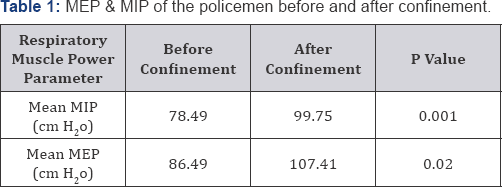
The average age of the studied subjects was 25.5. The mean weight of participants was 85+ 7 Kg before training and 75+7 Kg after confinement period. The mean length of the participant was 180 +9 cm before and after confinement period. Our study found that the respiratory muscle powers measured by MIP & MEP were significantly increased after the confinement period (Table 1 & Figure 1). There was significant change in mean blood hemoglobin level before & after confinement as the meanHB level was found to be 11.75 g/dl before confinement period compared to 11.88 g/dl after i. There was no change in pulse & blood pressure. After the end of confinement period (The systolic mean pressure =117.4 mmHg) (diastolic mean pressure = 80.74mmHg) (pulse mean=84.74 beat/min).

Discussion

This study showed that the mean value of respiratory muscle power (MIP & MEP) were significantly higher after the end of confinement period MIP (p=0.001) & MEP (P=0.02) these finding did not differ much from the previous studies. A study done by Kamal et al. [10] and Segizbaeva et al. [11]. Our study showed that there was increase in hemoglobin level after the end of confinement period could be due to good nutritional status, or exercise induced hemo concentration as a result of fluid transfer from the blood to interstitial space. This differ from a previous study done by Islamic Azad University 2011 [12] suggested aerobic training decrease HB, HTC and RBCs in athlete. In our study there was no change in systolic & diastolic blood pressure after the end of confinement period. This differed from a study done by Kamal et al. [10] they found significant decrease in systolic blood pressure (P=0.001) and diastolic blood pressure (P=0.007) in policemen.

Conclusion

Physical training and exercise during the confinement period improved the pulmonary function and respiratory muscle power in police trainees after 40 days of training.


To Know More About International journal of Pulmonary & Respiratory Sciences  Please click on:
 
To Know More About Open Access Journals Please click on: ttps://juniperpublishers.com/index.php

Wednesday, October 16, 2019

Design of A Roadmap for Implementing A Quality Approach At ONS-Algeria-Juniper Publishers

Biostatistics and Biometrics Open Access Journal

Abstract

The rapid changes in Algeria have had and continue to have a profound impact on infrastructure, economic agents and the population as a whole. These transformations have already turned the statistical landscape upside down and will continue to do so. In fact, the need for statistical data has changed and evolved in terms of the nature of the statistics, on one hand, and requirements regarding availability, quality and time, on the other hand. Starting from the context described above, the development of ONS-Algeria’s quality approach is essentially based on the capitalization of the work of cooperation with Eurostat on the principles of the European Quality Assurance Framework for Official Statistics (QAF), the option for a participatory and transparent process to enrich this approach and facilitate its appropriation and lastly, conducting the process in stages. In driving the process step by step, to optimize its management, our paper will address the issues related to the design of a roadmap for implementing the Code of Practice (CoP) for the ENP south countries.
Keywords: Code of practice; Implementation challenges; Quality management; ENP South countries
Abbrevations: QAF: Quality Assurance Framework for Official Statistics; Code of Practice; GSBPM: General Statistical Model of The Operational Process; METIS: Statistical Metadata; SAQ: Self-Assessment Questionnaire; CPI: Consumer Price Index

Introduction

The rapid changes in the country have had and continue to have a profound impact on infrastructure, economic agents and the population as a whole. These transformations have already turned the statistical landscape upside down and will continue to do so. In fact, the need for statistical data has changed and evolved in terms of the nature of the statistics, on one hand, and requirements regarding availability, quality and time, on the other hand [1-3]. Starting from the context described above, the development of our quality approach is essentially based on the following three principles:
a. The capitalization of cooperation initiatives with Eurostat on the principles of the European Quality Assurance Framework for Official Statistics (QAF);
b. The choice of a participatory and transparent process to enrich this approach and facilitate our making it our own;
c. And lastly, conducting the process step by step, in order to optimize its steering.

Approach

It should be noted that ONS takes into account quality guidelines in the performance of its processes according to international standards. Indeed, ONS participates in the work of the South Mediterranean Quality Working Group and contributed to the development of the Regional Code of Practice (CoP) (ENP-South) [4].
In tandem with the “classical” quality approach, which requires rapid and intense mobilization of resources, and referring to the QAF guidelines, the quality approach adopted by ONS, based on the CoP, is a step-by-step and progressive quality approach. It is organized around four levels of a step by step implementation:
I. Recurring surveys
II. Structural surveys
III. Major operations such as census
IV. The institution
As each survey phase is a potential source of errors, it is necessary to analyze the different processes within each phase, to determine the errors and to find the methods to eliminate them or to reduce them.
Even though ONS applies control actions in carrying out these surveys, a well-defined quality control system is needed and is part of the projects carried out by the quality unit. In fact, the control actions to be integrated into the production process to improve the quality of the data are:
a. Preventive control actions are put to practice to prevent errors from being verified: we act on the sources of errors.
b. Ongoing control actions are applied to monitor and correct errors while performing a survey. One can find tools and methods to identify errors when they are verified and to limit their effects on the survey results.
c. A posteriori evaluation actions are those operations that make it possible to measure errors directly or indirectly, and in particular control surveys carried out after data collection.
Therefore, all of these control actions represent the quality control system of a survey. For this reason, when designing and conducting a survey, part of the budget must be reserved for data quality control actions.
In addition, the use of the general statistical model of the operational process (GSBPM), developed by the UNECE/Eurostat/OECD working group on Statistical Metadata (METIS), to document our statistical operations. Indeed, the GSBPM has been developed to provide a standard framework for the operational processes required to produce official statistics. The GBSPM can also be used to integrate standards relating to data and metadata, as a model for process documentation for the harmonization of statistical IT infrastructure, and to provide a framework for assessing and improving the quality of data: it is a representation model of the statistical process. Quality being considered as an overarching process, this model highlights the principle that quality must be integrated at every stage, combined with the notion that quality is multidimensional. Hence, this model is defined by the aspects related, on the one hand, to the quality of the statistical data (relevance, accuracy, etc.) and, on the other hand, to the quality of the process (precision of needs, design, implementation, execution and evaluation) [5,6].

Implementation

In order to ensure that the implementation, of the quality approach at ONS, is rigorous; we base its framework on the following manuals:
i. Quality Assurance Framework (QAF): defining the principles of the quality system.
ii. Code of Practice (CoP): defining the indicators measuring the implementation of the quality system.
iii. The Self-Assessment Questionnaire (SAQ): measuring the implementation of the quality system at two levels:
• Institutional
• Process.
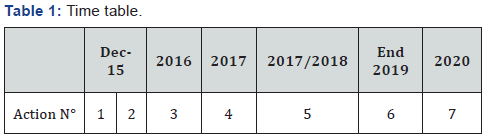
To achieve these objectives, the stages/actions of the gradual implementation of our quality approach could be broken down as follows (Table 1):
i. A clear display (website, notes to the technical and regional departments) of the Commitment on Quality by Top Management.
ii. The designation of the technical staff assigned to the unit in charge of quality support and communication with the technical departments.
iii. The presentation of quality tools and related documentation by the Quality Unit, under the control and with the support of Top Management, to the technical departments.
iv. The implementation of the GSBPM to document the collection processes for the Consumer Price Index (CPI) and the labor force surveys, and other surveys deemed appropriate by Top Management.
v. The implementation of the SAQ by the structures that applied the GSBPM.
vi. The implementation of the GSBPM and SAQ for the population census.
vii. A self-evaluation process through the implementation of the SAQ by the institution.

Conclusion

We should note that executives tend to have a relatively rosy view of how well-defined their culture is and how nicely it is performing. Those in quality management who are closer to where the rubber meets the road have a dimmer view. Without consensus on what’s broken and how bad it is, there will be disagreement on what to fix. Such discoveries shouldn’t be news to anyone who has lead or is aspiring to achieve a strong and sustainable culture of quality excellence.
Hence, at ONS we are aware that it would be especially helpful if suggestions were woven together to answer at least a few important questions and improve our approach:
a. Are there any details missing in the approach that must be understood for a successful culture of quality? b. Because understanding users is critical to guiding success, is there some intuitive framework or method accessible to management and quality practitioners alike?
c. Is there a quick, easy, and practical way to determine how well top management and the rest of the organization agrees on the cultural characteristics of excellence?
d. Would such a cultural assessment be enough to inspire consensus for action?
Furthermore, from the first stages of implementation, three guidelines that rise to the top and are strongly related to each other:
I. All employees must apply the key elements of any strategy for building a quality culture.
II. Closely understand user expectations so we can focus and give them what they want.
III. Develop a formal quality policy, common language, and leader behaviors as deployment mechanisms.
We do understand that changing our culture to integrate quality excellence is not an easy process. We’ll have good days and bad days, progress and setbacks. We have to keep going when change is hard as we are inspired by this Henry Ford’s quote: “One of the greatest discoveries a man makes, one of his great surprises, is to find he can do what he was afraid he couldn’t do.” 

To Know More About Biostatistics and Biometrics Open Access Journal  Please click on:
 
To Know More About Open Access Journals Please click on: ttps://juniperpublishers.com/index.php


Friday, October 11, 2019

Comparative Assessment of Arsenic Contamination in Raw Milk, Infant Formulas and Breast Milk-Juniper Publishers

Journal of Dairy & Veterinary sciences


Abstract

Rapidly growing urbanization and increased industrialization has led to introduction of numerous detrimental toxicants into the environment. Such toxicants which are hazardous to human health, ultimately become a part of our food chain and accumulate in human body, in levels exceeding permissible limits. One of the most common food toxicants is heavy metals out of which Arsenic ranks 1st in the list of top 20 hazardous substances. Arsenic intake has been found to induce skin, liver, bladder and lung cancers, disturb GIT, cause fatigue, arrhythmia, bruising, nerve impairment, hyperkeratosis, hyperpigmentation of skin, gangrene, cyanosis and black foot disease. Milk and milk-based products from different milch animals that make up one of the most nutritious categories of food are reported for being contaminated with Arsenic, worldwide. Arsenic is introduced in milk from human and other milk producing animals by the intake of arsenic contaminated water or through their feed. On the other hand, breast feeding is reducing day by day due to a false verdict that it is unsafe for infants whereas infant formula milk is safer, as heavy metals like arsenic become a part of human milk in areas with high arsenic content in drinking waters. Therefore, this review highlights various studies determining arsenic contamination in raw milk, infant milk formulas as well as breast milk, in an attempt to create awareness regarding which mode of infant nutrition is safest to choose
Keywords: Arsenic; Heavy Metals; Milk Contamination; Infant formulas; Breast feeding

Introduction

From farm to fork, food is subjected to numerous potential hazards of physical, chemical and microbiological nature, making it quite a challenge to ensure that the food is not at all toxic for human consumption [1,2].Toxicity is a condition when a micronutrient or additive or any toxic compound exceeds its safety limit and causes adverse health effects. The trace elements in different foods are of significant interest because of their essential (as micronutrients) or toxic nature. Although there are many potential toxins related to foodstuff but heavy metals are quite common and abundant. Heavy metals are the metals which have high density (more than 5 g/cm3) and are dangerous for human consumption if exceeding their safety limits. According to the list of “Top 20 Hazardous Substances” compiled by the U.S. Environmental Protection Agency and the Agency for Toxic Substances and Disease Registry (ATSDR), heavy metals including Arsenic (As), Lead (Pb), Mercury (Hg), and Cadmium (Cd) stand on 1st, 2nd, 3rd and 4th position, respectively. Arsenic is of prime importance as it is a common yet potent water contaminant and from there it transfers to different food by coming in contact directly or indirectly. This heavy metal has been reported to pose multiple adverse effects on human health as well.
Milk and milk-based products make up one of the most nutritious category of foods rich in protein and minerals, a great source of calcium and magnesium, as well as trace amounts of essential elements such as iron, copper and zinc. Since, the primary form of feed at infant level to almost all ages is milk, therefore milk and milk-based products have always been valued for their significant role in body growth and development. Unfortunately, the rapidly increasing urbanization and growing industrialization have immensely polluted the environment and consequently milk and milk-based products have been highly contaminated with several toxic substances particularly heavy metals that may pose detrimental effects to human health [3]. Milk is also being contaminated with arsenic. Arsenic is introduced in milk from human and other milk producing animals by the intake of arsenic contaminated water or through their feed. This is known to exceed the safety limits i.e. 0.1 mg/ml. Breast feeding is reducing day by day due to false consideration that it is not safe for infants whereas infant formula milk is safer, as heavy metals like arsenic becomes a part of human milk in areas with high arsenic content in drinking waters. This review paper is written to shed some light on this issue and highlight the studies that indicate the arsenic contamination in milk.

Heavy Metals

Heavy metals are the metals whose specific gravity exceeds 5g/cm3 in their standard state. The most toxic heavy metals are namely Arsenic, Lead, Mercury, and Cadmium ranked 1st, 2nd, 3rd, and 4th in the list, respectively. Presence of these heavy metals is to be measured in parts per million (ppm), and the obtained values are to be compared to the Provisional Tolerable Weekly Intake (PTWI) for toxic metals as set by the FAO. Heavy metals that contaminate milk might originate from the milking utensils, milking personnel, milk processing, contaminated water used for agricultural purposes and animal fodder, as well as the immediate surroundings of milch animal [2].

Heavy Metals Toxicity

The toxicity of heavy metals results due to the longterm exposure to low contamination sources in our environment, including in the air we breathe, water and food we consume. Lead, chromium, nickel, cadmium and cobalt are the common heavy metals that might contaminate cows and other environments, disrupt milk at different levels and cause numerous problems. The contamination of milk products with heavy metals might be a consequence of the contamination of the basic cow milk that has been exposed to contaminated atmosphere including feed or poor water source. Moreover, contamination of raw milk might occur during its production. Cadmium, mercury and lead are quite hazardous to human health therefore they are referred to as a major menace to humans when consumed along with food [2]. Another study named as “Lead and Mercury in Breast Milk”, has reported the presence of Mercury in breast milk as well as bovine milk in substantially higher amounts as compared to those observed in common infant formulas. Whereas the Levels of lead in breast milk are relatively lesser than that found in milk-based infant formulas [4].

Health Risks Associated with Heavy Metals

Heavy metals belong to a class of pervasive toxicants that prevail everywhere in land, air and water. Among all the toxicants, arsenic (As) and mercury (Hg) were considered to be unusual, since they exist in a series of different chemical species with diverse toxicities to human beings [5]. Heavy metals when accumulate in the body might cause various diseases including nervous system disorders, renal failure, genetic mutations, types of cancers, neurological disorders, respiratory disorders, cardiovascular diseases, immune system weakening and infertility. Lead causes onset and development of various cancers, central nervous system disorders, anemia, renal, hepatic and cardiac damage, compromised immune system as well as weakened GIT tract. Lead can also cause encephalitis and hepatitis. Whereas Cadmium deposits in body tissues just like the liver and kidneys, causing anemia, as well as elevated blood pressure. Cadmium is also a potent carcinogen that can readily induce tumor development particularly in the prostrate and lungs.

Health Risks Linked with Arsenic

Arsenic toxicity has emerged as a worldwide health issue that has affected masses of people because of its high prevalence in land, air and water resources, as well as absorption in food crops. The maximum permissible limit for arsenic in milk established by European Union Commission is about 0.1 mg/ ml (European Union 2006). The organic forms of arsenic such as monomethylarsenic (MMA), dimethylarsenic (DMA), arsenobetaine and arsenocholinehave been observed to be relatively nontoxic in comparison to its inorganic formsarsenite (AsIII) and arsenate (AsV) that have been categorized as Type 1 carcinogens by the International Agency for Research on Cancer (IARC) [6]. Comprehensive data is present to validate the oraltoxicity of inorganic arsenic along with its various carcinogenic and non-carcinogenic effects. Its intake has been reported to cause generalized body fatigue, disturbed GIT, arrhythmia, bruising and nerve impairment. The most distinctive effects that are observed as a result of prolonged oral exposure of arsenic are hyperpigmentation of the skin and hyperkeratosis. Other noncarcinogenic effects might include peripheral vascular effects such as gangrene, cyanosis, blackfoot disease and various other cardiovascular effects including circulatory problems as well as increased blood pressure. Oral exposure to inorganic arsenic has also been observed to increase the risk of cancer in the skin, liver, bladder and lungs [7]. Previous century witnessed a massive, endemic disease just due to contamination of drinking water with arsenic, called Hydroarsenism Chronic Regional Endemic that is associated with a specific type of skin cancer.
A number of factors are responsible for severity of toxicity of arsenic in humans. These factors include age, sex, nutritional status, concentration, dose and duration of exposure to arsenic. Arsenic exposure during gestation period has been observed to pose detrimental effects on development of fetus through irreversible faltering of thioredoxinreductase, methyltransferases and DNA repair enzymes. Human arsenic toxicity has also been associated with epigenetic changes like DNA methylation, histone modification and RNA interference whereas chronic arsenic exposure might result in an increased risk of diabetes mellitus. Arsenic is the first metalloid which is directly associated with adverse pregnancy outcomes (APO) and even induces lungs, skin and urinary bladder cancers [8,9]. Long-term exposure to As might result in arsenicosis-a term that refers to arsenic related health effects including internal cancers (lung, kidney, bladder), skin problems, skin cancers, diseases of the blood vessels of the legs and feet, hyperkeratosis, hyperpigmentation, hair hypomelanosis and mee’s lines [10]. The actual mechanism behind how arsenic induces cancers is yet not completely understood. While certain studies declare arsenic toxicity to be affective on child intelligence (e.g., perceptual reasoning, verbal comprehension and working memory) as well [11].

Arsenic in Breast Milk

Mothers’ milk is the basic source of nutrition of the offspring; therefore, it is indispensable to ensure that the composition of human milk is safe enough for the infant. Lately, the presence of lead, cadmium and mercury in human milk, has been reported as well. Due to prevalence of arsenic rich bedrock in widespread areas of the world, ground water is often detected with high concentration of arsenic and travels through the entire food chain to ultimately become a part of mother’s milk as well. Native Andeans living in a village at the northwest of Argentina have been reported with high concentrations of arsenic (200μg/l) in the drinking water. Whereas, low concentrations of arsenic were detected in the breast milk and urine of the nursing babies in relation to the high level of maternal exposure. This shows that inorganic arsenic is not found in breast milk to a significant extent. Therefore, there is a quite valid reason for long breast-feeding periods for newborns [12].
A study revealed that in Izmir, breast milk was observed to be considered toxic for suckling infants, but still less than the cow’s milk. Therefore, the point to ponder is that arsenic contamination through breast or cow’s milk is relatively higher in babies living in areas with higher thermal activity or in regions where ground water has higher arsenic concentration (Ulman, C. et al.,1998). In another study atomic absorption spectrometry was used to measure level of arsenic in 64 samples of breast milk collected from Ankara, Turkey and the arsenic level appeared to be below the limit of quantification (LOQ, 7.6μg/l) in all samples [13]. The probable effects of arsenic contamination for nursing new-borns and infants, were also analyzed by Sternowsky & Moser [14] with a Perkin-Elmer Type 403 hydride-generation atomic absorption spectrometer, equipped with an arsenic EDL-lamp using 36 breast milk samples obtained from three different regions of Germany. Arsenic was not detectable, i.e. below 0.3μg/l, in majority of samples whereas the greatest concentration of 2.8μg/l was obtained in a sample from the rural area. It was revealed that Arsenic concentrations did not vary in samples obtained before and after nursing nor with the age of the infant.
Khan & Ismail [15] also determined arsenic concentration in breast milk samples collected from all over Pakistan. The results of the study indicated the presence of arsenic in the mother milk samples within the range of 0.092-1.240mg/L, while the mean as level was 0.504 ppb. The concentration of arsenic in the mother milk was found to be within the safe limits. Although, Breastfeeding is the primary preventive measure that can be given to the child at birth, the ratio of exclusively breast milk fed babies for their first six months has dropped from about 20% in 1998 to 16% in 2003 [12].

Arsenic in Milk and Milk Products

Arsenic is considered as one of the inevitable contaminants for human beings and is well known as a toxic element since ancient times. Humans are exposed to many chemical forms of both inorganic and organic arsenic but the highly stable organic forms are apparently nontoxic. Arsenic content of foods is generally less than 1 mg/kg, with the exception of seafood in which arsenic is predominantly in the organic form [16]. Prolonged, chronic exposure to inorganic arsenic through breathing, drinking or ingestion has been linked to, skin, lungs and urinary bladder cancer [17]. In past decade, almost 13,000 Japanese infants have been afflicted with contaminated milk powder, majorly in the western part of the country where industrialization was considerable. Affected infants reported diarrhea, fever, skin pigmentation, whereas more than 100 died from acute poisoning [4].
Carrera et al, 2004 also determined the concentration of arsenic in cow milk samples collected from Cordoba. The arsenic was found to be in the range of 0.3-10.5 ng/g. Dakeisi et al, 2006 analyzed the concentration of arsenic in milk powder as well. The level of arsenic contamination in milk powder was found to be in the range of 4-7mg/l. In 2005, ANTUNOVIĆ et al, used a hybrid technique on an atomic absorption spectrophotometerto determine the arsenic content of milk and the results revealed that arsenic concentrations in ewe milk varied depending on the lactation stage. Concentration of arsenic was lower in colostrum at 2nd lactation day (As0.011mg/kg) as compared with milk on the 10th (As: 0.025 mg/kg), 30th (As: 0.028 mg/kg) and 60th (As: 0.029mg/kg) lactation day. Licata & Trombetta [18] assessed the milk from 40 cows bred on various farms in Calabria to determine the load of heavy metal contamination in them. Quantitative analyses performed using an atomic absorption spectrophotometer with graphite furnace; followed by hot vapor generation technique showed the mean concentration of as in samples was about (37.90μg/kg). In 1999 arsenic levels were determined in cow milk samples collected at the most important dairy farms of the Comarca Lagunera in Coahuila and Durango, Mexico, a region naturally rich in Arsenic. Arsenic concentrations found in milk ranged from <0.9 to 27.4 ng g-1. Using a pharmacokinetic approach, it was found that the cow’s milk biotransfer factor for arsenic was up to 6 × 10⁻⁴ [19].
The concentration of Arsenic in Philippine’s infant formula milk for 6-12 months old was also analyzed by Cruz, Din [20] using Atomic Absorption Spectrophotometry and results were compared with an existing standard for permissible quantities of arsenic in food products as set by the World Health Organization. All the infant formulas tested showed up to be negative for Arsenic. Another study was conducted to determine arsenic concentration in 32 raw cow milk samples collected from traditional and industrial sites of Arak City, Markazi Province, Iran using an atomic absorption spectrometer. The residual amounts of as were found out to be lower than permissible limits established by Codex Alimentarius [2].
Therefore, considering the stated previous studies, we cannot conclude that all the infant formula milk available in markets worldwide, contains toxic heavy metals or not. However, this study can be further utilized as a reference or a foundation for future in-depth analysis of heavy metal contamination in various foods. This review can also help create awareness among consumers, manufacturers, and the professionals in the health care system because of its cumulative display of important statistics regarding heavy metal contamination in foodstuff.

Conclusion

Milk is no doubt affected by the heavy metal contaminated water sources, yet the above discussed studies showed that human milk is still the safest of all, as arsenic levels do not vary significantly even if one is taking arsenic contaminated water in daily routine, however it may be a potent risk on a long term basis. Furthermore, safety of milk obtained from different animals with respect to arsenic contamination showed that if it is taken from a sheep, it is least susceptible to Arsenic toxicity even from a place with higher Arsenic content in water, but the cow milk is most susceptible. In a nutshell the misconception of breast milk being unsafe and infant formulas being safer is under question and the studies show that breast milk is the safest among all other milk sources. 

To Know More About Journal of Dairy & Veterinary Sciences  Please click on:
 
To Know More About Open Access Journals Please click on: ttps://juniperpublishers.com/index.php

Lower Psoas Muscle Area is associated with increased mortality after endovascular aneurysm repair in older adults - Juniper Publishers

  Gerontology & Geriatric Medicine - Juniper Publishers Abstract Lower Psoas Muscle Area is associated with increased mortality after en...