Friday, October 6, 2023

Environmental Effect of Oil Spillage and Cleanup on the Marine Environment in Selected Niger Delta Communities - Juniper Publishers

Environmental Sciences & Natural Resources - Juniper Publishers


Abstract

Oil spills have been recurrent and impacting damaging effects on the environment particularly within the oil-producing region. This research examines environmental effect of oil spillage and cleanup on the marine environment in selected Niger Delta communities. It seeks to assess how the federal government and the oil firms manage oil spill incidents and the degradation of environment brought about by the oil spillage. The results of the research have identified gaps and need for improvement to manage oil spills incidents to protect the environment. It has uncovered the need for the Nigerian environmental laws and policy to be updated. It is proposed that there is need for the government to set out strict obligation for degradation of the environment. The oil generating organisations in Nigeria should comply with international best practices in exploitation of oil and the Nigerian government should embrace different suitable technology for oil spill control as well as involving inhabitants of the Niger delta region in the management of oil spill.

Keywords: Oil; Spill; Environment; Marine; Niger delta

Introduction

Oil spillage is a global issue that keeps occurring since the discovery of crude oil, which was part of the industrial revolution. Through human activities, the total spillage of petroleum into the oceans, seas, and rivers is estimated to the range 0.7-1.7 million tons per year [1]. Oil spills have posed a major threat to the environment of the oil-producing areas, which if not effectively checked can lead to the total destruction of ecosystems [2].

One activity that has aroused considerable interest across the globe and especially in oil producing countries like Nigeria especially in the Niger Delta region is crude oil exploration. Crude oil exploration is one of such activity that can affect the environment negatively especially when accidents occur in operations resulting to spillage of oil. According to Egwu [3], one of the factors that cause discharge of oil to the environmental is the unethical engineering operations practiced by the industries involved [4].

The Niger Delta is among the ten most important wetland and marine ecosystems in the world. The oil industry located within this region has contributed immensely to the growth and development of the country which is a fact that cannot be disputed but unsustainable oil exploration activities have rendered the Niger Delta region one of the five most severely petroleum damaged ecosystems in the world. Studies have shown that the quantity of oil spilled over 50 years was at least 9-13 million barrels, which is equivalent to 50 Exxon Valdez spills [2].

The Exxon Valdez oil spill which occurred in Prince William Sound, Alaska, on March 24, 1989 with an estimated crude oil spill of 260,000 to 750,000 barrels and more recently the BP deep-water horizon oil spill on 20 April 2010 in the Gulf of Mexico caused by the explosion and sinking of the Deepwater Horizon oil rig are some examples of oil spill effect. It caused an oil discharge for 87 days with an estimate of the total discharge at 4.9 million barrels, [3]. As a result of lessons learnt from these and other oil spills, the prevention, response and management of oil spills is being given top priority worldwide especially in oil producing countries such as Nigeria in order to circumvent the economic and environmental hazards of an oil spill.

The recent Ogoni oil cleanup exercise due to an oil spill by Shell BP has its negative effect due to the harmful chemicals used in the process [5]. Spillage of oil from exploration activities has lead to massive environmental degradation in the past decades. Such problems include contamination of water bodies, danger to aquatic life, destruction of flora and farmlands which includes resort centers, destruction of properties, loss of lives and many more [6].

In addition, oil spillage and cleanup impacts to the environment can lead to unwanted migration of people as well as aquatic organisms from the areas. According to Nwilo & Badejo [7], the consequences of oil spill and cleanup is far-reaching as it impacts negatively on the economy of a region, pollutes water thereby health of the local community, and contaminates soils rendering it futile for farming apart from the reputation of the oil companies involved.

Literature Review

Egbe & Thompson [8] grouped the various causes of oil spills under eight headings as follow:

1. Blow Outs: Oil well blow out occurs when the well is not kept under control that is to behave in such a way that the hydrostatic mud head counter balances the formation pressure and prevents the formation fluid from entering the well formation during drilling operations.

2. Sabotage: When the cause of spill is mischievously deliberate and not accidental.

3. Corrosion: When the cause of leakage is rusty equipment.

4. Equipment Malfunction: Breakdown and failure of equipment are often the most frequent causes of separator and tank over-flow.

5. Operations / Maintenance Error: Bad oil operation practices like untrained personnel and lack of maintenance of the equipment.

6. Natural causes: Oil spillage: Oil spill could occur as a result of natural causes; they are causes which are not manmade or induced thus, occurring without any fault of man (Examples motion of tectonic plates, rain, flood, etc.).

7. Accident from third party.

Olukayode [9] identified the physical presence of the oil industry in Nigeria as so great and has resulted in a lot of actions in the upstream sector which has harmful effects on ecosystem stability and local biodiversity that the peoples‘ livelihoods depend upon. His work provided a general idea of environmental issues in the oil and gas industry in Nigeria with specific focus on oil spillage, he highlighted the best approaches to attaining high environmental performance in the oil and gas industry in Nigeria [10]. He used a comparative study approach on reports on the oil and gas industry report from Shell and Nigerian National Petroleum Company. He observed that oil spills occur more as a result of vandalization than rupture during operations.

Many scholars have specifically examined the effects of oil pollution on the environment both in Niger Delta and in West African coastal regions. Some of these studies concentrated on the identification of sources and their potential effects on the marine environment, ecosystem, etc, and other related papers have also dealt on marine pollution and the various sources. Some of these papers include the identification of identifying sewage, industrial effluents, plastics that float on water and abandoned objects other than vessel-based ones, as sources carried out by Elenwo & Akankali [11] and Okuma [12] on the effects of Marine Pollution on Nigerian Coastal Resources. From their work, the effects of these sources on the marine environment are degradation and thermal pollution which adversely affects the ecosystem, eutrophication from untreated waste that destroys marine organisms and plants and cause the depletion of dissolved oxygen that adversely affects Biochemical Oxygen Demand (BOD). Uyigue & Agho [13] and Badejo & Nwilo [14] in their separate research contributed to issues such as health and economic implications of oil spill, severe environmental damages, loss of mangrove forest, and other social factors as effect of spill-induced in Nigeria with particular reference to Niger Delta. Elenwo, & Akankali [11] identified sewage, industrial effluents, plastics floating on water and neglected objects other than vessel-based ones, as sources. According to them, the specific effects of these sources on the marine environment include degradation and thermal pollution which adversely affects the ecosystem, as well as eutrophication arising from untreated waste which can destroy sea animals, plants and causing the depletion of dissolved oxygen that affects Biochemical Oxygen Demand (BOD).

Kadafa, Zakaria & Othman [15] appraised the relevant laws in their studies organizational and institutional framework of oil spillage and pollution management in Nigeria (including international agreements) enacted by the government of Nigeria since 1963 which aim to mitigate the incidence of oil pollution. In addition, they also examined the relevant agencies established to implement procedures on oil pollution and management during oil prospecting/production activities. Also, Onyema et al. [10] posited that the provisions of Environmental Guidelines and Standard for the Petroleum Industry (EGASPIN) should be followed strictly to facilitate effective management of offshore E&P wastes in Nigeria as it is not in line with contemporary international standards as most of the parameters tested and analyzed are not within limit.

Nwokedi, Moses, Ibe & Onyemechi (2017) in their work on Economic Implications of Marine Oil Spill to Nigeria assert that they study adopted the natural resources damage assessment model, using data collected from the Nigerian National Petroleum Corporation (NNPC), the Organization of Petroleum Exporting Country (OPEC) and National Bureau for Statistics (NBS), they concluded that within the period covered in their study, 1984- 2012, the Nigerian economy lost an estimated 3,928,260,196 naira revenue due to oil spill which is not inclusive of remediation cost, third party costs and impact on the environment.

Also, that total of 1184 oil spill incidences led to the spill of total sum of 1,301,397.2 barrels of oil over the 29 years period and that average of 1099.153 barrels was lost per spill incident with an average economic loss of 3,317,787.3 naira per spill incident. Elei (2014) carried out research work on Illegal oil trading in Nigerian maritime industry and its impacts on the economy. He posits that most of the oil spill incidences are attributable to accidental discharge, others are operational discharge. He proved that illegal oil trading in the Niger Delta also contributes to oil spill leading, to economic losses and pollution of the Nigerian marine environment. Apart from the economic implications of oil spill, which is the central focus of this study, severe environmental damages, loss of mangrove forest, depletion of fish population, contamination of domestic and industrial sources of water, prevalence and promotion of spill-induced diseases and ill health, among are key observable impacts of oil spill, Michael & Hui [16] also provided these prove.

In view of the focus of this research work, the above reviews are limited and most of their findings are to a certain extent instructive and informative. For instance, the studies have established the oil pollution from various sources, the negative impacts on marine resources which affects the economy of littoral states [11] and (Umo, Nitonye 2015). Olukayode [9] identified the physical presence of the oil industry in Nigeria as so great and has resulted in a lot of actions in the upstream sector which has harmful effects on ecosystem stability and local biodiversity that the peoples’ livelihoods depend upon. This present study would specifically look at some communities in Warri south LGA of Delta State whose predominate occupation is fishing and farming, hence the need to explore the immediate and later effect of oil spill and clean up exercise in this area.

Materials and Methods

The applied model in this research implements both qualitative and quantitative data. This model was used in light of the fact that the research included exploring participants’ opinion towards issues of oil spill considering the causes and impact as well as the management of oil spill in the region. Qualitative data gathered were broken down and the quantitative information investigation comprised of enlightening details including associations amongst variables. The fusion of both research strategies gives a clearer understanding of the subject matter such as the causes, impacts and management of oil spillage in the Niger delta region of Nigeria.

The population of interest covered in the research involved affected community population both male and females and oil company workers with workplace in the region. The communities include the Kurutie, Okerenkoko, Oporoza, Ebimo, Ogbijaw, Gwangwe, etcetera, all in Warri south LGA.

The questionnaire was designed to meet the research objectives and the. The questionnaire consisted of the following sections:

1. Individual and occupation details.

2. Oil spill Awareness: these questions were designed to know the knowledge of oil spill (participant)

3. Causes and impact of oil spill: this aspect of the questionnaire is designed to identify the causes of oil spill and the impacts to the community.

4. Management of oil spill: the questions of this aspect was to identify the effectiveness of the management approach of oil spill by the locality.

5. Comments: this section is designed for respondents to make any comment or contribution for the research.

A total of 400 questionnaires were dispensed to the inhabitants of the Niger delta region in Nigeria. Out of the 400 questionnaires that were distributed, 376 were returned. Out of the amount returned, 6 were incomplete and 20 were blank indicating that the individual might have decided not to participate while 350 were fully completed.

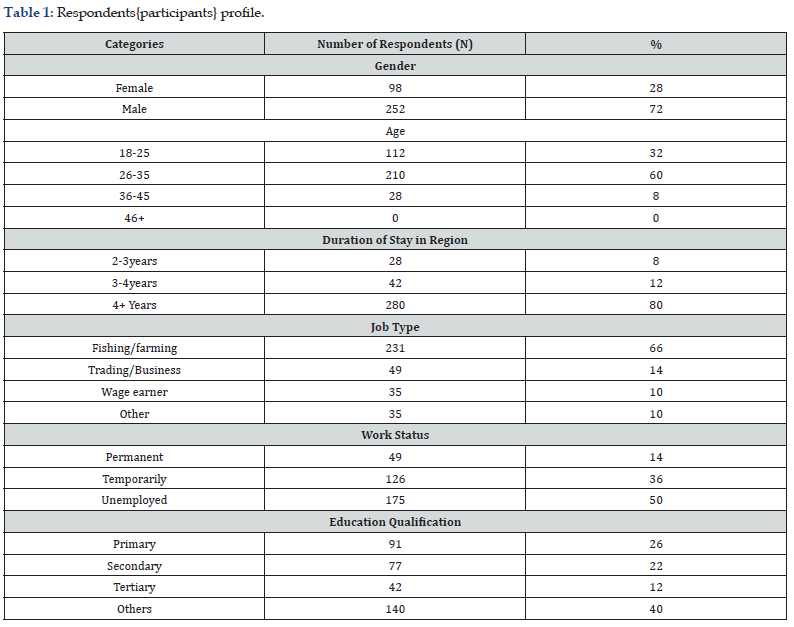
Table 1 gives a description of the attributes of the participants. The profile of the 350 individuals demonstrates that all respondents have stayed in the Niger delta region for at least two years.

72% (n=252) out of the aggregate respondents were male and 28% (n=28) were female. 32% (n=112) were matured individuals between 18 and 25 years of age; 60% (n=210) were between 26 and 35 years of age; 8% (n=28) were between 36 and 45 years of age; none was recorded for 46 years and over. As shown in table 1, a large volume of response obtained shows that 66%(n=231) of the total respondent’s fishers and farmers. This is closely followed by the trading/business with 14% (n=49), while wage earners are 10%(n=35) and other types of jobs 10%(n=35) respectively. These identified job types are in accordance with the literature as common job types of majorities of the Niger delta region inhabitants. The table also shows the education qualification and current work status of the respondents.
Awareness

The question in this sub sub-section is to ascertain the knowledge or understanding of oil spill incidents of the respondents. This is to identify whether the respondent is qualified to complete the survey for the research.

Knowledge of oil spill

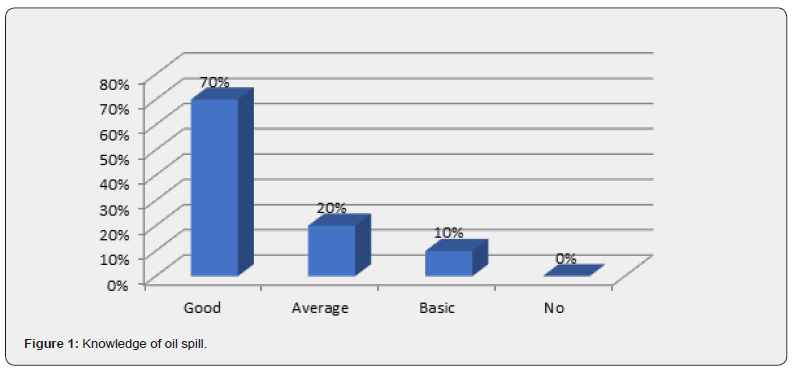
From the survey responses gathered, all respondents have knowledge of oil spill. 70% of the respondents indicated that they have a good knowledge of oil spill, while 20% have average knowledge of oil spill and 10% have just basic knowledge of oil spill as can be seen in Figure 1 below. This was necessary as to justify that the respondent have understanding of the subject and questions in the survey to be answered.

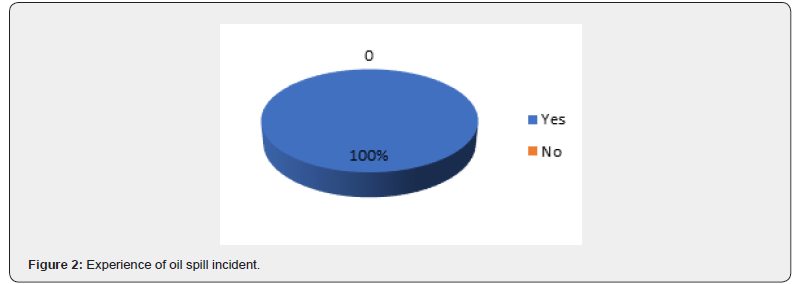
Additionally, the survey went further to find out how many respondents have experienced or witnessed oil spill incident. The outcome of this particular question was shocking as all respondents (100%) indicated that they have experienced oil spill occurrence. The interviews confirmed this as normal to the inhabitants in the region. This is because most of the pipelines for transporting extracted crude oil are suited along residential areas or beside the roads that can be easily sighted by people. As such it is easy for one to see oil spill occurring when incidents such as pipeline leakage occurs (Figure 2).
Number of Oil spill observed within the last 5 years (from 2018 to 2022)

This section seeks to identify the amount and then the rate of oil spill occurrence in the Niger delta region (Figure 3).
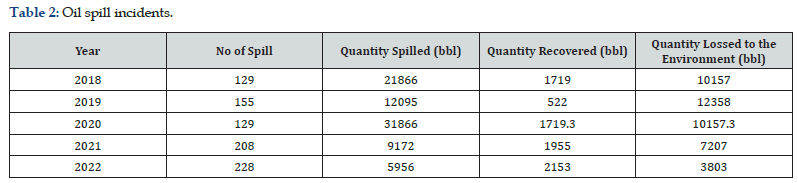
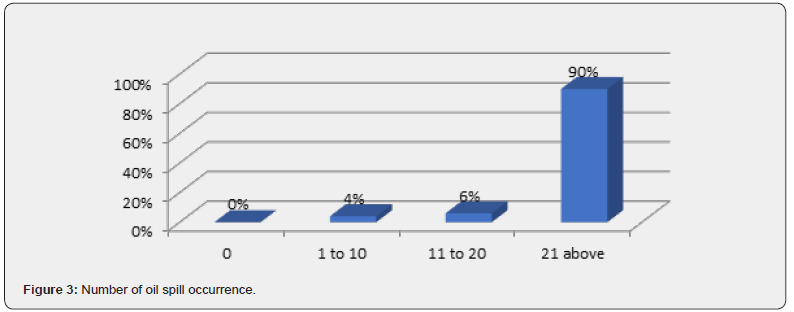
From the graph above 4% of the respondents indicated they have experienced 1 to 10 incidents within five years in the Niger delta region, 6% indicated that they have experienced about 11 to 20 oil spill incidents in their period in the Niger delta region while an enormous percentage of 90% indicated that they have experienced above 21 oil spill incidents within five years in the Niger delta. These results from the questionnaire survey can be verified from a data obtained from the Department of Petroleum Resources of Nigeria as can be seen below in (Figure 4) indicating the amount of oil spill occurrence in the Niger delta region in a particular period from 2019 to 2022. The outcome corresponds with finding in this research as respondents noted that oil spill incidents are enormous from the survey. The interview section also obtained same finding as the interviewees concluded that the rate of oil spill incidents in the region can be classified as high (Table 2).

Causes of oil spill

The research on this note seeks to identify the cause of oil spill in the Niger delta region especially regarding the amount and rate of oil spill occurrence in the region.

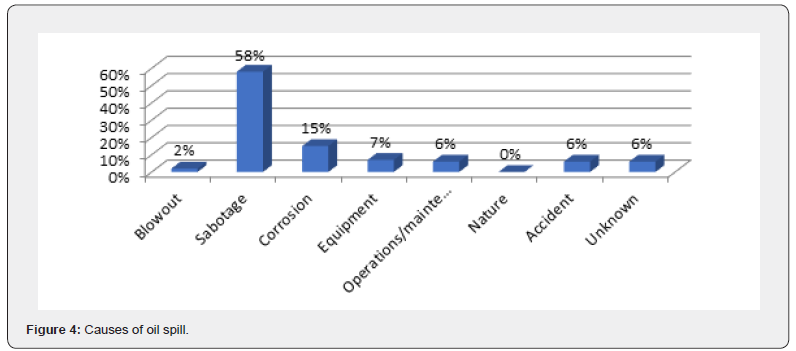
From Figure 4 above, it was gathered that the major cause of oil spill in the Niger delta region is the act of pipe sabotage. 58% of the respondents attributed the major cause of oil spill incident to Sabotage on a scale of 1 to 8 where 1 is the least cause of oil spill incident and 8 is the highest cause of oil spill incident in the region. The result also agreed with the literature as Egbe & Thompson [9] grouped sabotage as one of the causes of oil spillage in Nigeria oil producing area.

Factors responsible for the cause of oil spill

As gathered from the literature, the causes of oil spill are due to several reasons as such the survey seeks to identify the reasons for control where possible. The question for this section was grouped into 7 subjects to identify the reason or factors responsible for the cause of oil spill in the Niger delta region.

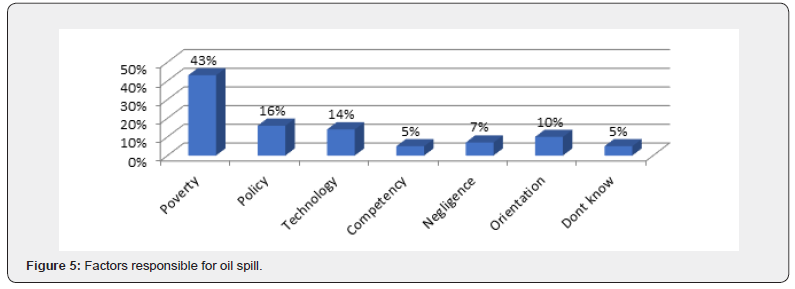
From Figure 5, the research gathered poverty to be the major factor responsible for the cause of oil spill. 45% of the respondents of the region inhabitants attributed the cause of oil spill to poverty while 16% and 14% of the respondents respectively indicated policy and technology as responsible factors leading to the cause of oil spillage. 4% of the respondents indicated competency in terms of personnel to conduct oil and gas operations in the area, while 5% indicated Negligence by responsible parties of the oil and gas sector in the region, and 10% attributed the cause to Orientation of people. From the interview section, Poverty was also gathered as the leading factor responsible for oil spill.
Impact of oil spill and oil spill cleanup

Oil spill cause pollution to the environment in several ways such as contamination of water or land pollution and can also lead to illness due to its chemical composition. This section of the questionnaire seeks to find out the impact of oil spill in the region, how it affects the inhabitants of the region and to what degree.

Amount of Inhabitants affected by oil spill

From the survey as detailed below in Figure 6, all respondents indicated that they have been affected by oil spill. This goes to mean that majority of the region inhabitants feels the consequence of oil spill in the region.
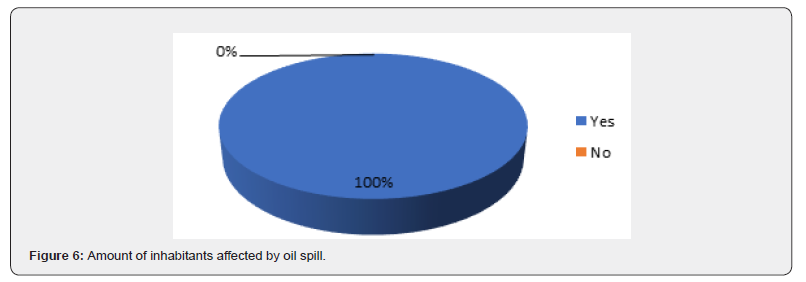
As seen from Figure 6, the survey went further ahead to find out if the region has been affected in one way or the other by oil spillage.100% of the respondents indicated that there have been in one way or the other affected by oil spillage incident.

Main areas affected by oil spill

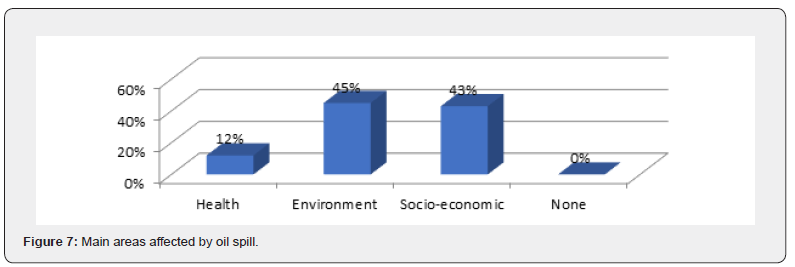
As gathered from the above sub-section in Figure 7, all respondents indicated to them felt the consequence of oil spill. The survey then went further to find out what has been affected mainly in the area and life of the inhabitants. The outcome is detailed in the graph below (see Figure 8).

From Figure 7, majority of the respondents indicated that the environment has been mainly affected. This is obvious as majority of the habitants in the Niger delta region are farmers and fishermen. More so this is evident in the literature review where Badejo & Nwilo [17] stated 48% of the occupation in the Niger delta is agriculture and fishing, this in turn affects the economy of the region. Businesses like restaurants and hotels face decline in profits as oil spill incidents leads to low turn up of tourists. This is due to the pollution of the beaches and reserves from the oil spill. This coincides with the literature research from ITOPE (2009), which noted that oil spill pollution of land and water leads to interference and loss of recreational activities such as diving and sporting events. Businesses that make use of the rivers and sea for their normal operations can also be adversely affected by the oil spill. Health of the inhabitants was also indicated has been affected by oil spill but not as the major concern as discovered by this research.
Duration of oil spill impact

Oil spill impact can be quite devastating to the environment, economy and health of persons in a particular region. In this section, the research seeks to find out the duration of the oil spill impacts to the Niger delta region for management improvements. From the survey, it was gathered from majority of respondents that the consequence of oil spill incidents in the region can take above six months on most occasion before controlled while only 1% indicated it takes between three (3) to six (6) months to stop or control oil spill impacts and none indicated less than 3 months.

From this section, it can generally be seen that majority of the respondents have been affected by the impacts of oil spill and these impacts can be rated high due to the quantity of barrels spilled and rate of oil spill incidents and even more the duration it takes to control majority of incident/impact. The oil spill incident has affected the environment, socio-economy and health of person residents in the region but has mainly affected the regions environment.

Conclusion and Recommendations

Oil spillage has had a major negative impact on the citizens of Nigeria, and the economy as a whole. An illustration of this can be seen in the friction caused between the oil producing/servicing companies and resident communities resulting in frustrations, finger pointing, clashes, general resentment and mistrust.

The cause of oil spill can lead to very disastrous situation as such should be treated as national emergency by the Nigerian government whenever it occurs. Not just because this is the case in other oil producing zones of the world but because it is the responsible thing to do. Now, the Nigerian oil industry is to a large extent dependent on foreign experts, international oil companies and other foreign organizations for spill management. This approach cannot add local content value with regards to the development and transfer of relevant technology and only degrades the country’s ability to deal with oil spills promptly and effectively. Well-developed spill management must involve expanded local knowledge of spills and a clear national spill contingency plan, provision of trained personnel and massive investment in response/clean up assets, equipment and technology.

a) The public or inhabitants (Farmers, Traders, women groups, school children and the youths) of the Niger delta should be enlightened on the negative effects of pipeline sabotage on the.

b) Adequate technologies for oil spill should be embraced without delay by oil operators in the Niger delta region.

c) The Nigerian government should continuously employ and train personnel at all levels for oil spill emergencies.

d) The oil organization should have free emergency national numbers in place this way the habitants in the region can call when there is an event of an oil spill.

e) The emergency responses procedures should be designed to swiftly take measures to protect the safety of the public, employees and the environment.

f) Without delay the Nigerian Government should implement effective national oil spill contingency plan at State and Federal levels for effective control of oil spill incidents in the Niger delta region.


Click here:  https://juniperpublishers.com/ijesnr/index.php


To Know more about our Juniper Publishers

Click here: https://juniperpublishers.com/index.php

Thursday, October 5, 2023

Waterlogging Effects in Adventitious Roots, Tillering and Yield of Bread Wheat Germplasm - Juniper Publishers


Agricultural Research & Technology: Open Access Journal - Juniper Publishers


Abstract

In the context of climate changes, expected increases in intensity, frequency, and unpredictability of waterlogging events will aggravate wheat yield losses, currently estimated to range between 20-50%. Wheat production must fulfill ca. 20% of the population’s energy and protein requirements. Evaluating germplasm with different backgrounds may reveal variability for waterlogging tolerance, allowing a better selection of genotypes with desirable traits for wheat breeding programs. In this work, the effect of waterlogging on adventitious root emission, tiller survival and yield was evaluated. Five studied germplasm groups (Portuguese Landraces; Varieties with introduced Italian germplasm; Post-Green Revolution varieties with introduced CYMMIT germplasm; Advanced Lines from the Portuguese Cereal Breeding Program; Australian varieties) were studied. Groups exhibited intra and intervariability in all parameters in response to waterlogging imposed in climatized growth chambers. After 14 days of waterlogging, the number of adventitious roots ranged from 0 to 7.6 plant-1, with 4 Portuguese Landraces depicting the highest number. The number of living tillers at the end of the stress was highly variable, ranging from reductions of 100% to increases up to 35%. At harvest, the number of productive tillers significantly differed among genotypes, with reductions reaching 100% in some cases and increases up to 138% in others. The existence of variability and the identification of key traits underlying waterlogging tolerance will contribute to develop more adapted wheat plants and to improve wheat yield.

Keywords: Triticum aestivum L.; Portuguese Landraces; Australian varieties, CYMMIT germplasm; Advanced lines; Tillers; Excess water; Waterlogging

Abbreviations: AdvL - Advanced Lines from the Portuguese Wheat Breeding Program; AR - Adventitious roots; Austrl - Australian varieties; CP - Main culm; GR - Post-Green Revolution varieties with the introduction of CYMMIT germplasm; IT - Varieties with the introduction of Italian germplasm; K nº - Kernel number; Pl - Plant; PL - Portuguese Landraces varieties; Prod - Number of productive tillers at the end of the growth cycle; Prod/Max - Ratio between Number of Productive tillers and Maximal number of emitted tillers; SKW - Single kernel weight; T - Tillers; T0 - beginning of waterlogging treatment; T2 - 2 days of waterlogging treatment; T4 - 4 days of waterlogging treatment; T7 - 7 days of waterlogging treatment; T7R - 7 days of recovery; T14 - 14 days of waterlogging, end of waterlogging period; T14R - 14 days of recovery; WL - plants subjected to 14 days of waterlogging; WW - control plants

Background

As a result of climate change, the increased instability of rainfall regimes raises the incidence of waterlogging events [1-3]. Such stress currently affects 10 to 15 million hectares of wheat-growing land, undermining food security as a result of substantial yield losses (20 to 50%) [4]. This may compromise approximately 20% of the world’s protein and energy needs, actually ensured by wheat [5]. Waterlogged soil undergoes significant changes in its chemical properties [6-8]. As the soil pores fill with water rather than the gas phase, oxygen concentration is reduced which is exacerbated by the drastic reduction of gas exchange between the soil and the atmosphere [8,9]. The remaining oxygen trapped in the soil is rapidly consumed by root respiration and by microbial activity in rhizosphere, resulting in hypoxia or even environmental anoxia. Oxygen concentration is inversely proportional to the Redox potential (Eh) value [10], and a waterlogged soil typically displays a decrease in its Eh. According to [11], a soil with an Eh close to 0 mV will have an oxygen concentration of approximately 1%, leading plant roots to switch from aerobic to anaerobic metabolism [8-11]. Thus, roots are the first plant organs to be affected by hypoxia and anoxia due to waterlogging; resulting in impaired root functioning and detrimental effects in shoots [12]. Waterlogging susceptible wheat genotypes frequently exhibit severe metabolic constraints and growth arrest, enhanced leaf/ organ senescence, decreased accumulation and remobilization of photoassimilates, and, reduced production [13-15]. The decrease in yield is related with the number of kernels plant-1, spikes plant-1, kernels spike-1, and the weight of a single kernel, which is reflected in the thousand kernel weight.

Survival and development of tillers, as well as the ability to produce new ones, are crucial traits in plants subjected to waterlogging since they are directly proportional to the number of spikes per area unit [16], with a direct effect on final yield [17]. Although a decrease in the number of emitted tillers occurs in some varieties, this does not always reflect a decrease in fertile ones, indicating some capacity to maintain production in an energy deficit situation [17-19]. Nonetheless, the preservation of the number of fertile tillers does not guarantee the maintenance of yield, as their contribution to the final yield may be affected [16]. Several studies indicate that yield reduction due to waterlogging is associated with low tillers survival [20-22] reduced fertile tillers, and reduced kernel size [15,17]. The formation of adventitious roots in response to waterlogging may be a strategy to reduce oxygen deficiency, as these roots facilitate gas transport between submerged tissues and the aerial portion of the plant. In addition, these morphological adaptations play a decisive role in nutrient and water uptake during waterlogging, significantly contributing to survival [8,23] and to maintain productivity. The selection of potential progenitors in breeding programs largely depends on the evaluation and understanding of the existing genetic variability [24,25]. Screening genotypes with distinct genetic origins may provide the genetic diversity required for breeding aiming to achieve crop yield stability and resilience in adverse environments [26,27]. To understand the relationship between the effects of a stress and its impacts on plant development, studies conducted under controlled conditions provide the most reliable and reproducible results [28].

The aim of this work was to evaluate, under controlled conditions, the effect of 14 days of waterlogging on bread wheat (Triticum aestivum L.) germplasm with distinct genetic background. In each genotype, the effect of stress on adventitious root formation, the number of surviving tillers during stress, after recovery (7 and 14 days), and the fertile tillers obtained at the end of the growth cycle, were evaluated. Final yield, kernel number, and single kernel weight, were also evaluated per genotype, as well as the contribution of the main culm and tillers in final yield. Considering germplasm groups, the possible relationships between the analyzed parameters were studied, along with the interactions between the ability to emit adventitious roots and the effects on the analyzed traits. The existence of variability and the identification of key traits underlying tolerance to waterlogging will contribute to develop more adapted wheat plants and to improve wheat yield under a changing climate.

Materials and Methods

Wheat germplasm

The research focused on 23 wheat genotypes (Triticum aestivum L.) from different origins and belonging to distinct evolutive or breeding groups (Table 1): five Portuguese Landraces (PL) from Vasconcellos ancient collection [29]; four varieties released between 1950-1970 with introduced Italian germplasm (IT) [30]; four Post Green Revolution varieties released between 1980-1989 with the introduced CIMMYT germplasm, according to Almeida (2016) [30]; five Advanced lines from the Portuguese Cereal Breeding Program (INIAV, I.P.) and five varieties from Australian germplasm (Austrl). Certified seeds of each genotype were provided by the Portuguese Cereal Breeding Program (INIAV, Elvas, Portugal). Since limited amounts were available, seeds were multiplied prior to the experiment, to ensure uniform germination capacity (100%, results not shown) and adequate vigor of plant material. This step was performed in growth chambers (Fitoclima 10000 EHHF, ARALAB, Portugal) under identical conditions of temperature (22/15 oC, day/night), irradiance (ca. 800 μol m-2 s-1), relative humidity (70/75%, day/night), photoperiod (14 h), and CO2 (400 μL L-1) in 5 L pots with field-collected loamy clay soil.

1CIMMYT material; 2Australian × Italian; 3Australian × Portuguese

Growth conditions

Approximately 120 seeds from each genotype were soaked in water, placed on moist filter paper in Petri dishes (Figure 1A) and kept at room temperature until the radicle and the first two lateral seminal roots emerged (Zadoks scale 05 to 06, Z05 to Z06) [31] (Figure 1B). The newly germinated seeds were then placed at a depth of 2 cm (Figure 1C) with the germ end facing down, in 5L pots (7 seeds per pot) filled with sieved loamy clay soil. For each genotype 12 pots (6 for control plants and 6 for waterlogged plants) were prepared. Plants were grown in walk-in growth chambers (EHHF 10000, ARALAB, Portugal), under controlled temperature (22/15 °C, day/night), irradiance (ca. 500-600 μmol m-2 s-1), relative humidity (75%), photoperiod (14 h) and CO2 (400 μL L-1) and maintained with a field capacity of ca. 85% except in stressed plants during the waterlogging period. The plants were fertilized weekly with 250 mL of a 12% N, 4% P, and 6% K solution (Complesal, Bayer), except during waterlogging, the weeks immediately preceding and following stress, and the final stages of maturation.

Waterlogging imposition

When plants reached the tillering stage (Zadoks scale 22 to 25, Z22 to Z25) [31], half of the pots were kept at ca. 85% field capacity (control plants, WW) and the other half were subjected to waterlogging (waterlogged plants, WL). This was accomplished by placing pots in plastic containers and flooding them until a water layer of ca. 0.5 cm was formed above the soil surface. Daily, water was added with care in order to maintain the water layer without incorporating air. After 14 days, the water stress was suspended by removing the pots from the boxes and maintained in the same conditions as WW plants until harvest.

Soil Redox Potential (Eh)

Soil reduction-oxidation potential was measured in 1 pot of each genotype in each treatment, at the beginning of waterlogging (T0), after 24 h (T1), at 7 days of waterlogging (T7), at the end of the stress period (T14) and after 7 and 14 days of recovery (T7R and T14R, respectively). A portable Eh meter (XS-Instruments, ORP-5, Italy) was used and measurements were performed at 6 cm deep and the value registered after its stabilization (ca. 15 minutes).

Plants Evaluation and Measurements

Adventitious roots

The number of adventitious roots was determined by examining every plant in every pot at 2, 4, 7 and 14 days following the onset of waterlogging (T2, T4, T7 and T14, respectively).

Number of tillers

The amount of living tillers was counted at T7, T14, T7R and T14R in 18 plants per treatment. At the end of the growth cycle, the number of productive tillers (Prod) was also obtained.

Yield

The impact of 14 days waterlogging in yield (g plant-1) was evaluated in plants subjected to this stress as % of control plants at the end of growth cycle. Plants were harvested and the productive spikes counted and individually threshed.

Statistical Analysis

Data were analyzed using a two way ANOVA to evaluate the differences between water treatments (WW or WL), between time of treatments (T0, T2, T4, T7, T14, T7R, T14R and FC), and their interaction, followed by a Tukey’s test for mean comparisons. A 95% confidence level was adopted for all tests, which were performed independently for each genotype using the software PAST - Palaeontological Statistics software, version 3, University of Oslo, Norway. For Pearson correlations, the same software was used.

Results

Soil redox potential

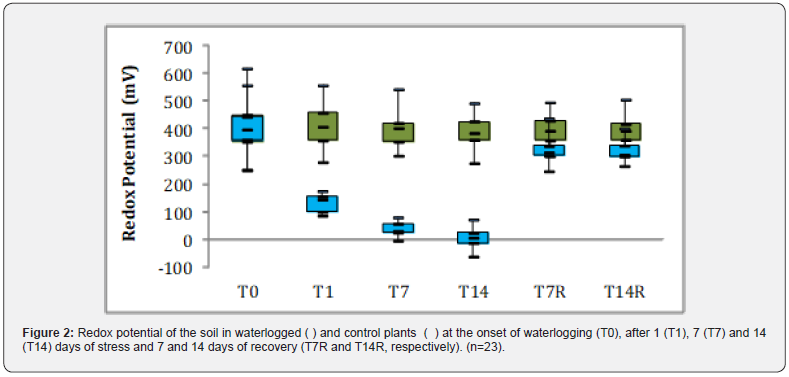
No differences in Eh values were observed between WW and WL pots immediately prior to the imposition of waterlogging (T0). In the pots that remained at ca. 85% field capacity, no changes were observed between the observed periods (T0 to T14R) with average values of ca. 400 mV, which is considered an ideal value for plant development (Figure 2). In contrast, in the flooded pots an abrupt decrease of Eh (due to the depletion of oxygen), was observed earlier at T1, which was accentuated (although in a softer way) in the following days, reaching minimum values close to 0 mV (even negative in some pots). With waterlogging suspension and the re-entrance of oxygen into the soil, Eh values rose, approaching the values of WW pots after 7 days of recovery (Figure 2).

Adventitious roots

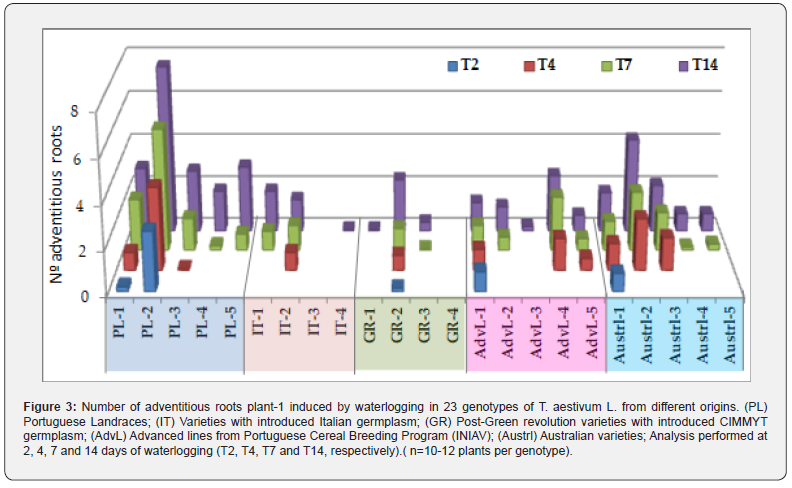
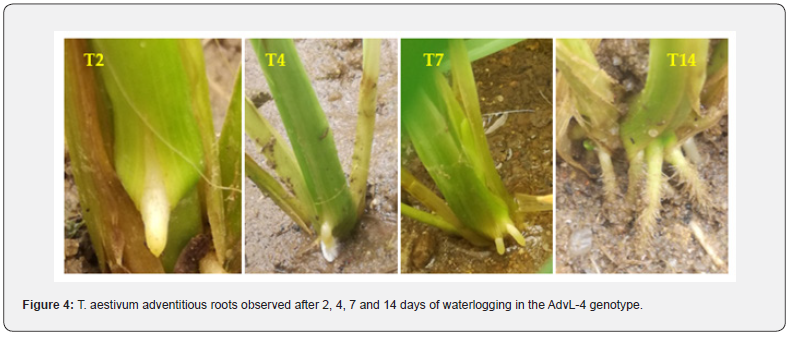
Considering all genotypes, no adventitious roots (AR) were observed in plants grown under control conditions. However, in plants subjected to waterlogging considerable heterogeneity was detected within genotypes in each group, as well as between genotypes of the same group (Figure 3). With the exception of the IT varieties, an early response (T2) in AR formation was observed in some genotypes of the remaining groups (PL-1, PL-2, GR-2, Austrl-1, Austrl-2, Austrl-3, AdvL-1, AdvL-4 and AdvL-5.) (Figures 3 & 4). In contrast, AR were not formed in some genotypes (IT-3 and GR-4) or exhibited a very small number (IT-4, GR-1, GR-3 and AdvL-3) at the end of the stress treatment (T14).

Across all analyzed WL periods, the PL-2 displayed the highest number of AR per plant in comparison to the remaining genotypes. At the end of the WL period (T14), this genotype presented a value of 7.6 while a set of genotypes ranged from 4-2: Austrl-2 (4.3), PL-1 (3.6), PL-5 (3.3), PL-3 (2.9), AdvL-4 (2.6), GR-2 (2.4) and Austrl-3 (2.1). Another set showed values below 2 AR per plant (PL-4, IT-1, Austrl-1, IT-2, AdvL-1 and AdvL-2) Nine genotypes exhibited less than one AR per plant; Austrl-4, Austrl-5, AdvL-5, AdvL-3, GR-3. IT- 4, GR-1, IT-3 and GR-4, displayed values close to or equal to zero.

Tillers number and fertility

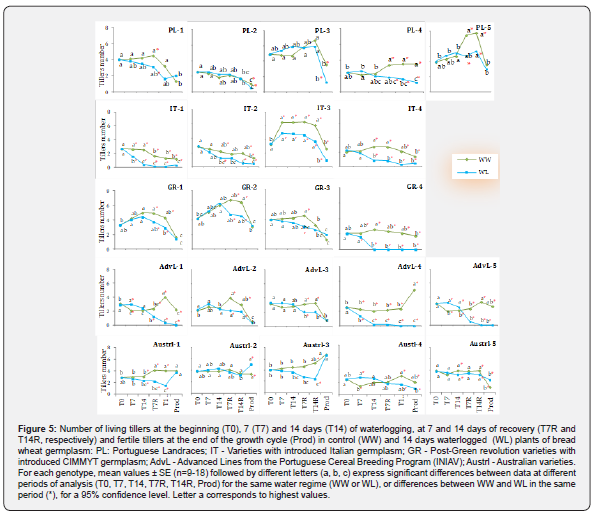
At the imposition of water treatment (T0), WW and WL plants of all genotypes were in a similar phenological stage (Figure 5), presenting 2-5 tillers (Z22-Z25) [31]. Regarding WW plants, a great variability was observed in the average number of tillers throughout the growth cycle (Figure 5). Although all plants of each genotype had the same number of tillers at T0, there was some variation in the tillers’ ability to survive, in plants capacity to emit new tillers, as well as tillers fertility at harvest (Prod). At T7, the number of living tillers ranged from 1.4 to 6.5, indicating either the loss of some tillers (as in Austrl-4, AdvL-1 and AdvL-5) or, in other cases, the progression of tillering (as in IT-3). This pattern (reduction or increase in the number of tillers when compared to T0) was observed in all germplasm groups throughout observations conducted until the end of the growth cycle (T7, T14, T7R, T14R, and Prod), with Prod corresponding to grain maturity of productive tillers (Figure 5). Among germplasm groups, at T7, the lowest value was found in Austrl while the highest in the IT group. At T14 the number of tillers barely changed when compared with T7. As the growing cycle progressed (T7R and T14R), both the lowest values (1.3-1.7) and the highest values (7.4-7.7) remained stable, with the first being found in the IT group and the latter in the PL group. At harvest, there was variability in the number of productive tillers between genotypes from distinct or the same germplasm group. Prod values ranged from 0.5 to 1.9 for 12 genotypes and from 2.0 to 4.0 for 10 genotypes, from the 5 studied germplasm groups. Only AdvL-4 and Austrl-3 presented more than 4 tillers (4.9 and 6.8, respectively). In contrast to Austrl-3, which displayed the highest Prod value, AdvL-2 showed the lowest value (0.5).

After 7 days of waterlogging (T7), the number of living tillers in WL plants decreased in IT-1 (38%) and AdvL-4 (43%) (Figure 5), resulting in differences between WW and WL plants with reductions in IT-1, IT-3, GR-4, AdvL-3 and AdvL-5, while Austrl-4, AdvL-1 and AdvL-5 exhibited the opposite response with raises by 35, 43, and 61%, respectively. At the end of waterlogging (T14), AdvL-5 was the only genotype presenting an increased number of tillers (24%) in WL in relation to WW plants, in spite of 19% (not statistically significant) decrease in WL plants between T7 and T14, denoting the death of tillers as waterlogging progress. Despite some variations in the number of tillers, no waterlogginginduced differences appeared in PL genotypes during this phase. In contrast, the number of tillers decreased in all genotypes of the IT group (27% to 84%) as well as in Austrl-1 (23%) and Austrl-5 (18%). At T14, GR-4 presented no living tillers and AdvL- 4 presented a 90% reduction when compared with WW plants (Figure 5).

The largest differences between WW and WL plants were observed after 7 (T7R) and 14 (T14R) days of waterlogging suspension. At T7R, 17 of the 23 genotypes significantly reduced the number of tillers (24-100%) whereas at T14R, 18 genotypes presented reductions between 18-100% (Figure 5). At T7R, WL plants of the genotypes PL-2 and PL-3, IT-2, Austrl-2, Austrl-4 and Austrl-5 had identical values to WW, while at T14R, there were no differences between WW and WL in PL-1, PL-2, PL-3, in the genotype GR-3, and in Austrl-2. At the end of the growth cycle, some genotypes exhibited differences in the number of kernelproducing tillers (Prod) (Figure 5). In the first group, PL-1, PL-2 and PL-5 were unaffected by waterlogging, whereas PL-3 and PL-4 showed 64 and 66% reductions, respectively. All of the genotypes with Italian germplasm introduction were severely impacted by water stress, with decreases of 68-88%. After recovery period, GR-4 was the only genotype in its group to exhibit differences in WL plants. All tillers died at T14 and it was unable to recover and produce new tillers by the end of the cycle. Among the Australianorigin germplasm, Austrl-1 and Austrl-3 were able to recover from the damage suffered in T14 and during the recovery period, displaying the same number of Prod tillers as plants not subjected to waterlogging. The genotype Austrl-4 was negatively affected with a 55% decrease in Prod tillers, while Austrl-5 and Austrl-2 showed an increase of 144% and 52%, respectively (Figure 5). These two varieties were the only to exhibit this behavior among the germplasm of the 5 groups under study. Similar to GR-4, the AdvL-1, AdvL-4 and AdvL-5 did not recover and exhibited no Prod tillers by the end of the growth cycle (Figure 5). The remaining genotypes of this group did not differ in the number of Prod tillers between WW and WL plants.

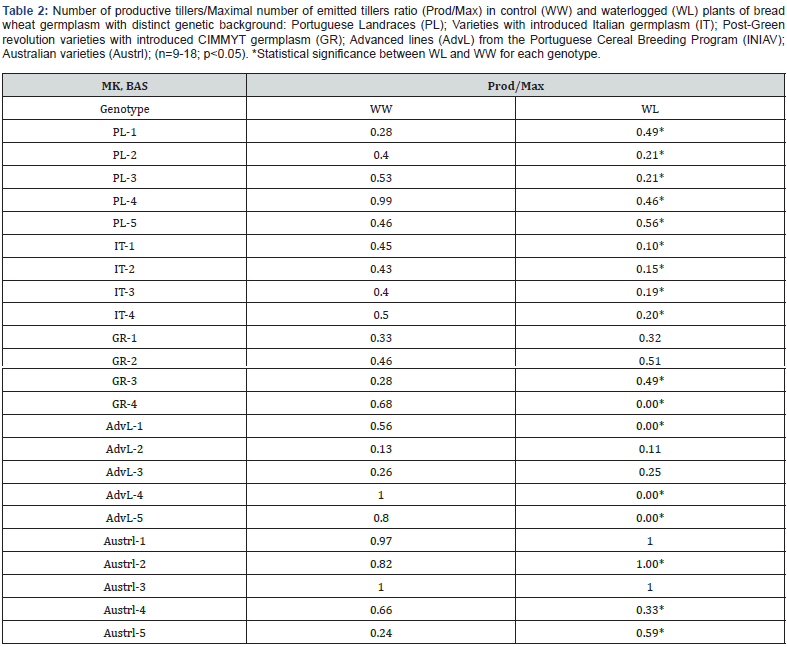
Considering that more tillers may result in more spikes at harvest and that there were differences in tillering capacity among the genotypes under study, we investigated whether waterlogging contributed to changes in the Number of productive tillers/ Maximal number of emitted tillers ratio (Prod/Max) (Table 2). In addition to the observed variability in the number of tillers, the Prod/Max ratio exhibited differences among genotypes and within each germplasm group, for both WW and WL plants (Table 2). In WW plants, PL-4, AdvL-4, Austl-1and Austrl-3 showed values of 1.0 or very close to it, while in 14 of the remaining genotypes, this ratio was ≤0.5 (Table 2). As a result of waterlogging, Prod/Max ratio decreased significantly in 12 genotypes, reaching 0 for GR-4, AdvL-1, AdvL4 and AdvL-5. In contrast, this ratio increased in 5 genotypes (PL-1, PL-5, GR-3, Austrl-2 and Austrl-5), but was not affected in seven genotypes, including the two Austrl (Austrl-1 and Austrl-3) with a ratio ca. 1.0 in WW plants.

Grain yield

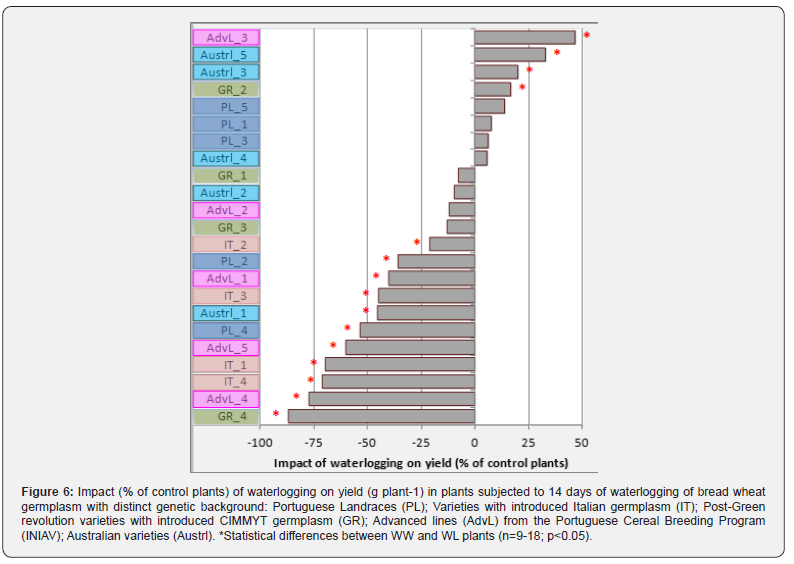
The majority of genotypes exhibited changes in yield due to waterlogging (Figure 6). The genotype GR-4 was the most affected, with an 87% reduction in yield, followed by AdvL-4 (77%). With the opposite trend, AdvL-3 and Austrl-5 increased by 47 and 33%, respectively, in response to waterlogging. Yield was negatively affected by stress in the five groups (21 to 87% reductions occurred in 11 genotypes), but the incidence was highest in the IT group, where all genotypes showed yield decreases (21 to 71%). Due to waterlogging, decreases, increases, and even no changes were observed in the remaining groups (Figure 6). Yield decreases appear to be related with the observed reduction in the number of fertile tillers, but only in 8 of these genotypes. In the remaining 3, decreased fertile tillers did not influence final harvest (Figure 6).

Grain yield

The majority of genotypes exhibited changes in yield due to waterlogging (Figure 6). The genotype GR-4 was the most affected, with an 87% reduction in yield, followed by AdvL-4 (77%). With the opposite trend, AdvL-3 and Austrl-5 increased by 47 and 33%, respectively, in response to waterlogging. Yield was negatively affected by stress in the five groups (21 to 87% reductions occurred in 11 genotypes), but the incidence was highest in the IT group, where all genotypes showed yield decreases (21 to 71%). Due to waterlogging, decreases, increases, and even no changes were observed in the remaining groups (Figure 6). Yield decreases appear to be related with the observed reduction in the number of fertile tillers, but only in 8 of these genotypes. In the remaining 3, decreased fertile tillers did not influence final harvest (Figure 6).

Genotypes that responded to stress with an augmented number of fertile tillers showed a high yield, such as in Austrl-5 (47% yield increase), whereas the higher number of productive spikes in IT-2 was accompanied by a 21% decrease in yield (Figure 6). Among the three genotypes that recovered from severe tillers mortality induced by waterlogging and in the 14 days that followed, different yield results were observed. So, and despite having the same number of fertile tillers as the WW plants, Austrl- 1’s yield was reduced by 45%. In contrast, GR-2 was able to achieve a 17% increase (Figure 6). For genotypes that showed no change in the number of living and fertile tillers, there was also important variability in yield (Figure 6). In contrast to the increases observed in AdvL-3 (47%) and Austrl-3 (33%), PL-2 experienced a 36% decrease in yield despite a stable number of tillers. For PL-1, PL-5, GR-1, and AdvL-2, maintaining the number of tillers also resulted in an unchanged yield (Figure 6).

Discussion

Root features determine plants ability to absorb water and nutrients for their growth, development and grain production [8,32,33,34]. Adventitious roots play a crucial role to overcome nutrient deficiency, providing an increased capacity to adapt to different environments [35,36]. Given that a greater number of adventitious roots may help the plant above-ground portion to better cope with the negative effects of waterlogging [37], tolerance seems to be closely linked to the ability to generate these roots [38]. In response to waterlogging, PL and Austrl varieties, considered the most tolerant among the tested germplasm, exhibited the largest number of adventitious roots (AR). The PLs exhibit the genetic heterogeneity of regional varieties [30] and are part of a wheat germplasm collection [29] that had been grown for generations in Portugal. These locally adapted cultivars are considered a valuable source of variability for breeding programs [27]. As the root system plays a major role in waterlogging conditions, landraces appear to be a solid option for selecting and crossing parental genotypes depicting beneficial root features, aiming the obtention of more adapted ideotypes [27]. In PLs, the ability to emit AR was accompanied by heterogeneity among varieties, both in the number of AR and in emission precocity. This heterogeneity is expected in landraces [27] and constitutes an asset for breeding programs. In Portugal, wheat breeding program has gone through several phases. Between 1950 and 1968, the introduction of Italian germplasm (IT Group) led to the release of the 1st Portuguese variety (Pirana, IT-4). Since the early 60’s a strong cooperation with CYMMIT led to the introduction of germplasm with dwarfism (Rht) genes. Observing also the current advanced lines from the Portuguese Cereal Breeding Program, apparently wheat genetic improvement has not led to a loss of variability in plant root characteristics, namely in root growth angle [33] or the ability to emit adventitious roots in response to waterlogging, as suggested by the results of this study. The observed genotypic variability in AR emission is in agreement with reported results, where wheat sensitive varieties to waterlogging had fewer AR than those tolerant to this stress [32,39].

Regarding tiller number, waterlogging generated decreases (although at different times) in all genotypes, except for PL-1 and Austrl-2, which remained stable. This reduction is consistent with results reported by several authors [17,19,32,40,41,42,43]. However, variability in response to waterlogging was observed. Some genotypes showed an early and strong tiller growth arrest at T7, extended until harvest (IT-1, IT-3, GR-4, AdvL-4), causing severe yield decreases and denoting no tolerance to waterlogging. Other genotypes showed a similar pattern but only from T14 onwards, namely IT-2 and IT-4. Results indicated that all genotypes of IT group were affected with significant reductions in yield (21-71%). With the end of waterlogging, 20 genotypes displayed decreased tillers number at recovery (T7R and/or T14R), suggesting a deleterious effect when oxygen availability is reestablished. This might cause the formation of reactive oxygen species (ROS) due to O2 re-entry in plant tissues, leading to cell membrane damages [40].

In wheat, tillering can occur during the entire growth cycle [44]. In this study, 6 genotypes (PL-1, PL-2, Austrl-1, Ausrl-2, Austrl-3 and Austrl-5) were either unaffected or were able to generate new tillers, achieving values comparable to those of the control plants, or even higher, at the end of growth cycle. According to Xie (2016) [45], tillering ceases just prior to elongation and the remaining axillary buds become dormant. This dormancy, however, can be reversed in response to damage to the main shoot or lodging [46], which is consistent with the observed results and point to some genotypic variability regarding recovery ability following waterlogging Decreased tillers viability may also result from nutrient resources remobilization from late tillers to primary tillers [47]. Additionally, tillers can serve as reservoirs of assimilates for the main culm during growth cycle [48]. This might explain the low tillers value observed in some genotypes (e.g. AdvL-2), reflecting the death of the majority of tillers even under controlled conditions and an emphasis on the main culm’s major contribution to the final yield. Thus, the number of tillers is not necessarily an indicator of fertile spikes being produced. Regarding the Number of productive tillers/Maximal number of emitted tillers ratio (Prod/Max) found for control plants, values are consistent with reports from several authors, who described average mortality rates of 10-80% of all initiated tillers [45,49,50]. Waterlogging strongly influenced the Prod/Max in some genotype, which reached zero in 4 genotypes, reflecting the mortality of all emitted tillers, or values ≤0.5 indicated that half or less of the produced tillers reached maturity, with drastic repercussions on yield. Many studies reported reductions of up to 66% of tillers at maturity when waterlogging was imposed at tillering stage [18]. Among germplasm considered in the present work, several genotypes displayed an increased or unchanged Prod/Max ratio, denoting a good capacity to invest in fertile tillers, even under adverse conditions. Robertson (2009) [19] reported that under waterlogging imposed at tillering, some genotypes reduced the number of initiated tillers, although at maturity presented similar values to WW plants. On the other end, some genotypes started emitting new tillers when waterlogging ended [32].

Yield losses in waterlogged plants ranged from 21% to 87%, which is consistent with values from other studies (ca. 30% to 90% decreases), namely on wheat [18,40,44,51,52,53,54]. Such reductions were observed in 11 genotypes and appear to be closely linked to all tillers death (GR-4, AdvL-1, AdvL-4 and AdvL- 5) or decreased tillers survival. Several authors observed yield reductions under waterlogging as a result of low tiller survival [15,17]. In addition, fewer kernels per spike [19,41,43,55,56] and smaller tillers and kernels [20,21,22], can also negatively affect final yield [16] and must be addressed in future work. The present results highlight 4 genotypes with yield increases in waterlogged plants and 8 that were unaffected by stress. Tian (2021) [57] reviewed the overall change in crop yield induced by waterlogging in 115 studies and found that this stress can increase, decrease or maintain crop yield. They also suggested that this could be due to differences in crop varieties tolerance or sensitivity to shorter/ prolonged waterlogging periods.

This study in bread wheat revealed significant variability in the number and precocity of adventitious roots formed in response to waterlogging, as well as in tillering survival and emission capacity. Such variability was reflected in the observed different yield changes due to 14 days of stress imposed at tillering stage. Differences between germplasm groups from different origins, and within groups, may be a source of genetic material to develop new varieties with distinct root system morphologies, to address climate change-related issues.

Conclusion

Wheat tolerance to abiotic factors is a very important breeding objective under changing climate. This study highlighted variability in adventitious roots (AR), number of tillers and yield in response to waterlogging at tillering stage, in 23 bread wheat genotypes with different genetic backgrounds. Variability occurred between and within the germplasm groups. AR were formed only in plants subjected to stress and differences were found in their number, with a few genotypes showing also earlier AR emission. With waterlogging, some genotypes tillers were affected with effects in final yield. The recovery period seems to be the most critical, with 20 of the 23 genotypes being negatively affected in living tillers number, probably due to oxidative stress onset during aerobic conditions reestablishment. Overall, the PL and Austrl genotypes performed better under waterlogging conditions, while IT genotypes showed an opposite behavior. The large variability found under the studied waterlogging conditions suggests that the selection of tolerant genotypes should focus not only the group they belong to, but also the germplasm as a whole.


To Know more about  Agricultural Research & Technology: Open Access Journal

Click here:  https://juniperpublishers.com/artoaj/index.php


To Know more about our Juniper Publishers

Click here: https://juniperpublishers.com/index.php 

Thursday, September 28, 2023

Palmer and Pellegrini-Stieda Disease, Two Late Complications of Medial Collateral Ligament Rupture of the Knee - Juniper Publishers

Orthopedics & Rheumatology - Juniper                                             Publishers

Summary

Introduction: Palmer and Pellegrini-Stieda disease are rare complications of traumatic rupture of the medial collateral ligament of the knee with a different behavior.

Objective: To assess the pathophysiology, clinical, radiological, arthroscopic picture, and treatment of two late complications of traumatic injury to the internal collateral ligament of the knee.

Method: The search and analysis of the information was carried out in the period from January 1 to May 31, 2023, in the PubMed, Hinari, SciELO and Medline databases using the EndNote search manager and reference manager, using Keywords: rupture, internal collateral ligament, disease, Palmer, Pellegrini-Stieda. A total of 38 articles were obtained, of which 18 from the last five years were selected for discussion.

Development: Palmer and Pellegrini-Stieda disease are late complications resulting from traumatic rupture of the internal collateral ligament but with a different behaviour, the first with intra-articular manifestations with repercussions on the functionality of the joint simulating a rupture of the internal meniscus and the second with extra-articular manifestations with ossification of the thickness of the internal collateral ligament and notable impairment of knee function.

Conclusion: Internal collateral ligament rupture, undiagnosed or insufficiently treated, can result in Palmer’s or Pellegrini-Stieda’s disease as a late complication, the treatment of which is cumbersome, hence the importance of its correct diagnosis and treatment.

Keywords: Rupture; Internal collateral ligament; Disease; Palmer; Pellegrini-Stieda

Introduction

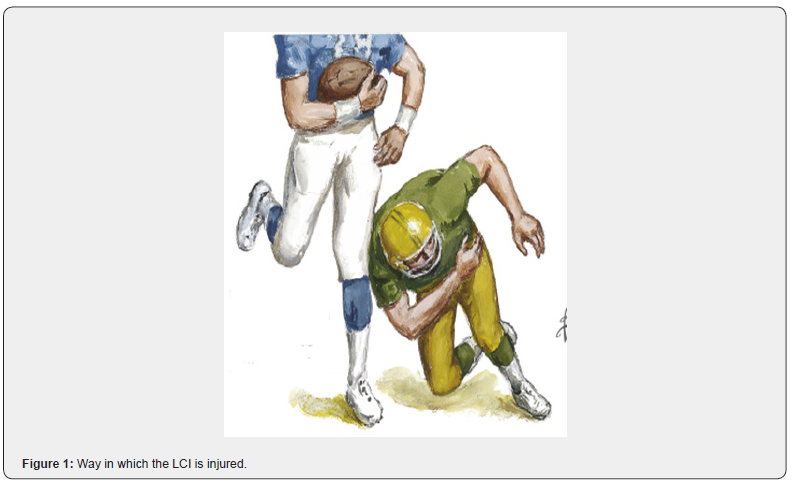
Internal collateral ligament (LCI) injury is a common trauma in young people, especially because of both recreational and high-performance sports in contact sports such as soccer in its different variants (Figure 1) as well as activities work, it is considered exceptional in children and older adults [1,2]. According to Busto-Villarreal [3] quoting Márquez [4] in a study of 500 people with knee ligament injuries, 29% corresponded to LCI ruptures and between 13-18% combined injuries of the LCI and ACL due to what the LCI is involved between 42-47% of all ligament injuries of the knee.

The diagnosis of these lesions is basically clinical and is achieved with exhaustive questioning and a physical examination consisting of the valgus stress test or Böhler maneuver [5,6]. This maneuver can be done radiologically by subjecting the knee to stress by performing an Rx in anteroposterior (AP) view [7,8]. Other complementary tests that can be performed for the diagnosis of these lesions are Ultrasound and Nuclear Magnetic Resonance (NMR), the latter limited by not existing in all hospitals and its high cost. The treatment of traumatic injuries of the LCI is basically conservative with immobilization with an inguinopedic cast for 3-4 weeks and then starting an energetic rehabilitation program [3]. Some authors undertake ligament repair in patients with high demand on their knee using primary repair techniques and even plasties [3,7].

If the lesion is not diagnosed or an incomplete treatment is carried out, two late complications could occur: Palmer’s disease (PD) and Pellegrini-Stieda disease (PD-S), so the objective of this article is to assess these two late complications. consequence of a traumatic injury of the LCI of the knee to better understand its pathophysiology, clinical, radiological, arthroscopic picture as well as the best treatment to carry out for its solution.

Method

The search and analysis of the information was carried out in a period of five months (from January 1 to May 31, 2023) and the following words were used: Rupture, internal collateral ligament, disease, Palmer, Pellegrini-Stieda. Based on the information obtained, a bibliographic review of a total of 38 articles published in the PubMed [https://pubmed.ncbi.nlm.nih.gov/], Hinari [https://www.who .int/hinari/es/], SciELO [https://scielo.org/ es/] and Medline [https://medlineplus.gov/spanish/] through the EndNote search manager and reference manager, of which They selected 18, from the last five years, to carry out the discussion. The words selected for the search were taken from MeSH (Medical Subject Headings).

Development

Palmer’s disease

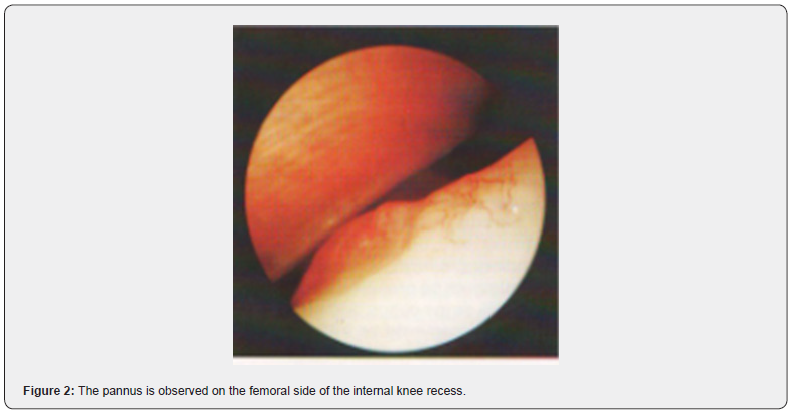
Described by the Swedish doctor Ivar Palmer in 1936, cited by Eriksson [9], it is a rare and unknown pathology that originates from traumatic rupture of the LCI in the thickness of the ligament towards the femoral insertion and whose subsequent healing with consequent retraction of the ligament originates in the internal recess of the knee towards the internal femoral condyle in arthroscopic visualization a mamelonating lesion with bulge, synovial proliferation and pannus formation (Figure 2) that also causes pain on the internal side of the knee on the joint spacing, limitation to the extension of the last few degrees and references to episodes of blockages simulating a meniscal lesion [10,11].

It generally occurs in young male patients because of practicing sports, whether recreational or high performance, between one and two years after the occurrence of a traumatic event in the knee, hence the importance of exhaustive questioning of the patient [10]. Patients complain of pain on the inside of the knee and of suspected blockages, occasionally they may present joint effusion. The physical examination reveals a limitation to the extension of the knee compared to the contralateral one. It simulates a meniscus lesion with positive Böhler, Mc Murray and Appley maneuvers [5,10]. But there is a maneuver discovered and practiced by Palmer, also known as the Wobble Test’s, brought to the present day by Carnes and Malanga [5,6] and cited by Morales et al. [10].

Palmer’s maneuver or Wobble Test’s

It consists of placing the patient in a supine position and the hip flexed between 30-45°, the performer of the maneuver standing next to the patient holds the knee with both hands and holds the leg between the thorax and the examiner’s arm, place the balls of the thumbs on the medial and lateral joint lines to gain space and sensation, then alternate valgus and varus repeatedly starting with the knee at 30° and slowly extending it. If the procedure is painful or there is apprehension, the maneuver is positive.

Mistakes that can be made.

Move the knee from front to back.

Move very fast.

Applying too much valgus and varus to the knee.

Don’t make it repetitive.

Do not make it comparative with the contralateral knee.

Meaning of the maneuver

If the ligament is lax, it is a premonitory of hyperlaxity or ligament rupture (acute phase), if there is no laxity and it is limited in relation to the contralateral knee, it is synonymous with anterior rupture, healing, and retraction of the ligament (chronic phase).

Pathophysiology

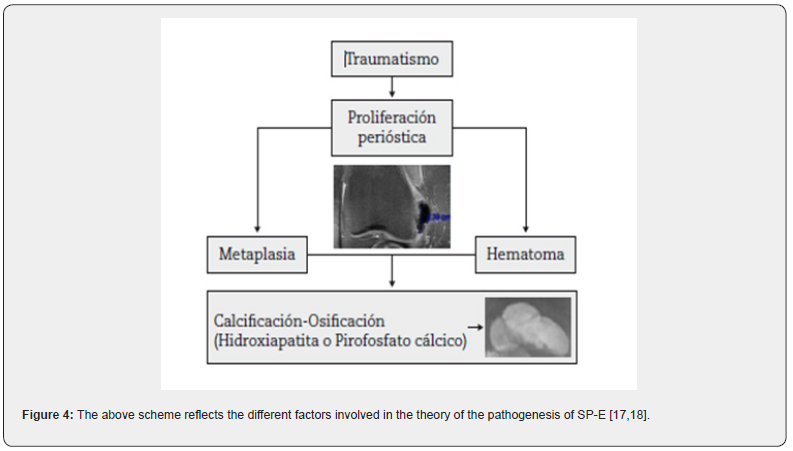
The superficial internal collateral ligament has abundant irrigation (Figure 4). When it is injured, the healing of this ligament complies with the classic model that consists of hemorrhage, inflammation, repair and remodeling. The rupture must occur in the thickness of the ligament, since if it occurs in After insertion, bleeding can be accompanied by osteogenic cells and create conditions for ossification [12-14]. Although the phenomenon occurs in the thickness of the LCI, translation is intra-articular, forming a small promontory in the internal recess of the internal face of the femoral condyle. internal surrounded by pannus and that is the cause of the supposed “blockages”.

Diagnosis

It is achieved with an exhaustive questioning, detailed physical examination where, in addition to practicing the classic knee exploration maneuvers, we must practice the Palmer or Wobble Test’s maneuver, many times the finding is accidental when performing a routine arthroscopy due to the suspicion of an injury of the internal meniscus.

Treatment

The treatment is arthroscopic and consists of the ablation of the pannus and the promontory that causes the blockages with an energetic post-surgical rehabilitation.

Pellegrini-Stieda disease

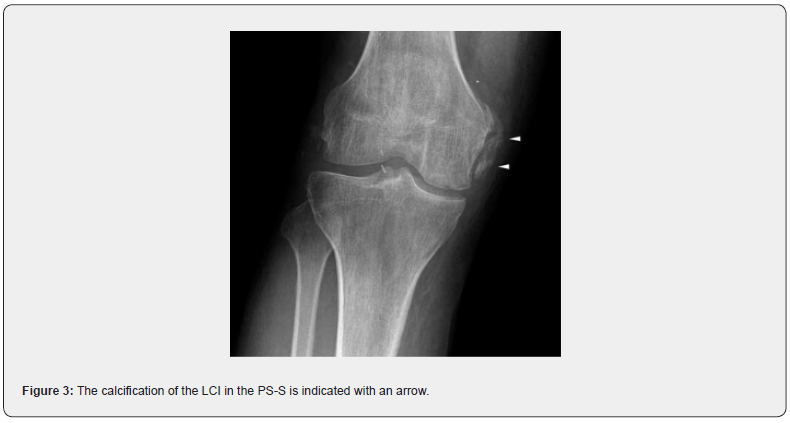
Also known as Pellegrini-Stieda Syndrome, described in 1905 by the former and 1908 by the latter [15]. It consists of calcification of the LCI (Figure 3) and occurs because of the rupture of this ligament as a result of a trauma in the femoral insertion that does not was misdiagnosed or undertreated. Mostly young patients, men who are active at work or in sports, who report a history of knee trauma and complain of pain on the inner face and present limitation mainly to knee flexion [15]. The physical examination revealed pain on the inner side of the knee with greater sensitivity in the path of the LCI and pain with some limitation to flexion. Böhler and Palmer maneuver are positive.

Diagnosis

The diagnosis is basically made by simple X-ray of the AP and lateral knee, observing the calcification of the LCI. In 2006 Mendes et al. [16] cited by Forriol [17] published a classification of the radiological characteristics of LCI calcifications characterized by:

Grade I: Peak-shaped with inferior orientation and union to the femur.

Grade II: Drop-shaped with inferior orientation and parallel to the femur.

Grade III Elongated with superior orientation.

•Grade IV: With upper and lower orientation attached to the femur.

Ultrasound and MRI are also used, the latter being more expensive and not within the reach of many. pathophysiology.

Treatment

Once the diagnosis has been established, treatment is basically conservative, aimed at eliminating calcification, using rest, NSAIDs and physiotherapy in its different variants [17,18]. Other authors recommend needle aspiration under echosonographic vision and infiltration on steroids. Surgical treatment consisting of excision of calcifications is also recommended, with the drawback that they can be reproduced [18].

Conclusion

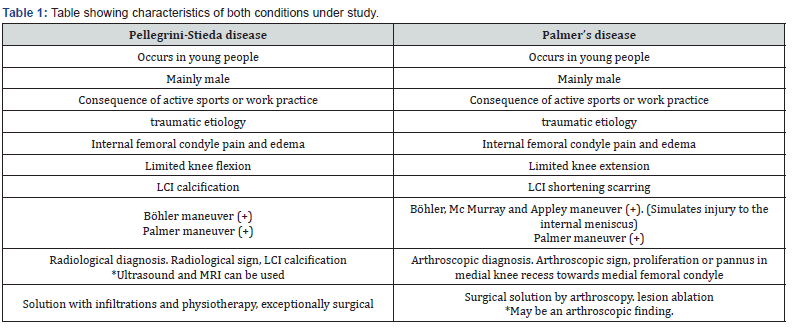
Finally, and as a conclusion, we condense in the following synoptic table the most significant characteristics of both conditions under study (Table 1).


Friday, July 14, 2023

Stress Among College Students is Linked to Headache, PCOS, Hypertension, and Depression: A Cross-Sectional Study - Juniper Publishers

 Psychology and Behavioral Science - Juniper Publishers

Abstract

Objective: In the present study, we aimed to find out the prevalence of stress among college students.

Methods: In this descriptive cross-sectional study, a simple random sampling approach was chosen for data collection from different colleges of Jammu & Kashmir (UT). Data analysis was done by using the chi-square test, and the t-test was utilized for discrete and continuous variables respectively. The logistic regression model using odds ratio was utilized to find out the association between the risk variable and the dependent variable.

Results: A total of 1405 college students were included in which stress was found in 60.49% of students with males representing 34% and females 65.88%. Educational stress was found to be the major contributor of stress-type faced by the students with 46.35%. Different disorders were also observed in students including hypertension 2.70%, PCOS (Poly-cystic ovarian syndrome) 2.34%, and depression 2.84%. Stress was found associated with the PCOS with OR: 3.62 [95% CI: 1.4850-8.84, p-value: 0.0047], headache OR: 3.67, hypertension OR: 5.31 [95% CI: 2.06-13.70, p-value: 0.0006] and depression OR: 7.24 [95% CI: 2.56-20.48, p-value: 0.0002].

Conclusion: Educational stress is found to be very common among college students which may alter the prosperous life of students. Female students were seen to be more stressed than male students. Stress has a strong detrimental impact on students’ health because it is considerably linked to conditions including hypertension, PCOS, and depression. Therefore, the educational system must need a better strategy that will ensure a better education system.

Keywords: Stress; Educational stress; Hypertension; PCOS; College students

Abbreviations: PCOS: Poly-cystic ovarian syndrome; SAA): Salivary Amylase Activity; FGD: Functional Gastrointestinal Disorders; IBD: Inflammatory Bowel Disease; PU: Peptic Ulcer; UC: Ulcerative Colitis; CRH: Corticotrophin Releasing Hormone; ACTH: Adrenocorticotropic hormone; OR: Odds Ratio; OECD: Organization for Economic Co-operation and Development

Introduction

In today’s world, many shortcomings need to be eliminated and education is the one that is often seen as a solution to many social problems. Education is an important instrument that has the power to make a person interactive, self-reliant, social, and disciplined. Education broadens the scope of learning by facilitating knowledge absorption and dissemination among people in order to advance society [1]. Every individual is bombarded with a multitude of perceptual information in their day-to-day life activities. Apart from such advantageous features of education, the ability to process information is limited and varies from person to person. These cognitive characteristics have the potential to disrupt students’ lives periodically, which might result in circumstances that resemble stress and anxietylike condition. According to physiological definition, stress may be described as “any form of change that results in bodily, emotional, or psychological strain or pressure”.

It could result from a traumatic, disappointment, or uneasy encounter or sensation [2]. It is not that stress is bad, “Eustress” describes stress as a “positive, motivating, and enhances functioning feature which leads to the excellent performance” while “distress” refers to bad and overwhelming stress full condition which leads to tiredness, despair, and a variety of other illnesses and thus impairs functioning [3]. Albeit intense or transient pressure can be helpful but ongoing pressure, which goes and remains for a more extended period, is very unfavorable to the body and causes hypertension, weight gain, sadness, and even coronary diseases [4]. The effects of anxiety on students’ academic performance were detrimental [5] and besides anxiety, another emotionally uncomfortable disorder that could interfere with a student’s life is depression.

Stress affects students’ life in a variety of ways, including how they perform academically, socially, physically, and emotionally [6]. Exam stress, a lack of interest in attending lectures, full schedules &responsibilities, lack of sleep, an inability to understand the topic, and academic pressure (pressure to achieve high marks and concerns about receiving poor grades) are some examples of stresses faced by students [7]. The cognitive system becomes overburdened under stressful settings, reducing the student’s attention and ability to process the perceived information [8]. Biologically, stress can lead to long-term health complications, chronic illness, and psychiatric conditions such as migraine, PCOS (poly Cystic Ovarian Syndrome), depression, and suicide [9-11].

The Organization for Economic Co-operation and Development (OECD) recently conducted a survey that included 540,000 students aged 15-16 years old from 72 nations which showed that education and academic achievement are major sources of stress for students [5]. Therefore, in the present study, we aim to find out the stress frequency among college students of Jammu division. To our knowledge, this is the first study that included 10 district colleges from our region. The remainder of the paper is laid out as follows: methods utilized in this study are depicted in Section 2, section 3 includes the result of the study, section 4 represents the discussion and the conclusion of the study is present in section 5.

Method

In this present descriptive cross-sectional study, a random sampling approach was chosen for data collection from different colleges in the Jammu division of Jammu & Kashmir (UT). The sample collection was done in two phases i.e., Phase-I (Face-face interview) and Phase-II (E-based sampling).

Sample Collection

A targeted survey was taken in the colleges of the Jammu division to gather data from the different college students. The information was gathered using two different phases, including face-to-face interviews (Phase-I) conducted by an experienced interviewer/ trained interviewer and online sampling/ E-Sampling using a google form (Phase-II). The questionnaire/ Google form was disseminated through emails and social networking sites. The present study design was duly approved by Animal and Human Experimentation Ethical Committee (AHEEC), University of Jammu vide notification number EC: DRS/22/4969.

Filtering and Data Cleaning

A large data set was obtained using the E-based sampling approach, and the data was cleaned and filtered using a variety of exclusion criteria to decrease redundancy and bias. Exclusion criteria include “students that did not belong from the district of Jammu division”, “non-college students”, “who don’t permit for use of their data (incomplete consent)”, and also the exclusion of subject data “who gave the partial information”.

Data analysis and statistics

For the descriptive data analysis, mean with Standard deviation and frequency distribution were used for the continuous and discrete variables respectively. The chi-square test and the t-test were utilized for the discrete and continuous variables, respectively, in the inferential statistics. The logistic regression model utilizing the odds ratio (OR) was used to determine whether the risk variable and the dependent variable i.e., diseases were associated or not. Online free statistical tools/calculators such as MedCalc’s Odds ratio calculator for calculation of Odds ratio, t-test were calculated by graph-pad Home-GraphPad and for chi-square statistics Social Science Statistics (socscistatistics.com) were used to draw out the inference.

Result

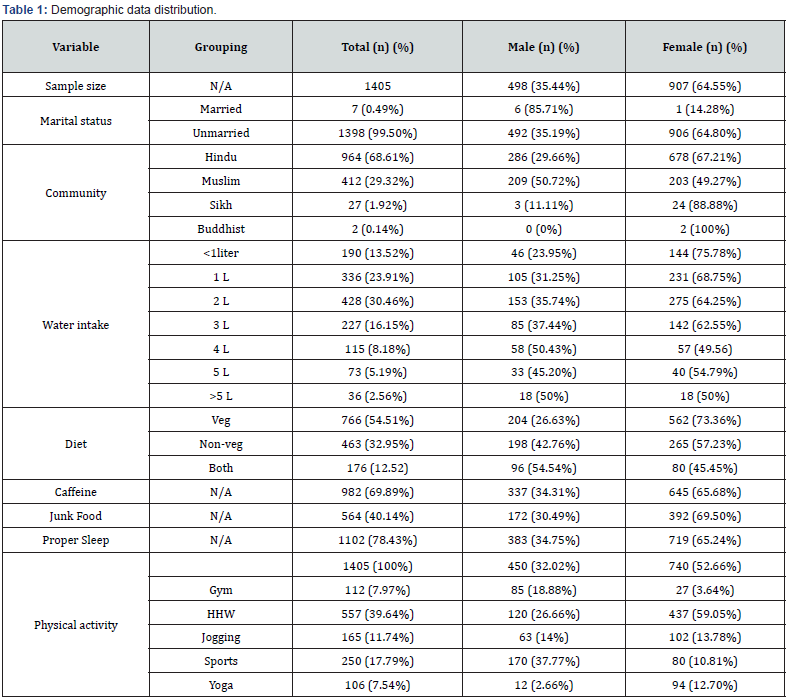
A total of 1405 college students were included with a mean age of 19.64±1.32, including 498 males (19.46±1.32) and 907 females (19.74±1.31). We found a highly statistical difference between the age of male and female students among college students (t-test: 3.8220: p-value: 0.0001). The majority of students were belonging to the Hindu community (n=964) in contrast to Muslims (n=412) and with minorities including Sikhs and Buddhists n=27 and n=2 respectively (Table 1) (Figure 2A). Regarding the martial estimates, the frequency of married students was not quite high (0.49%) (Table 1). Lifestyle activity of students has been also observed where it is found the lower frequency of alcohol usage 1.35% (n=19/1405) in which the male participants represent the dominancy 72.68% (n=14/19) over the female 26.31% (n=5/19).

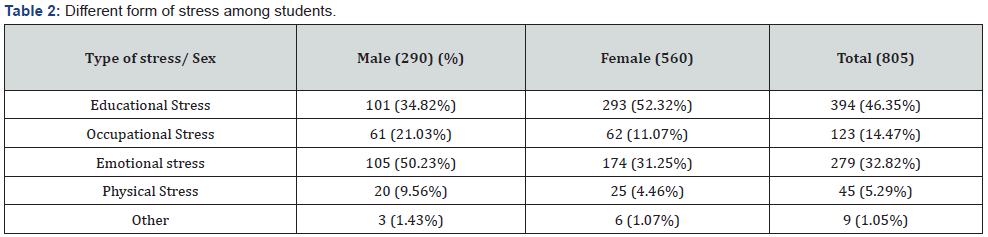
Also, the increased smoking habit was observed in males 71.42% (n=15/21) in contrast to female students 28.57% (n=6/21). Around 1190 students (84.69%) were observed to do physical activities including n=450 males (37.81%) and n=740 female (62.18%) (Figure 2E) (Table 1). Regarding the dietary pattern, it was observed that 32.95% (n=463) were non-vegetarian (n=766) were vegetarian and 12.52% (n=176) take both (veg % and non veg.) and with respect to the caffeine 69.89% (n=982) were taken caffeine out of which32.29% (n=327) were occasional (Figure 2B) (Table 1). Stress was found in 60.49% students (n=850/1405) with the male representing 34% (n=290/850) and female 65.88% (n=560/850). We observed statistically significant difference (t-test = 3.3926, p-value: 0.0007) between the age difference between stressed males (19.46±1.33) and females (19.78±1.29).

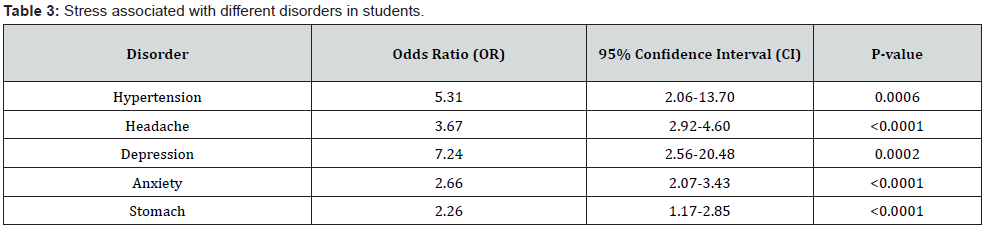
The frequency of the different types of stress was observed (Table 2) and the educational stress was at the top representing 46.35% including 34.82% (n=101/290) and females 52.32% (n=293/560) (Figure 2F). Different disorders were observed in students which include hypertension 2.70% (n=38/1405), PCOS (Poly-cystic ovarian syndrome) 2.34% (n=33/1405), and depression 2.84% (n=40/1045). To find out the risk attribute associated the condition Odds ratio (OR) were utilized. Stress was found associated with the headache OR: 3.67,95% CI: 2.92-4.60, (p value: <0.0001), PCOS with OR: 3.62 [95% CI: 1.4850-8.84, p-value: 0.0047], hypertension OR: 5.31 [95% CI: 2.06-13.70, p-value: 0.0006] and depression OR: 7.24 [95% CI: 2.56-20.48, p-value: 0.0002]. Also, caffeine risk on hypertension and PCOS were also observed including OR: 5.24 [95% CI: 1.60-17.17, p-value: 0.0061] and OR: 3.12 [95% CI: 1.13-9.34, p-value: 0.027] respectively.

We also observed the bidirectional association of headache and hypertension and found a significant increase of risk i.e., headache to hypertension OR: 14.65, 95% CI: [6.59-32.57], (p-value: 0.0001) and hypertension to headache OR: 3.61, 95% CI: [1.64-7.94] (p-value: 0.0014). Stress was also found significantly (p value <0.0001) associated with the risk of anxiety (OR: 2.66, 95% CI: [2.07-3.43] and risk of stomachache (OR: 2.26, 95% CI: [1.17-2.85]) (Table 3). Educational stress was found significant (p value: <0.0001) responsible for increasing the likely hood of headache by 3.8-fold (OR:3.84, 95% CI: 2.92-5.05). Emotional stress was found to be a high-risk variable associated with hypertension with an OR: 2.74 [95% CI: 1.35-5.54, p-value: 0.0050]. Also, the association between emotional stress and PCOS was observed with an OR: 1.14 [95% CI: 0.50-2.58] but did not reach at statistical significance (p-value: 0.74).

Discussion

Education has a crucial role in society since it may influence people’s attitudes, ways of thinking, and behaviors [12]. But stress which is an inevitable part of life has a detrimental effect on student’s physical and emotional health as well as their academic performance. In the present study, we observed that college female students were more stressed than the male participants, with the female group showing higher levels of educational stress (Figure 3F). Also, emotional stress was found to be more frequent in the female group as compared to the male students (Figure 3F). College students experience stress due to increased workload, new responsibilities, poor time management, and interpersonal relationships [13].

In comparison to our study, many research studies have provided significant data on stress and students and their relationship. According to Waghachavare and colleagues, 25.1% of medical students, 28.7% of dentistry students, and 19.7% of engineering students reported feeling stressed out. In comparison to the gender disparity, female students were found to be more stressed than the male participants [14-16]. According to published data, secondary school students had a medium degree of tension, with females being shown to be more stressed [17]. In the college institution, more than one-fifth of college students suffer from mental problems [18] and the academic domain was the most common source of stress, followed by the social activity area, and group activity domain [19]. Regarding the academic domains, science, and commerce domains students were shown to be more academically stressed than the students in the arts, management stream, and humanities [20]. The fact is that most of the female respondents feel stress in their college life because of fear of failure [21,22].

Reasons for the stress among the students were found the lack of appropriate support, a variety of personal and social issues, academic pressure, extracurricular activities, assignments overburden, and most importantly parents want their children to participate in the rat race and outperform their peers to improve their social status, the attitude of faculty members [16,23,24]. Rana and colleagues reviewed that stress can be either bad or positive for a person, depending on the severity and duration of the stress, the person’s personality, cognitive assessment of the stress, and social support. They must be raised in a positive environment and more attention is paid to the child’s growth as they enter adolescence [7]. Extreme stress can make it difficult to work effectively, as well as cause poor academic achievement and reported poor health and a lower quality of life [13] and there was no association between high-stress levels and students’ age [15].

The biological aspect of stress is complicated where stress has much negative feedback. One such example is the stress-induced stimulation of the hypothalamus to secrete CRH (Corticotrophin releasing hormone) which then further stimulates the anterior part of the pituitary gland to release ACTH (Adrenocorticotropic hormone) [25]. ACTH flows down from the brain to the kidney through the bloodstream (endocrine signaling) and binds to the specific receptor on the Adrenal gland (located on the kidney) and stimulus to secrete the adrenaline and cortisol. Adrenaline and cortisol alter the homeostatic mechanism of the different systems including heart rate, dilation of bronchioles, increasing blood pressure, increasing blood glucose level by converting glycogen, and decreasing digestive activity (Figure 4). Long-term and continuous stimulus results in a dysregulated mechanism which leads to different diseases such as heart diseases [26], asthma [27], Obesity, Diabetes [28], headaches including migraine [11], depression [29] and anxiety [30], gastrointestinal problems [31], Alzheimer’s disease [32] etc. (Figure 5).

In the present study, we have observed that stress negatively impacted the reproductive health of females where it significantly increases the chance of PCOS (Poly-cystic Ovarian Syndrome) OR: 3.62 [95% CI: 1.4850-8.84, p-value: 0.0047]. Also, structural changes in blood vessels i.e., hypertension found to be significantly associated with stress with OR: 5.31 [95% CI: 2.06- 13.70, p-value: 0.0006]. Mental status among students is the seed for progress but stress has created a distressing environment for the brain and alters its normal activity. We have also observed that stress increases 7 times more chance of depression among students with OR: 7.24 [95% CI: 2.56-20.48, p-value: 0.0002]. Emotional stress was found to be a high-risk variable associated with hypertension with an OR: 2.74 [95% CI: 1.35-5.54, p-value: 0.0050]. Also, the association between emotional stress and PCOS was observed with an OR: 1.14 [95% CI: 0.50-2.58] but was not reached statistical significance (p-value: 0.74). Students have a lot of stress related to their academics, where we found that educational stress is significantly associated with the increased likelihood of headache (OR:3.84).

PCOS results in low self-esteem which causes the majority of psychiatric conditions, such as depression and suicide [9]. Stressrelated factors such as Salivary Amylase Activity (SAA) and salivary cortisol levels were found to be higher in PCOS patients than in age-matched controls, implying an exaggerated response of the central stress stations in the affected women [33,34]. Early life stress such as abuse, and school bullying play a significant effect on the susceptibility to develop FGD (Functional Gastrointestinal Disorders) and IBD (Inflammatory Bowel Disease) later in life [35], gastrointestinal conditions like peptic ulcer disease (PU) and ulcerative colitis (UC). Psychological stress has been found to negatively impact the immune system which worsens the number of skin and hair conditions like psoriasis, alopecia areata, and atopic dermatitis [36].

Humensky and group have shown that self-reported depressive symptoms were associated with concentration difficulties and difficulty completing school tasks between 14 to 21 aged students in the United States were at risk for major depression [37]. One-fifth of college students had mental problems, indicating that mental health is a serious problem that increases with the children’s grade level [18]. These findings imply that there is a strong link between stress or stress-related factors and altered body composition. Also headache and hypertension has been found to be linked with each other (comorbid conditions) [38,39] and this might be due to the presence of diverse risk attributes such as environmental including stress and genetic factors [40].

To this end, the future of any nation lies in its students, who are blessed with incredible abilities; we simply need to discover them. Despite of advanced learning and teaching approach, enhancement of students is not at its peak. Stress is a major reason for the decreased development of students which negatively impacted their health, social status, future goals, their academic life, and many other important life aspects. Therefore, emphasizing the value of research, improving pupils’ growth may be accomplished by suggesting some coping mechanisms like college students should pay attention to their health and nutrition, take proper sleep, manage their time effectively, practice self-care, make connections with others, maintain healthy relations, focus on physical activities, use relaxation techniques like meditation, live organized life, practice positive thinking etc. All of these will help college students to increase their overall health and can reduce stress. Avoiding stress decreases and increases the likelihood of disease occurrence and happy and healthy existence respectively.

Conclusion

If a healthy solution cannot be found, stress can have a negative influence on academic performance and mental health. Therefore, there must be needed a system that will ensure a better education system. Colleges must develop coping strategies to reduce stress triggers and improve student experiences by identifying the causes of stress (financial struggles, academic pressure, studentteacher relationship, conflict with a roommate, family issues, relationship issues, career problems, post-graduation plans etc.) which disrupts student’s daily activities and how to manage it.

To Know more about  Psychology and Behavioral Science International Journal

Click here:  https://juniperpublishers.com/pbsij/index.php

To Know more about our Juniper Publishers

Click here: https://juniperpublishers.com/index.php 
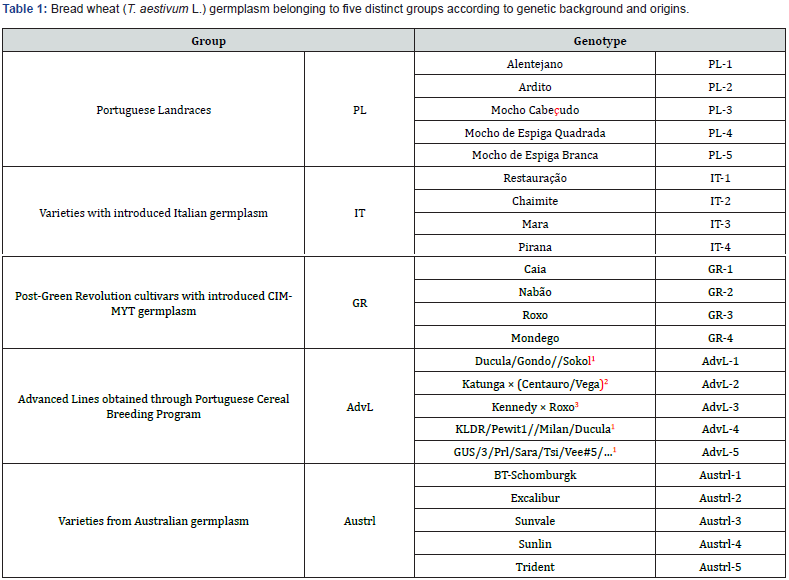

Monday, July 10, 2023

Surgical Treatment of Thumb UCL Injuries with Suture Augmentation - Juniper Publishers

 Orthopedics and Rheumatology - Juniper Publishers


Opinion

It is common for elite athletes to sustain thumb ulnar collateral ligament (UCL) injuries while playing their respective sport. Typically, the mechanism of injury is a radially directed force to the thumb, usually from a fall on the abducted thumb through means such as a ski fall or from sliding into a baseball base. The main goal for this patient population is to return them to sport the quickest and safest way possible.

In addition to the athlete population, many individuals rupture their UCL through every day activities, which can be acute or chronic. With the thumb providing up to 40% of hand function, stability and prevention of post-traumatic arthritis are of utmost importance to the hand surgeon. Injury to the structures surrounding the MCP joint results in a significant impairment of the hand and has been shown to lead to a loss of 22% of hand function. Due to the commonality of the injury and the importance of the MCP joint in the function of the thumb, the treatment of UCL ruptures is significant in the practice of orthopedics. This is done by many means, including direct repair and tendon and free tendon graft. Here we will highlight our preferred method which is surgical UCL repair with suture augmentation.

The current technique we prefer, and use is the Arthrex Suture Tape Augmentation originally described by Giacomo & Shin et al. [1], which has been shown to give increased stability into the thumb after surgery with limited postoperative immobilization. This technique involves creating drill holes for anchors into the proximal phalanx and metacarpal head at the origin and insertion of the ulnar collateral ligament, then loading Fiber Wire suture and Suture Tape onto a 3.5 mm Swivel Lock Anchor and inserting the loaded anchor into the proximal phalanx. A stitch is then thrown into the UCL at its distal free torn end with suture from the anchor at the proximal phalanx. The suture augmentation “Internal Brace” is then completed when the second anchor is inserted in the metacarpal head with suture tape coming from the distal anchor while the thumb is held in 30 degrees of flexion for appropriate tensioning. The only variation from the original technique is use of a 3.5 mm Swivel Lock Anchor in the proximal phalanx rather than a 2.5 mm Push Lock Anchor as we feel the Swivel Lock is easier for insertion and has been shown to have greater pull-out strength. Postoperatively, the patient is seen in hand therapy on post op day #4 and placed in a hand based thermoplastic thumb spica orthosis. The patient begins motion on post op day 10 with the guidance of a hand therapist. The patient begins using the hand without the splint at 4 weeks postoperatively and returns to sport at 6 weeks postoperatively without restriction.

In previous research it has been shown that there is a wide range of time frames for return to sports utilizing the suture augmentation technique for repair of the thumb UCL. Carlson recommended a 6-8 week return to sport for basketball athletes [2]. Werner et al. [3] showed a mean 7 week return to play for collegiate football players. For athletes in season, Sochacki et al. [4] showed 34.8 days in the National Football League and Jack et al. [5] showed a mean of 56.2 days for Major League Baseball Players.

In the past five years, we have performed 55 UCL repairs using the Suture Tape Augmentation. We have had no patients return with re-ruptured UCLs and returned all patients to activity without any complications or laxity in the thumb. Four patients were high level alpine skiers, who returned to racing 4-6 weeks from surgery without complication. We believe that the increased strength and stability gained from suture augmentation allows athletes to return to their sport quicker and safer than conservative treatment or traditional surgical repair relying only on the integrity of the suture to ligament repair. The thumb MCP joint functions to provide a stable base for flexion and extension motion as well as a post for opposition and pinch. Because of this, stability of the MCP joint is essential for hand function. The UCL provides critical stability to the thumb MCP joint during pinch and grip and is therefore important to the function.

Summary

In conclusion, the stability of the MCP joint is important to both the general population and the elite athletes. In our experience, surgical fixation with suture augmentation has led to increased stability postoperatively with excellent results. It is therefore our recommendation to perform this procedure to release athletes back to their sport and the general population back to activities of daily living quicker and safer.

To Know more about Orthopedics and Rheumatology Open Access Journal  

Click here:  https://juniperpublishers.com/oroaj/index.php

To Know more about our Juniper Publishers

Click here: https://juniperpublishers.com/index.php 
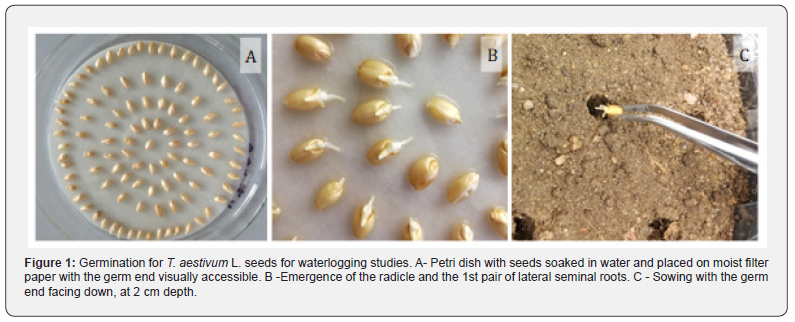
How Does the Multi-Disciplinary Team Impact Chronic Kidney Disease Management? - Juniper Publishers

  Urology & Nephrology - Juniper Publishers Abstract Chronic kidney disease (CKD) is a condition where a gradual kidney function loss le...