Agricultural Research & Technology: Open Access Journal - Juniper Publishers
Abstract
In the context of climate changes, expected increases in intensity, frequency, and unpredictability of waterlogging events will aggravate wheat yield losses, currently estimated to range between 20-50%. Wheat production must fulfill ca. 20% of the population’s energy and protein requirements. Evaluating germplasm with different backgrounds may reveal variability for waterlogging tolerance, allowing a better selection of genotypes with desirable traits for wheat breeding programs. In this work, the effect of waterlogging on adventitious root emission, tiller survival and yield was evaluated. Five studied germplasm groups (Portuguese Landraces; Varieties with introduced Italian germplasm; Post-Green Revolution varieties with introduced CYMMIT germplasm; Advanced Lines from the Portuguese Cereal Breeding Program; Australian varieties) were studied. Groups exhibited intra and intervariability in all parameters in response to waterlogging imposed in climatized growth chambers. After 14 days of waterlogging, the number of adventitious roots ranged from 0 to 7.6 plant-1, with 4 Portuguese Landraces depicting the highest number. The number of living tillers at the end of the stress was highly variable, ranging from reductions of 100% to increases up to 35%. At harvest, the number of productive tillers significantly differed among genotypes, with reductions reaching 100% in some cases and increases up to 138% in others. The existence of variability and the identification of key traits underlying waterlogging tolerance will contribute to develop more adapted wheat plants and to improve wheat yield.
Keywords: Triticum aestivum L.; Portuguese Landraces; Australian varieties, CYMMIT germplasm; Advanced lines; Tillers; Excess water; Waterlogging
Abbreviations: AdvL - Advanced Lines from the Portuguese Wheat Breeding Program; AR - Adventitious roots; Austrl - Australian varieties; CP - Main culm; GR - Post-Green Revolution varieties with the introduction of CYMMIT germplasm; IT - Varieties with the introduction of Italian germplasm; K nº - Kernel number; Pl - Plant; PL - Portuguese Landraces varieties; Prod - Number of productive tillers at the end of the growth cycle; Prod/Max - Ratio between Number of Productive tillers and Maximal number of emitted tillers; SKW - Single kernel weight; T - Tillers; T0 - beginning of waterlogging treatment; T2 - 2 days of waterlogging treatment; T4 - 4 days of waterlogging treatment; T7 - 7 days of waterlogging treatment; T7R - 7 days of recovery; T14 - 14 days of waterlogging, end of waterlogging period; T14R - 14 days of recovery; WL - plants subjected to 14 days of waterlogging; WW - control plants
Background
As a result of climate change, the increased instability of rainfall regimes raises the incidence of waterlogging events [1-3]. Such stress currently affects 10 to 15 million hectares of wheat-growing land, undermining food security as a result of substantial yield losses (20 to 50%) [4]. This may compromise approximately 20% of the world’s protein and energy needs, actually ensured by wheat [5]. Waterlogged soil undergoes significant changes in its chemical properties [6-8]. As the soil pores fill with water rather than the gas phase, oxygen concentration is reduced which is exacerbated by the drastic reduction of gas exchange between the soil and the atmosphere [8,9]. The remaining oxygen trapped in the soil is rapidly consumed by root respiration and by microbial activity in rhizosphere, resulting in hypoxia or even environmental anoxia. Oxygen concentration is inversely proportional to the Redox potential (Eh) value [10], and a waterlogged soil typically displays a decrease in its Eh. According to [11], a soil with an Eh close to 0 mV will have an oxygen concentration of approximately 1%, leading plant roots to switch from aerobic to anaerobic metabolism [8-11]. Thus, roots are the first plant organs to be affected by hypoxia and anoxia due to waterlogging; resulting in impaired root functioning and detrimental effects in shoots [12]. Waterlogging susceptible wheat genotypes frequently exhibit severe metabolic constraints and growth arrest, enhanced leaf/ organ senescence, decreased accumulation and remobilization of photoassimilates, and, reduced production [13-15]. The decrease in yield is related with the number of kernels plant-1, spikes plant-1, kernels spike-1, and the weight of a single kernel, which is reflected in the thousand kernel weight.
Survival and development of tillers, as well as the ability to produce new ones, are crucial traits in plants subjected to waterlogging since they are directly proportional to the number of spikes per area unit [16], with a direct effect on final yield [17]. Although a decrease in the number of emitted tillers occurs in some varieties, this does not always reflect a decrease in fertile ones, indicating some capacity to maintain production in an energy deficit situation [17-19]. Nonetheless, the preservation of the number of fertile tillers does not guarantee the maintenance of yield, as their contribution to the final yield may be affected [16]. Several studies indicate that yield reduction due to waterlogging is associated with low tillers survival [20-22] reduced fertile tillers, and reduced kernel size [15,17]. The formation of adventitious roots in response to waterlogging may be a strategy to reduce oxygen deficiency, as these roots facilitate gas transport between submerged tissues and the aerial portion of the plant. In addition, these morphological adaptations play a decisive role in nutrient and water uptake during waterlogging, significantly contributing to survival [8,23] and to maintain productivity. The selection of potential progenitors in breeding programs largely depends on the evaluation and understanding of the existing genetic variability [24,25]. Screening genotypes with distinct genetic origins may provide the genetic diversity required for breeding aiming to achieve crop yield stability and resilience in adverse environments [26,27]. To understand the relationship between the effects of a stress and its impacts on plant development, studies conducted under controlled conditions provide the most reliable and reproducible results [28].
The aim of this work was to evaluate, under controlled conditions, the effect of 14 days of waterlogging on bread wheat (Triticum aestivum L.) germplasm with distinct genetic background. In each genotype, the effect of stress on adventitious root formation, the number of surviving tillers during stress, after recovery (7 and 14 days), and the fertile tillers obtained at the end of the growth cycle, were evaluated. Final yield, kernel number, and single kernel weight, were also evaluated per genotype, as well as the contribution of the main culm and tillers in final yield. Considering germplasm groups, the possible relationships between the analyzed parameters were studied, along with the interactions between the ability to emit adventitious roots and the effects on the analyzed traits. The existence of variability and the identification of key traits underlying tolerance to waterlogging will contribute to develop more adapted wheat plants and to improve wheat yield under a changing climate.
Materials and Methods
Wheat germplasm
The research focused on 23 wheat genotypes (Triticum aestivum L.) from different origins and belonging to distinct evolutive or breeding groups (Table 1): five Portuguese Landraces (PL) from Vasconcellos ancient collection [29]; four varieties released between 1950-1970 with introduced Italian germplasm (IT) [30]; four Post Green Revolution varieties released between 1980-1989 with the introduced CIMMYT germplasm, according to Almeida (2016) [30]; five Advanced lines from the Portuguese Cereal Breeding Program (INIAV, I.P.) and five varieties from Australian germplasm (Austrl). Certified seeds of each genotype were provided by the Portuguese Cereal Breeding Program (INIAV, Elvas, Portugal). Since limited amounts were available, seeds were multiplied prior to the experiment, to ensure uniform germination capacity (100%, results not shown) and adequate vigor of plant material. This step was performed in growth chambers (Fitoclima 10000 EHHF, ARALAB, Portugal) under identical conditions of temperature (22/15 oC, day/night), irradiance (ca. 800 μol m-2 s-1), relative humidity (70/75%, day/night), photoperiod (14 h), and CO2 (400 μL L-1) in 5 L pots with field-collected loamy clay soil.
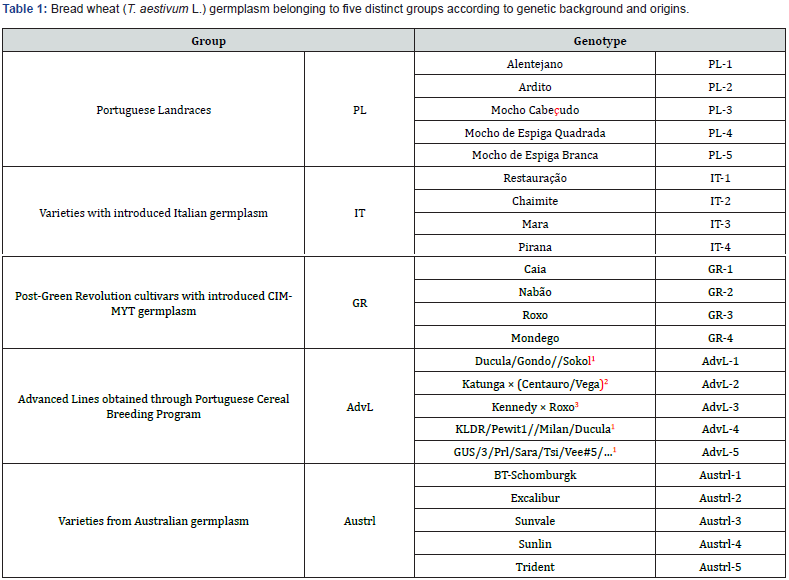
1CIMMYT material; 2Australian × Italian; 3Australian × Portuguese
Growth conditions
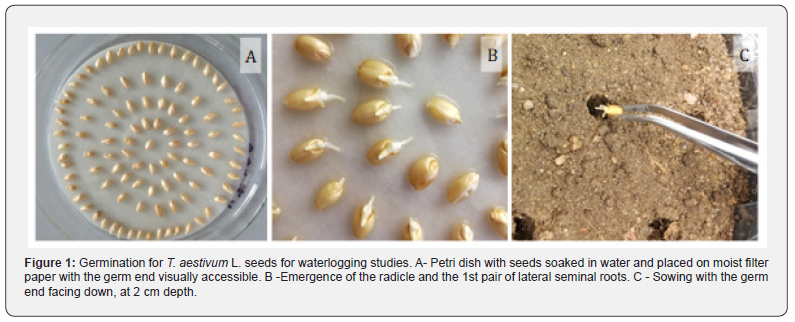
Approximately 120 seeds from each genotype were soaked in water, placed on moist filter paper in Petri dishes (Figure 1A) and kept at room temperature until the radicle and the first two lateral seminal roots emerged (Zadoks scale 05 to 06, Z05 to Z06) [31] (Figure 1B). The newly germinated seeds were then placed at a depth of 2 cm (Figure 1C) with the germ end facing down, in 5L pots (7 seeds per pot) filled with sieved loamy clay soil. For each genotype 12 pots (6 for control plants and 6 for waterlogged plants) were prepared. Plants were grown in walk-in growth chambers (EHHF 10000, ARALAB, Portugal), under controlled temperature (22/15 °C, day/night), irradiance (ca. 500-600 μmol m-2 s-1), relative humidity (75%), photoperiod (14 h) and CO2 (400 μL L-1) and maintained with a field capacity of ca. 85% except in stressed plants during the waterlogging period. The plants were fertilized weekly with 250 mL of a 12% N, 4% P, and 6% K solution (Complesal, Bayer), except during waterlogging, the weeks immediately preceding and following stress, and the final stages of maturation.
Waterlogging imposition
When plants reached the tillering stage (Zadoks scale 22 to 25, Z22 to Z25) [31], half of the pots were kept at ca. 85% field capacity (control plants, WW) and the other half were subjected to waterlogging (waterlogged plants, WL). This was accomplished by placing pots in plastic containers and flooding them until a water layer of ca. 0.5 cm was formed above the soil surface. Daily, water was added with care in order to maintain the water layer without incorporating air. After 14 days, the water stress was suspended by removing the pots from the boxes and maintained in the same conditions as WW plants until harvest.
Soil Redox Potential (Eh)
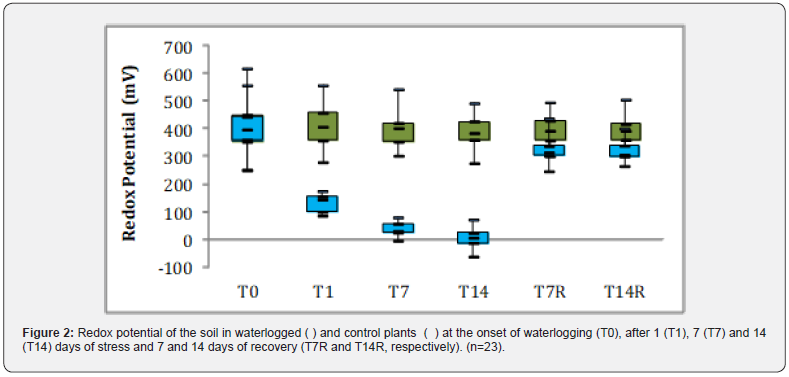
Soil reduction-oxidation potential was measured in 1 pot of each genotype in each treatment, at the beginning of waterlogging (T0), after 24 h (T1), at 7 days of waterlogging (T7), at the end of the stress period (T14) and after 7 and 14 days of recovery (T7R and T14R, respectively). A portable Eh meter (XS-Instruments, ORP-5, Italy) was used and measurements were performed at 6 cm deep and the value registered after its stabilization (ca. 15 minutes).
Plants Evaluation and Measurements
Adventitious roots
The number of adventitious roots was determined by examining every plant in every pot at 2, 4, 7 and 14 days following the onset of waterlogging (T2, T4, T7 and T14, respectively).
Number of tillers
The amount of living tillers was counted at T7, T14, T7R and T14R in 18 plants per treatment. At the end of the growth cycle, the number of productive tillers (Prod) was also obtained.
Yield
The impact of 14 days waterlogging in yield (g plant-1) was evaluated in plants subjected to this stress as % of control plants at the end of growth cycle. Plants were harvested and the productive spikes counted and individually threshed.
Statistical Analysis
Data were analyzed using a two way ANOVA to evaluate the differences between water treatments (WW or WL), between time of treatments (T0, T2, T4, T7, T14, T7R, T14R and FC), and their interaction, followed by a Tukey’s test for mean comparisons. A 95% confidence level was adopted for all tests, which were performed independently for each genotype using the software PAST - Palaeontological Statistics software, version 3, University of Oslo, Norway. For Pearson correlations, the same software was used.
Results
Soil redox potential
No differences in Eh values were observed between WW and WL pots immediately prior to the imposition of waterlogging (T0). In the pots that remained at ca. 85% field capacity, no changes were observed between the observed periods (T0 to T14R) with average values of ca. 400 mV, which is considered an ideal value for plant development (Figure 2). In contrast, in the flooded pots an abrupt decrease of Eh (due to the depletion of oxygen), was observed earlier at T1, which was accentuated (although in a softer way) in the following days, reaching minimum values close to 0 mV (even negative in some pots). With waterlogging suspension and the re-entrance of oxygen into the soil, Eh values rose, approaching the values of WW pots after 7 days of recovery (Figure 2).
Adventitious roots
Considering all genotypes, no adventitious roots (AR) were observed in plants grown under control conditions. However, in plants subjected to waterlogging considerable heterogeneity was detected within genotypes in each group, as well as between genotypes of the same group (Figure 3). With the exception of the IT varieties, an early response (T2) in AR formation was observed in some genotypes of the remaining groups (PL-1, PL-2, GR-2, Austrl-1, Austrl-2, Austrl-3, AdvL-1, AdvL-4 and AdvL-5.) (Figures 3 & 4). In contrast, AR were not formed in some genotypes (IT-3 and GR-4) or exhibited a very small number (IT-4, GR-1, GR-3 and AdvL-3) at the end of the stress treatment (T14).
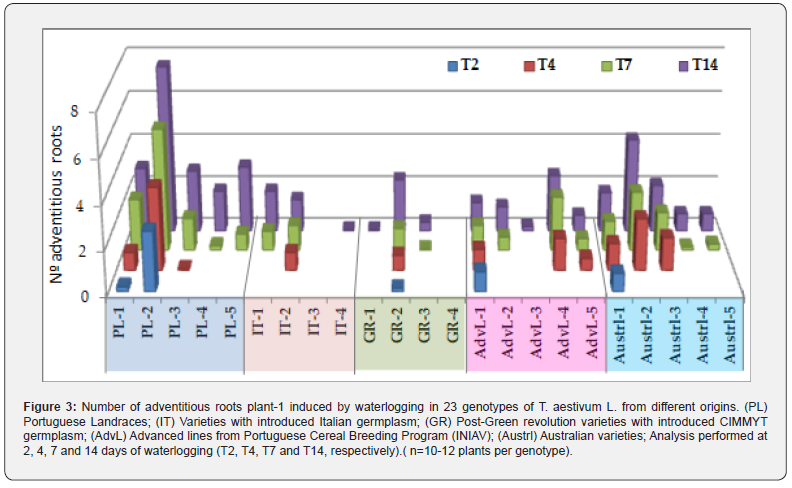
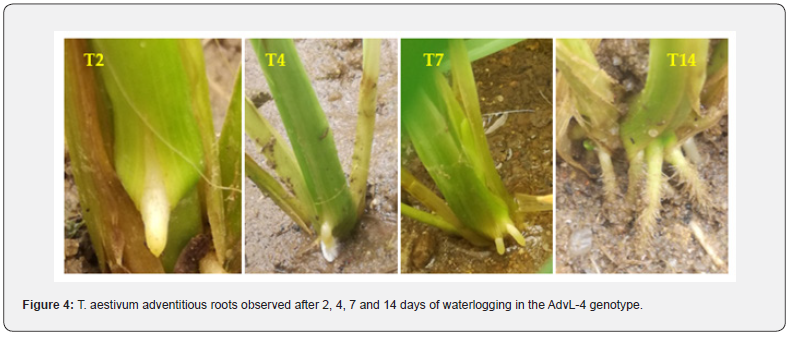
Across all analyzed WL periods, the PL-2 displayed the highest number of AR per plant in comparison to the remaining genotypes. At the end of the WL period (T14), this genotype presented a value of 7.6 while a set of genotypes ranged from 4-2: Austrl-2 (4.3), PL-1 (3.6), PL-5 (3.3), PL-3 (2.9), AdvL-4 (2.6), GR-2 (2.4) and Austrl-3 (2.1). Another set showed values below 2 AR per plant (PL-4, IT-1, Austrl-1, IT-2, AdvL-1 and AdvL-2) Nine genotypes exhibited less than one AR per plant; Austrl-4, Austrl-5, AdvL-5, AdvL-3, GR-3. IT- 4, GR-1, IT-3 and GR-4, displayed values close to or equal to zero.
Tillers number and fertility
At the imposition of water treatment (T0), WW and WL plants of all genotypes were in a similar phenological stage (Figure 5), presenting 2-5 tillers (Z22-Z25) [31]. Regarding WW plants, a great variability was observed in the average number of tillers throughout the growth cycle (Figure 5). Although all plants of each genotype had the same number of tillers at T0, there was some variation in the tillers’ ability to survive, in plants capacity to emit new tillers, as well as tillers fertility at harvest (Prod). At T7, the number of living tillers ranged from 1.4 to 6.5, indicating either the loss of some tillers (as in Austrl-4, AdvL-1 and AdvL-5) or, in other cases, the progression of tillering (as in IT-3). This pattern (reduction or increase in the number of tillers when compared to T0) was observed in all germplasm groups throughout observations conducted until the end of the growth cycle (T7, T14, T7R, T14R, and Prod), with Prod corresponding to grain maturity of productive tillers (Figure 5). Among germplasm groups, at T7, the lowest value was found in Austrl while the highest in the IT group. At T14 the number of tillers barely changed when compared with T7. As the growing cycle progressed (T7R and T14R), both the lowest values (1.3-1.7) and the highest values (7.4-7.7) remained stable, with the first being found in the IT group and the latter in the PL group. At harvest, there was variability in the number of productive tillers between genotypes from distinct or the same germplasm group. Prod values ranged from 0.5 to 1.9 for 12 genotypes and from 2.0 to 4.0 for 10 genotypes, from the 5 studied germplasm groups. Only AdvL-4 and Austrl-3 presented more than 4 tillers (4.9 and 6.8, respectively). In contrast to Austrl-3, which displayed the highest Prod value, AdvL-2 showed the lowest value (0.5).
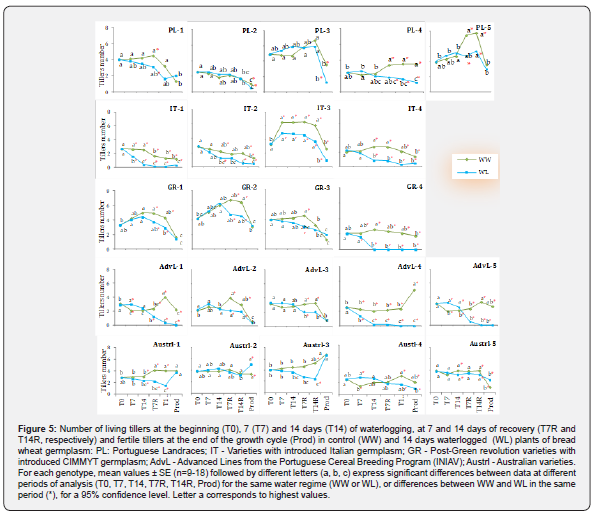
After 7 days of waterlogging (T7), the number of living tillers in WL plants decreased in IT-1 (38%) and AdvL-4 (43%) (Figure 5), resulting in differences between WW and WL plants with reductions in IT-1, IT-3, GR-4, AdvL-3 and AdvL-5, while Austrl-4, AdvL-1 and AdvL-5 exhibited the opposite response with raises by 35, 43, and 61%, respectively. At the end of waterlogging (T14), AdvL-5 was the only genotype presenting an increased number of tillers (24%) in WL in relation to WW plants, in spite of 19% (not statistically significant) decrease in WL plants between T7 and T14, denoting the death of tillers as waterlogging progress. Despite some variations in the number of tillers, no waterlogginginduced differences appeared in PL genotypes during this phase. In contrast, the number of tillers decreased in all genotypes of the IT group (27% to 84%) as well as in Austrl-1 (23%) and Austrl-5 (18%). At T14, GR-4 presented no living tillers and AdvL- 4 presented a 90% reduction when compared with WW plants (Figure 5).
The largest differences between WW and WL plants were observed after 7 (T7R) and 14 (T14R) days of waterlogging suspension. At T7R, 17 of the 23 genotypes significantly reduced the number of tillers (24-100%) whereas at T14R, 18 genotypes presented reductions between 18-100% (Figure 5). At T7R, WL plants of the genotypes PL-2 and PL-3, IT-2, Austrl-2, Austrl-4 and Austrl-5 had identical values to WW, while at T14R, there were no differences between WW and WL in PL-1, PL-2, PL-3, in the genotype GR-3, and in Austrl-2. At the end of the growth cycle, some genotypes exhibited differences in the number of kernelproducing tillers (Prod) (Figure 5). In the first group, PL-1, PL-2 and PL-5 were unaffected by waterlogging, whereas PL-3 and PL-4 showed 64 and 66% reductions, respectively. All of the genotypes with Italian germplasm introduction were severely impacted by water stress, with decreases of 68-88%. After recovery period, GR-4 was the only genotype in its group to exhibit differences in WL plants. All tillers died at T14 and it was unable to recover and produce new tillers by the end of the cycle. Among the Australianorigin germplasm, Austrl-1 and Austrl-3 were able to recover from the damage suffered in T14 and during the recovery period, displaying the same number of Prod tillers as plants not subjected to waterlogging. The genotype Austrl-4 was negatively affected with a 55% decrease in Prod tillers, while Austrl-5 and Austrl-2 showed an increase of 144% and 52%, respectively (Figure 5). These two varieties were the only to exhibit this behavior among the germplasm of the 5 groups under study. Similar to GR-4, the AdvL-1, AdvL-4 and AdvL-5 did not recover and exhibited no Prod tillers by the end of the growth cycle (Figure 5). The remaining genotypes of this group did not differ in the number of Prod tillers between WW and WL plants.
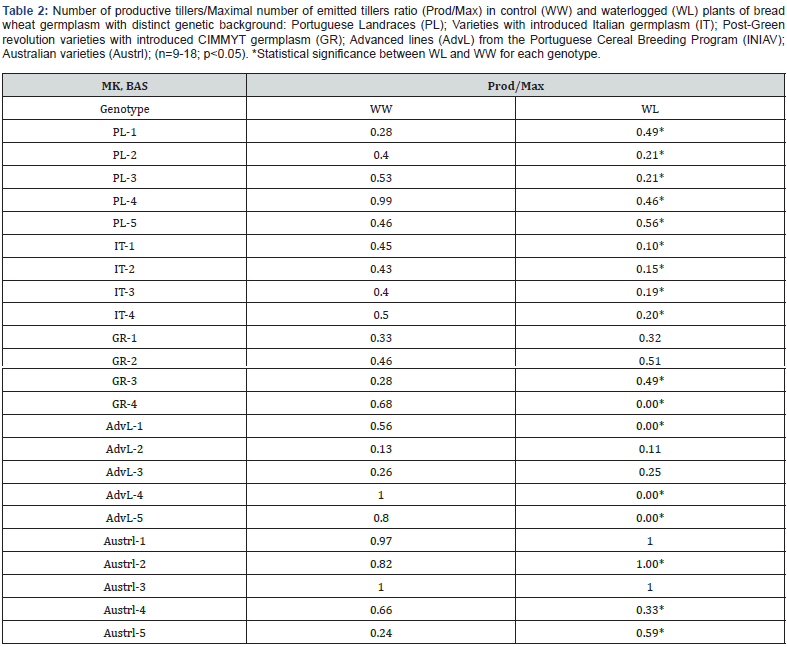
Considering that more tillers may result in more spikes at harvest and that there were differences in tillering capacity among the genotypes under study, we investigated whether waterlogging contributed to changes in the Number of productive tillers/ Maximal number of emitted tillers ratio (Prod/Max) (Table 2). In addition to the observed variability in the number of tillers, the Prod/Max ratio exhibited differences among genotypes and within each germplasm group, for both WW and WL plants (Table 2). In WW plants, PL-4, AdvL-4, Austl-1and Austrl-3 showed values of 1.0 or very close to it, while in 14 of the remaining genotypes, this ratio was ≤0.5 (Table 2). As a result of waterlogging, Prod/Max ratio decreased significantly in 12 genotypes, reaching 0 for GR-4, AdvL-1, AdvL4 and AdvL-5. In contrast, this ratio increased in 5 genotypes (PL-1, PL-5, GR-3, Austrl-2 and Austrl-5), but was not affected in seven genotypes, including the two Austrl (Austrl-1 and Austrl-3) with a ratio ca. 1.0 in WW plants.
Grain yield
The majority of genotypes exhibited changes in yield due to waterlogging (Figure 6). The genotype GR-4 was the most affected, with an 87% reduction in yield, followed by AdvL-4 (77%). With the opposite trend, AdvL-3 and Austrl-5 increased by 47 and 33%, respectively, in response to waterlogging. Yield was negatively affected by stress in the five groups (21 to 87% reductions occurred in 11 genotypes), but the incidence was highest in the IT group, where all genotypes showed yield decreases (21 to 71%). Due to waterlogging, decreases, increases, and even no changes were observed in the remaining groups (Figure 6). Yield decreases appear to be related with the observed reduction in the number of fertile tillers, but only in 8 of these genotypes. In the remaining 3, decreased fertile tillers did not influence final harvest (Figure 6).
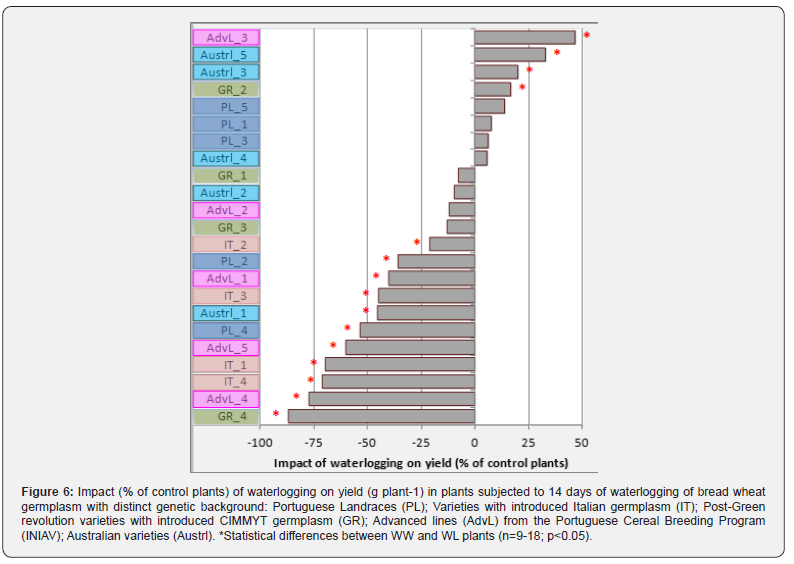
Genotypes that responded to stress with an augmented number of fertile tillers showed a high yield, such as in Austrl-5 (47% yield increase), whereas the higher number of productive spikes in IT-2 was accompanied by a 21% decrease in yield (Figure 6). Among the three genotypes that recovered from severe tillers mortality induced by waterlogging and in the 14 days that followed, different yield results were observed. So, and despite having the same number of fertile tillers as the WW plants, Austrl- 1’s yield was reduced by 45%. In contrast, GR-2 was able to achieve a 17% increase (Figure 6). For genotypes that showed no change in the number of living and fertile tillers, there was also important variability in yield (Figure 6). In contrast to the increases observed in AdvL-3 (47%) and Austrl-3 (33%), PL-2 experienced a 36% decrease in yield despite a stable number of tillers. For PL-1, PL-5, GR-1, and AdvL-2, maintaining the number of tillers also resulted in an unchanged yield (Figure 6).
Discussion
Root features determine plants ability to absorb water and nutrients for their growth, development and grain production [8,32,33,34]. Adventitious roots play a crucial role to overcome nutrient deficiency, providing an increased capacity to adapt to different environments [35,36]. Given that a greater number of adventitious roots may help the plant above-ground portion to better cope with the negative effects of waterlogging [37], tolerance seems to be closely linked to the ability to generate these roots [38]. In response to waterlogging, PL and Austrl varieties, considered the most tolerant among the tested germplasm, exhibited the largest number of adventitious roots (AR). The PLs exhibit the genetic heterogeneity of regional varieties [30] and are part of a wheat germplasm collection [29] that had been grown for generations in Portugal. These locally adapted cultivars are considered a valuable source of variability for breeding programs [27]. As the root system plays a major role in waterlogging conditions, landraces appear to be a solid option for selecting and crossing parental genotypes depicting beneficial root features, aiming the obtention of more adapted ideotypes [27]. In PLs, the ability to emit AR was accompanied by heterogeneity among varieties, both in the number of AR and in emission precocity. This heterogeneity is expected in landraces [27] and constitutes an asset for breeding programs. In Portugal, wheat breeding program has gone through several phases. Between 1950 and 1968, the introduction of Italian germplasm (IT Group) led to the release of the 1st Portuguese variety (Pirana, IT-4). Since the early 60’s a strong cooperation with CYMMIT led to the introduction of germplasm with dwarfism (Rht) genes. Observing also the current advanced lines from the Portuguese Cereal Breeding Program, apparently wheat genetic improvement has not led to a loss of variability in plant root characteristics, namely in root growth angle [33] or the ability to emit adventitious roots in response to waterlogging, as suggested by the results of this study. The observed genotypic variability in AR emission is in agreement with reported results, where wheat sensitive varieties to waterlogging had fewer AR than those tolerant to this stress [32,39].
Regarding tiller number, waterlogging generated decreases (although at different times) in all genotypes, except for PL-1 and Austrl-2, which remained stable. This reduction is consistent with results reported by several authors [17,19,32,40,41,42,43]. However, variability in response to waterlogging was observed. Some genotypes showed an early and strong tiller growth arrest at T7, extended until harvest (IT-1, IT-3, GR-4, AdvL-4), causing severe yield decreases and denoting no tolerance to waterlogging. Other genotypes showed a similar pattern but only from T14 onwards, namely IT-2 and IT-4. Results indicated that all genotypes of IT group were affected with significant reductions in yield (21-71%). With the end of waterlogging, 20 genotypes displayed decreased tillers number at recovery (T7R and/or T14R), suggesting a deleterious effect when oxygen availability is reestablished. This might cause the formation of reactive oxygen species (ROS) due to O2 re-entry in plant tissues, leading to cell membrane damages [40].
In wheat, tillering can occur during the entire growth cycle [44]. In this study, 6 genotypes (PL-1, PL-2, Austrl-1, Ausrl-2, Austrl-3 and Austrl-5) were either unaffected or were able to generate new tillers, achieving values comparable to those of the control plants, or even higher, at the end of growth cycle. According to Xie (2016) [45], tillering ceases just prior to elongation and the remaining axillary buds become dormant. This dormancy, however, can be reversed in response to damage to the main shoot or lodging [46], which is consistent with the observed results and point to some genotypic variability regarding recovery ability following waterlogging Decreased tillers viability may also result from nutrient resources remobilization from late tillers to primary tillers [47]. Additionally, tillers can serve as reservoirs of assimilates for the main culm during growth cycle [48]. This might explain the low tillers value observed in some genotypes (e.g. AdvL-2), reflecting the death of the majority of tillers even under controlled conditions and an emphasis on the main culm’s major contribution to the final yield. Thus, the number of tillers is not necessarily an indicator of fertile spikes being produced. Regarding the Number of productive tillers/Maximal number of emitted tillers ratio (Prod/Max) found for control plants, values are consistent with reports from several authors, who described average mortality rates of 10-80% of all initiated tillers [45,49,50]. Waterlogging strongly influenced the Prod/Max in some genotype, which reached zero in 4 genotypes, reflecting the mortality of all emitted tillers, or values ≤0.5 indicated that half or less of the produced tillers reached maturity, with drastic repercussions on yield. Many studies reported reductions of up to 66% of tillers at maturity when waterlogging was imposed at tillering stage [18]. Among germplasm considered in the present work, several genotypes displayed an increased or unchanged Prod/Max ratio, denoting a good capacity to invest in fertile tillers, even under adverse conditions. Robertson (2009) [19] reported that under waterlogging imposed at tillering, some genotypes reduced the number of initiated tillers, although at maturity presented similar values to WW plants. On the other end, some genotypes started emitting new tillers when waterlogging ended [32].
Yield losses in waterlogged plants ranged from 21% to 87%, which is consistent with values from other studies (ca. 30% to 90% decreases), namely on wheat [18,40,44,51,52,53,54]. Such reductions were observed in 11 genotypes and appear to be closely linked to all tillers death (GR-4, AdvL-1, AdvL-4 and AdvL- 5) or decreased tillers survival. Several authors observed yield reductions under waterlogging as a result of low tiller survival [15,17]. In addition, fewer kernels per spike [19,41,43,55,56] and smaller tillers and kernels [20,21,22], can also negatively affect final yield [16] and must be addressed in future work. The present results highlight 4 genotypes with yield increases in waterlogged plants and 8 that were unaffected by stress. Tian (2021) [57] reviewed the overall change in crop yield induced by waterlogging in 115 studies and found that this stress can increase, decrease or maintain crop yield. They also suggested that this could be due to differences in crop varieties tolerance or sensitivity to shorter/ prolonged waterlogging periods.
This study in bread wheat revealed significant variability in the number and precocity of adventitious roots formed in response to waterlogging, as well as in tillering survival and emission capacity. Such variability was reflected in the observed different yield changes due to 14 days of stress imposed at tillering stage. Differences between germplasm groups from different origins, and within groups, may be a source of genetic material to develop new varieties with distinct root system morphologies, to address climate change-related issues.
Conclusion
Wheat tolerance to abiotic factors is a very important breeding objective under changing climate. This study highlighted variability in adventitious roots (AR), number of tillers and yield in response to waterlogging at tillering stage, in 23 bread wheat genotypes with different genetic backgrounds. Variability occurred between and within the germplasm groups. AR were formed only in plants subjected to stress and differences were found in their number, with a few genotypes showing also earlier AR emission. With waterlogging, some genotypes tillers were affected with effects in final yield. The recovery period seems to be the most critical, with 20 of the 23 genotypes being negatively affected in living tillers number, probably due to oxidative stress onset during aerobic conditions reestablishment. Overall, the PL and Austrl genotypes performed better under waterlogging conditions, while IT genotypes showed an opposite behavior. The large variability found under the studied waterlogging conditions suggests that the selection of tolerant genotypes should focus not only the group they belong to, but also the germplasm as a whole.
To Know more about Agricultural Research & Technology: Open Access Journal
Click here: https://juniperpublishers.com/artoaj/index.php
To Know more about our Juniper Publishers
Click here: https://juniperpublishers.com/index.php


No comments:
Post a Comment