Friday, March 6, 2020

Effect of Different Water Sources on Survival Rate (%) Growth Performance, Feed Utilization, Fish Yield, and Economic Evaluation on Nile Tilapia (Oreochromis niloticus) Monosex Reared in Earthen Ponds-JuniperPublishers

Journal of Oceanography & Fisheries-Juniper Publishers

Abstract

The aim of the present study was to investigate the effect of water source on survival rate %, growth performance, feed utilization, fish yield, economic evaluation and production of Nile tilapia (Oreochromis niloticus) monosex reared in earthen ponds. Nine earthen ponds were used and divided into three categories of three earthen ponds each. The average size of each pond was approximately 5200m2, 6000 monosex all male Nile tilapia were used in each pond and were stocked for 192 days. The fingerlings average weight was 4.38±0.03g/ fish, the fish were fed using a floating feed 25% crude protein, and were fed at a daily rate of 3% of their body weight. Results showed that body weight was increased significantly (P<0.05) with well water to 472.33g/fish. While were 354.17 and 320.17g/fish for fresh and agricultural drainage water, respectively. Specific growth rates (SGR%) increased with well water compared to both fresh and drainage water. Feed conversion ratio (FCR) and protein efficiency ratio (PER) were improved with Agriculture drainage water. Survival rates with fresh and well water were 98.53% and 98.31% respectively, however, was 95.05% with Agriculture drainage water. Total fish yield were affected significantly by treatments. It was 2128, 1921.8, and 2837.7kg at fresh, drainage and well water respectively. Net return arrived to 12996 for well water source when it was 6784LE for agricultural drainage water and 9158LE for fresh water.
Keywords: Water resources; Nile tilapia; Growth per

Introduction

Nile tilapia, Oreochromis niloticus (Linnaeus) is one of the most important freshwater fish in world aquaculture [1]. It is widely cultured in many tropical and subtropical countries of the world [2]. Rapid growth rates, high tolerance to adverse environmental conditions, efficient feed conversion, ease of spawning, resistance to disease and good consumer acceptance make it a suitable fish for culture [3]. Farmed tilapia production increased semi dramatically in recent years, increasing from 383,654mt in 1990 to 2,326,413mt in 2006 [4]. Tilapia has established a secure position in a number of water impoundments of India. But, its performance in open water ponds of the country has been discouraging over the years [5]. For tilapia aquaculture is excessive reproduction and the resulting small size of the fish produced.
Egypt has suitable natural conditions for desert aquaculture. Egypt has vast resources of groundwater [6]. Fresh groundwater resources in Egypt contribute 20% to the potential water resources in Egypt. One of the groundwater resources is the Nile Valley and Delta system with the storage capacities of 200 billion m3 and 300 billion m3, respectively. Oasis water in the west desert, Bahariya, Farafra, Dakhla, Kharga, and Siwa, were established from underground natural wells and springs.
With the prohibition of the establishment of fish farms on agricultural land, with the prohibition of the use of Nile water for fish farming, with increased competition for spaces adjacent to the lakes and sources of agricultural drainage water, despite its disadvantages, has caused the possession of new fish farm in the Nile [7]. Valley of the most difficult things and out of reach. Hence the search for an alternative to invade the desert, especially with the development of methods of fish farming and providing the requirements of education and with the provision of underground water of the highest purity with different salinity (fresh & brackish & marine) and where the trained professionals are available [8]. In the hope to produce clean fish with improved quality and cheaper than other animal proteins we conducted the present research in a private fish farm located in the desert belonging to Noubaria Agricultural Development company (Ragab Farms) aiming to study the effect of water source on survival rate (%) growth performances, feed conversion ratio, protein efficiency ratio, annul fish yield and profitability Nile tilapia (Oreochromis niloticus) monosex commercial farming.

Materials and Methods

Water Source

Three types of water sources: fresh water, agricultural drainage water, and well water were compared in the present experiment. Water supplies were replaced three times during the experimental period (192 days).

Experimental design

Nine earthen ponds (5200m2) were used in these experiment were divided into three categories of earthen ponds even three ponds represent one treatment (fresh water, drainage water and well water.

Stocking density

6000 monosex all male Nile tilapia (Oreochromis niloticus) fingerlings of average weight (4.38±0.03g/ fish) were stoked in each pond on April 11, 2007 and observed through October 19, 2007. The area of each pond 5200m2.

Experimental Fish

Fingerlings of all male Nile tilapia (Oreochromis niloticus) monosex were collected from Noubaria Agricultural Development Company (Ragab Fish Hatchery) and were over wintered in earthen ponds to provide suitable fingerlings for the beginning of the growing season. All ponds in this experiment were sampled monthly using a cast net method. Sample sizes were 1% of the stocked numbers and the average individual fish weight was calculated to determine growth rates. Then, with these calculations, the feed amounts were adjusted for the following month.

Experimental diet

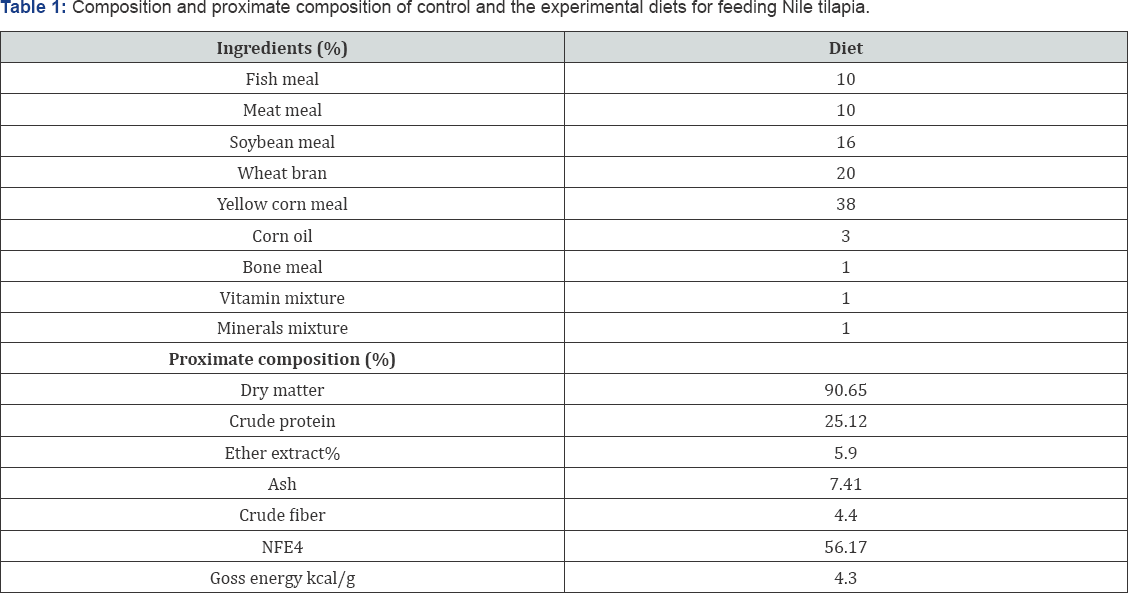
The floating commercial diet used in this experiment was fed at a daily rate of 3% of the fish body weight by using self feeders The ingredients of the commercial diet used in the experiment is presented in (Table 1). The dietary composition of vitamin and mineral premix is listed in. Fish were fed a floating ration for 6 days per week. Feeding rate was adjusted monthly based upon the calculated biomass of fish obtained through the monthly sampling and assumption of 100% survival.

Water quality

Physical parameters: Water temperature °C was determined at every days in the experiment.
Chemical Parameters: Samples for determination of dissolved oxygen (DO) were immediately fixed after sampling and DO concentration was determined according to Winkler's technique. Methods described by Golterman et al. [9] were used in determination of ammonia. Also pH was measured by digital pH meter (Orion model 720 A, s /No 13602) in all experiments.
Chemical Analysis of the commercial of Diet: Chemical analysis of the commercial diet used in the experiment was done according to AOAC (2000) as shown in Table 1.
Growth parameters and Statistical analysis: Data on growth, feed utilization, survival rate and proximate and chemical composition of whole fish body were subjected to one-way ANOVA [10]. To locate significant differences between fish size within different water resources of pond. Duncan's multiple rang test [11] was done. All percentages and ratio were transformed to arcsine values prior to analysis [12].

Results and Discussion

Experimental diet

The commercial diet used in the present experiment contained 25% CP and 4.3kcal/g gross energy (Table 1). Although there are large variations in the data available about the optimum protein level for tilapias which range between 20 and 40% crude protein [13-15] practical diets as low as 25% protein was successfully used for rearing monosex tilapia [3].
Vit. A 8000 I.U. Vit. D3 4000 I.U.; vit. E 50mg; Vit. k3 19mg;
Vit. B1 40mg; vit. B2 25 mg; Vit. B6 125mg; vit B12 69mg;
Pantothenic acid 40mg; Nicotinic acid 125mg; Folic acid 400mg;

Water quality

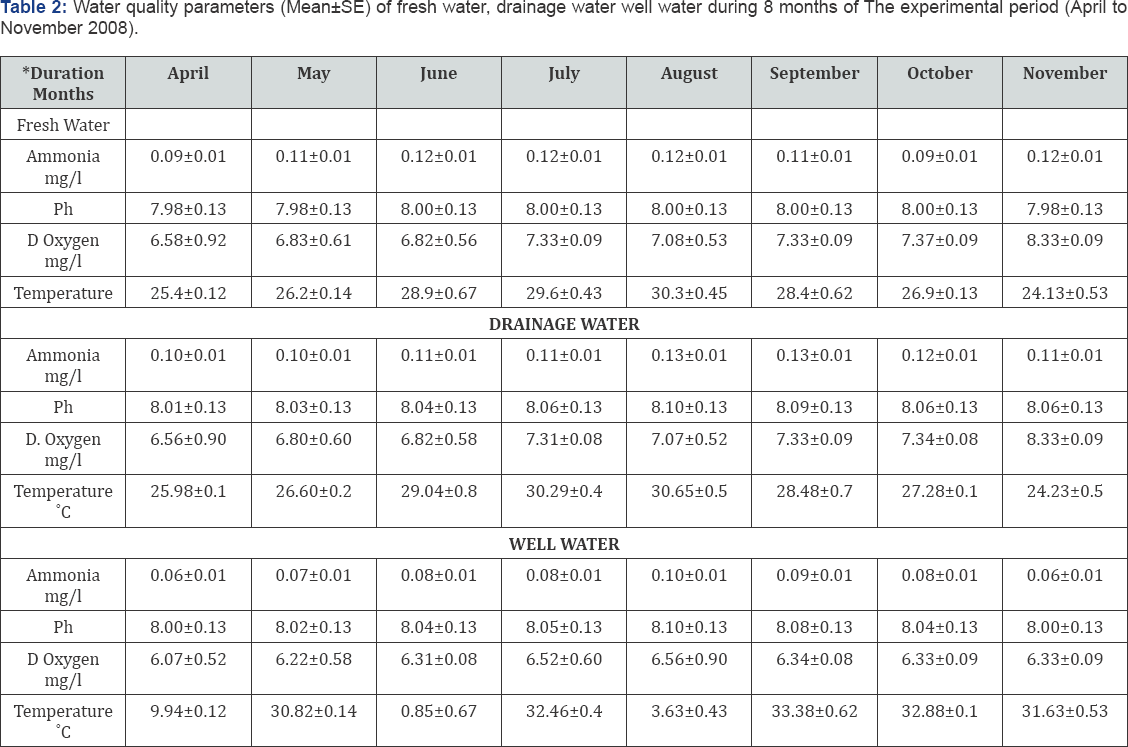
Collected data on water temperature and dissolved oxygen (DO), pH and ammonia are summarized in Tables 2-4. Water temperature throughout the present experiments ranged between 24.13±0.53 and 30.26±0.45 °C in fresh water experiment, 24.23±0.53 and 30.65±0.53 °C in drainage water experiment and between 29.94±0.12 and 33.63±0.43 in well water experiment which was the high temperature and closely related to the average of optimal value for tilapia (28-30 °C). Our results were agreement with Broussard [16] reported that tilapia as a warm water fish that dominate African lakes, are known to grow well in high temperature. The fluctuation of water temperature are reached its maximum values during August, however its minimum were during April and November.
*Each value was on average of four sub samples
Biotin 20mg; cholin chloride 80 mg; copper 400mg; Iodine 40mg;
Iron 120mg; Manganese 220mg; Zink 22mg; Selenium 4mg

Means in the same column having different letters are significantly different (P<0.05).

Overall means of water dissolved oxygen (DO) throughout the present experiment were 7.20±0.37mg DO/I for fresh water, 7.19±0.36mg DO/I for drainage water and 6.33±0.36mg DO/I for well water. The fluctuation of water dissolved oxygen (DO) showed that the maximum values of DO were obtained in November for the fresh and drainage water and August in well water, however, the lowest values were in April. In general, dissolved oxygen levels were within the high standards and higher than cited by Boyd [18] for good production of tilapia (4.20 to 5.90mg DO/I) in aquaculture ponds. One of the most important environmental factors is dissolved oxygen. It is considered a limiting factor for success or failure in intensive culture. An excellent aquaculture attribute of tilapia is their tolerance to low dissolved oxygen concentration [16]. The dissolved oxygen content in earthen ponds depends on the pond water temperature, fish biomass and rate of water exchange [18]. Chervinski [19] reported that O. niloticus survived short term exposure to 0.1mg DO/ l. However, Collins [20] observed in a review on oxygen concentration of various studies, that growth rate of non-salmonid fish was increasingly depressed as dissolved oxygen fall below 50% saturation. Rappaport et al. [21] reported that growth of carp was reduced by predawn dissolved oxygen less that 25% saturation. Tichert-C & Green [22] compared the growth of tilapia monosex in earthen ponds aerated or unaerated at 10 or 30% saturation of dissolved oxygen. They found that tilapia production and final weight were significantly greater in aerated ponds than unaerated ponds.
The water pH values throughout the present experiments ranged between 8.00±0.13and 8.10±0.13 with an overall mean of 8.04±0.13 in fresh water and ranged between 8.01±0.13 and 8.10±0.13 with an overall mean of 8.05±0.13 in drainage water and ranged between 7.98±0.13and 8.01±0.13 with an overall mean of 8.00±0.13 in well water. The fluctuations of pH reach the highest value of 8.10+0.13 during August in fresh and drainage water and 8.01+0.13 in well water. The results showed that the present pH values are suitable. For rearing tilapia monosex in earthen ponds. Johnson [23] recommended the range of pH 6.5 to 9.0 for most of freshwater fish species.
The water un-ionized ammonia (NH3) throughout the present experiments ranged between 0.09±0.01 and 0.12±0.01 with an overall mean of 0.11±0.01 in fresh water and ranged between 0.10±0.01 and 0.13±0.01 with an overall mean of 0.11±0.01 in drainage water and ranged between 0.06±0.01 and 0.10±0.01 with an overall mean of 0.077±0.01 in well water. The fluctuations of un-ionized ammonia reach the highest values of 0.13mg/ l during August. Unionized ammonia concentrations in the experimental ponds generally remained below levels which would cause chronic toxicity problems in tilapia. Tilapia is more tolerant to elevated levels of ammonia than more other sensitive species such as salmonids [23]. Some tilapias have been shown to acclimate to higher levels of ammonia after chronic exposure to low levels [24]. Johnson [23] showed that levels of un-ionized ammonia which may adversely affect growth in tilapia range from 1mg/ l to 2mg/ l ammonia where temperature and pH are within normal range.

Growth performance of tilapia monosex

Mean weight: Results of the present study showed that the mean weights at all rearing intervals different significantly (P<0.05) during all the experimental periods (Table 5 & Figure 1). Averages of fish body weights for fresh water, drainage water and well water were found to be 23.16, 18.66 and 25.16g, respectively after the 1st month of stocking. The statistical evaluation of results indicated that live weights at this period increased significantly (P<0.05) with using well water. A similar trend was also observed in fish body weights during the other growing periods. At harvest average body weight of fish stocked at well water was significantly (P<0.05) higher than that of fish stocked in fresh or drainage water, which indicates that weights fish were decreased in fresh and drainage water with increasing for used well water at harvest were 354.17g, 320.17g and 472.33g for fresh, drainage and well water, respectively. This significant advancement in fish body weights with increasing at higher temperature of water advocated by Azaze et al. [25] reported that the final mean weight was significantly higher at 26 and 30 °C than at 22 and 34 °C. This finding agrees with our results.
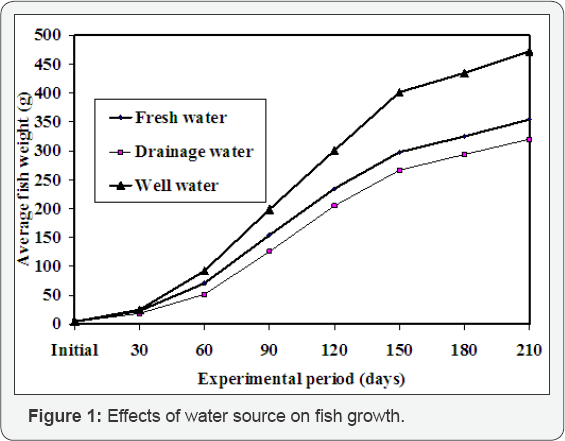
Average daily gain (ADG g/day): Results presented in Table 5 revealed that water sources, affected significantly (P<0.05) ADG during all experimental periods tested (30, 60, 90.120.150.180 and 210 days after start). In general these results indicated that the well water favored significantly ADG of the tilapia monosex in intensive culture system. The results of this point were in agreement with those found by [17] who grew O. niloticus from 49g to 271g in 122 days (1.4%/day). Siddiqui et al. [15] found that ADG of tilapia O. niloticus reared for 98 days at different water exchange in outdoor concrete tanks was 1.06g / day at 30% dietary crude protein. In the present study the average daily gain was higher with 25% crude protein at all treatments. However, the optimal feeding rate depends on fish size and Specific Growth Rate (SGR %): Results presented in Table 5, revealed that water sources, affected significantly (P<0.05) SGR% during all experimental periods tested (30, 60, 90.120.150.180 and 205 days after start). In general these results indicated that the well water, favored significantly (P<0.05) SGR% of the tilapia monosex in intensive culture system.
During all tested experimental periods tested (30, 60, 90.120.150.180 and 205 days after start) SGR% increased significantly (P<0.05) in almost linear manner in the well water than fresh and drainage water In the present study SGR% values in case of well water continuously higher than fresh or drainage water in all experimental periods. This may be due to the higher temperature of the well water (average 31.94 °C) compared to 27.47 and 27.81 °C for fresh and drainage water, respectively. The results obtained in SGR% are in agreement with those found by Eid & El Denasoury [27] who indicated that increasing temperature from 16 °C to 27 °C improve growth rate of Nile tilapia, which using well water.
Feed conversion ratio (FCR): Results presented in Table 5, show that there were significant (P<0.05) effects of water sources on FCR, feed conversion ratio was observed at harvest was 2.87 at fresh water, followed by 2.83 at well water and 2.80 at drainage water and 2.94 for 1700m2 followed by 2.89 for 4000m2 followed by 2.75 for 5200m2 and was 2.57 for 6000 fish/ acre, 2.75 for 8000 fish/ acre and 2.78 for 10000 fish/ acre. The analyses of variance of the FCR values are presented in Table 5. The FCR is affected by the physiological state of the fish, environmental condition, [28]. Lovshin et al. [29] found that FCR for all male tilapia in earthen ponds was higher (4.3) than when compared with all male and female tilapia in earthen ponds (FCR=7.2). while, fish growth is affected by the amount of feed consumed and the efficiency of assimilation [30].
Protein efficiency ratio (PER): Results of protein efficiency ratio (PER) are presented in Table 5, There were significant (P<0.05) effects of water sources, on PER, it improved significantly (P<0.05) with each increase in pond sizes and decrease stocking density throughout the experimental periods. The best PER observed at harvest was 1.42 with drainage water, followed by 1.40 at well water and 1.38 at fresh water Nyina-W et al. [31] confirmed that when protein supply is appropriate (400500g protein/kg feed for percid fish), different lipid contents in feeds do not have an impact on the rearing results of pikeperch.
Fish survival rate: Results in Table 6 showed that survival rates were changed significantly (P<0.05) by water resources, in fresh and well water were insignificantly (P<0.05) different but survival of the fish in drainage water was 95.05% which was less than survival rates in both fresh water and well water indicating the probable effect of some faction of water quality.
Fish yield: Results of Table 4 show fish yield (kg) per acre as affected by water sources,. Results revealed that total yield increased significantly (P<0.05) with well water. The total production was found to be 133.34% and 90.31% for well water and drainage water, respectively, while it was found to be 76.33% and 68.84% for 4000m2 and 5200m2.
The results of the present experiment were similar to those of Tal & Ziv [32] who showed that the net yield of tilapia monosex in earthen ponds was 16750Kg /ha (7035.0kg/ acre) after 100 days of stocking of 80.000 fish/ha, (33600 fish/acre, 8 fish/m2) on the other hand Eid & Denasoury [27] indicated that increasing temperature from 16 °C to 27 °C improved growth rate of Nile tilapia. Watanabe et al. [33] found that growth rates generally increase with increasing temperature and where markedly lower at 22 °C and well water is the best because the temperature constant through the year and the best quality of the water. [34] found the higher yield obtained in small pond sizes because the bigger ponds with greater surface area were more difficult to manage and often resulted in lower fish yields.
All fish species are characterized by an ideal range of temperature in which they show their maximum growth [3537]. Several studies have been reported that the specific water temperature range showed the faster growth in Pikeperch, Sander lucioperca at 20 °C to 25 °C [38-40]. Low temperature causes sluggishness by retarding the digestion speeding of fish [41]. Some researchers have found that the digestion rate has been increased as the temperature increases [42]. Environmental temperature is one of the most important ecological factor which also influence the behavior and physiological process of aquatic animals [43].
One of the major advantages of groundwater sources is their constant temperature throughout the year. Shallow sources of groundwater approximate the mean air temperature of the area. The chemistry of groundwater is directly dependent on the geology of the area surrounding the source. In limestone areas, groundwater is hard, and high in calcium and carbon dioxide [44]. In areas of granite formation, the groundwater tends to be soft, low in dissolved minerals and carbon dioxide. As will be discussed later, there are advantages and disadvantages to both, emphasizing the need for early extensive water quality testing.
Water temperature has substantial effect on fish metabolism. In response to decreasing of water temperature the enzyme activity of tissues have been increased [45]. Velmurugan et al. [46] have investigated that histopathological and tissue enzyme changes of C. gariepinus exposed to nitrite when water temperatures changes from 27 °C to 35 °C. In a stressful and unfavorable environmental condition GPT and GOT may increase in blood serum. In the present study serum GPT and GOT level were affected by different water temperature. Serum GPT and GOT amount in different fish fed at 20 °C are comparatively lower than those of fish fed at 16 °C and 24 °C experiments (Tables 1-3). These results indicated that 20 °C may be a favorable water temperature for better growth of 16g juvenile Korean rockfish [47,48].

To know more about Juniper Publishers

Thursday, March 5, 2020

Cytotoxicity Effects of LPR-1®, CCE100 and ONCOBLOC® on a Panel of Cancer Cell Lines-JuniperPublishers

Journal of Complementary Medicine & Alternative Healthcare-Juniper Publishers

Abstract

LPR-1®, CCE100 and ONCOBLOC® are LPR-1® Standardized C. militaris (L.) Link Extract (LSc 1501) Conventional Cordyceps extract (100X concentration) and ONCOBLOC® standardized novel C. militaris (L.) Link extract (SLS-161), respectively. All these three extracts are obtained from C. militaris through conventional and proprietary extraction processes. These extracts possess a broad spectrum of chemoprotective properties against free radicals and oxidative stress. In this study, the cytotoxicity ONCOBLOC® were assessed against 24 human cancer cell lines using MTT of LPR-1®, CCE100 and cytotoxicity assay. In addition, the cytotoxic effects of these extracts were benchmarked to chemotherapy drug, doxorubicin on a panel of cancer cell lines. From the results obtained, LPR-1® showed cytotoxicity to HONE-1, NCI-H23 and Fa Du cells; CCE100 caused cytotoxicity to HONE-1, Fa Du, T-47D, MCF-7 and U-2 OS cells; whereas ONCOBLOC® exhibited cytotoxicity to HONE-1, FaDu, T-47D, MDA- MB-231 and K-562. Among the 24 cancer cells, ONCOBLOC® showed the strongest cytotoxic effects against nasopharyngeal carcinoma epithelial cell line (HONE-1), with the IC50 value of 15.34^g/mL. These preliminary results suggest that ONCOBLOC® possesses promising anti-cancer activities and could be developed as a novel anticancer agent. Hence, more efficacy studies will be carried to confirm its anti cancer properties.
Keywords: Cytotoxicity; C. militaris; LPR-1®, CCE100, ONCOBLOC®

Introduction

LPR-1® and ONCOBLOC® were extracted by using SINGAPORE LINK SCIENCES PTE LTD�s proprietary protocol LSc 1501 and SLS-161, respectively. Proprietary extraction refers to the combination use of formulated extraction solvent, proprietary extraction process protocol and customized fabricated extraction equipment. LPR-1® is currently available in the market and is being marketed for the application on organ-ageing associated conditions, it is also prescribed by endocrinologists for kidney and diabetic related conditions. CCE100 is Conventional Cordyceps Extracts with 100X concentration. Conventional extraction refers to the use of 100% water as the sole extraction solvent, followed by air-drying of the extracts. This is done repeatedly to achieve a 1:100 weight/weight ratio of the initial versus final extract. CCE100 is prepared as a benchmark for comparison of conventional extract against targeted extracts LPR-1® and ONCOBLOC® is developed and formulated for oncology-related (adjuvant) applications. C. militaris has been reported to have the medicinal beneficial on improving male reproduction [1], anti-aging [2], immunomodulatory [3], anti-microbial [4], antibacterial [4], anti-viral [5], anti-fungal [5], insecticidal [5], larvicidal [6], anti-fibrotic [7], anti-diabetic [8], anti-HIV [9], anti-malarial [10], anti-fatigue [11], anti-platelets aggregation [12], neuroprotective [13], liverprotective [14], reno-protective [15,16], as well as pneumo-protective [17]. C. militaris contains many active compounds, such as cordycepin, polysaccharides, ergosterol and mannitol [18]. The major bioactive compound cordycepin (3'-deoxyadenosine) might contribute to anticancer activities. The anticancer activities of cordycepin have been reported by other researchers, such as, anti-angiogenetic [19,20], anti-inflammatory [21], anti- oxidant [22], growth inhibition on U937 leukemia cells [23], anti-leukemic [24], anti-tumour [25], anti- proliferative [26], anti-metastatic [27,28], inhibit purine biosysnthesis, DNA/RNA biosynthesis, shut down mTOR signalling pathway [29], induce apoptosis [30] and regulate cell cycle [31].
The cytotoxic effects of LPR-1®, CCE100 and ONCOBLOC® on various cancer cells are yet to be studied. Thus, this study aims to evaluate the cytotoxicity of LPR-1®, CCE100 and ONCOBLOC® against 24 cancer cell lines using MTT assay. The 24 cancer cell lines tested were acute promyelocytic leukaemia cell line (HL60), chronic myeloid leukaemia cell line (K-562), lymphoma cell line (Raji), gastric carcinoma cell line (SNU-1), retinoblastoma cell line (WER1-Rb-1), two prostate adenocarcinoma cell lines (LN-CaP and CAHPV 10), three breast cancer adenocarcinoma cell lines (T-47D, MDA-MB-231, and MCF-7), non- small cell lung carcinoma cell line (NCl-H23), nasopharyngeal carcinoma epithelial cell line (HONE-1), upper aerodigestive tract carcinoma cell line (HSC-2), oral squamous cell carcinoma cell line (HSC-3), tongue squamous cell carcinoma cell line (HSC-4), hypopharyngeal squamous carcinoma cell line (FaDu), cervical adenocarcinoma cell line (HeLa), Uterus/Leiomyosarcoma cell line (SK-UT-1B), hepatocellular carcinoma cell line (HepG2), renal cell adenocarcinoma cell line (ACHN), melanoma cell line (SK-Mel-28), neuroblastoma cell line (lMR-32), osteosarcoma cell line (U-2 OS) and nasopharyngeal carcinoma cell line (TW04). The cytotoxicity effects of LPR-1®, CCE100 and ONCOBLOC® were benchmarked with doxorubicin, a standard chemotherapeutics drug on 24 cancer cell lines. The most active extract will be further studied on its anti-cancer, anti-tumour- promoting and anti-inflammatory effects before developed it as a potential cancer preventive agent.

Materials and Methods

Preparation of LPR-1®, CCE100, ONCOBLOC® and Doxorubicin

LPR-1®, CCE100 and ONCOBLOC® were provided by LINK (THM) SCIENCES PTE LTD (Singapore). LPR-1® is in pellet form whereas CCE100 and ONCOBLOC® are in powder form. All three samples were soaked in water, sonicated and filtered through PTFE 0.45μm membrane filter to obtain the supernatant of LPR- 1®, CCE100 and ONCOBLOC®. The supernatant collected was then freeze-dried. The dried extracts were then dissolved in water for preparing the concentrations needed in this experiment. The concentrations of LPR-1®, CCE100 and ONCOBLOC® were prepared at 3.125, 6.25, 12.5, 25, 50 and 100μg/mL. The cytotoxic effects of these extracts were benchmarked with doxorubicin that was purchased from Sigma-aldrich (USA). The concentrations of doxorubicin were prepared at 0.125, 0.25, 0.5, 1, 2 and 4μg/mL.

Determination of Optimal Cell Seeding Concentration

Optimum cell seeding density of each cell line was determined prior to MTT assay. A total of 1x10⁶, 5 x10⁵, 1 x10⁵, 1 x10⁴ and 1 x10³ cells/ml of cells were seeded in each well accordingly in a 96-well plate. The cells were incubated for 72 hours prior subjected to cytotoxicity evaluation by MTT assay. Absorbance of each well was read at 570 nm. Absorbance versus cell density graph was plotted to determine the optimum cell concentration of each cancer cell. The optimum cell concentration was obtained from the middle point of exponential phase of each graph plotted for each cell line. The optimum cell concentration for each cell line obtained was served as the cell seeding concentration for cytotoxicity evaluation.

MTT Assay

LPR-1®, CCE100, ONCOBLOC® and doxorubicin were tested for cytotoxicity against 24 cell lines. A total of 100μL of cells at the optimum cell concentration were seeded into each well of 96-well plate. Three wells containing medium only were included as a negative control. After 24 hours of incubation, each well was added with 100μL mixture of fresh medium containing respective extracts (LPR-1®, CCE100, ONCOBLOC® or doxorubicin). The concentrations of LPR-1®, CCE100 and ONCOBLOC® tested were at 3.125, 6.25, 12.5, 25, 50 and 100μg/ mL, whereas, the concentrations of doxorubicin tested were at 0.125, 0.25, 0.5, 1, 2 and 4μg/mL. The plate containing culture was then incubated for 72 hours. After 72 hours of incubation, 20μL of MTT was added into each well and incubated for another 4 hours. After 4 hours of incubation, the plate was centrifuged at 3000 rpm for 5 minutes. A total of 140 μL medium was carefully removed from each well. A total of 100μL iso-propanol was then added into each well and swirled gently at room temperature in the dark for 15 minutes. The absorbance of each well was read at 570 nm. The assays were conducted in triplicate and repeated in three independent experiments. The average absorbance against number of cells/mL graph was plotted and 1C50 value was calculated.

Results and Discussion

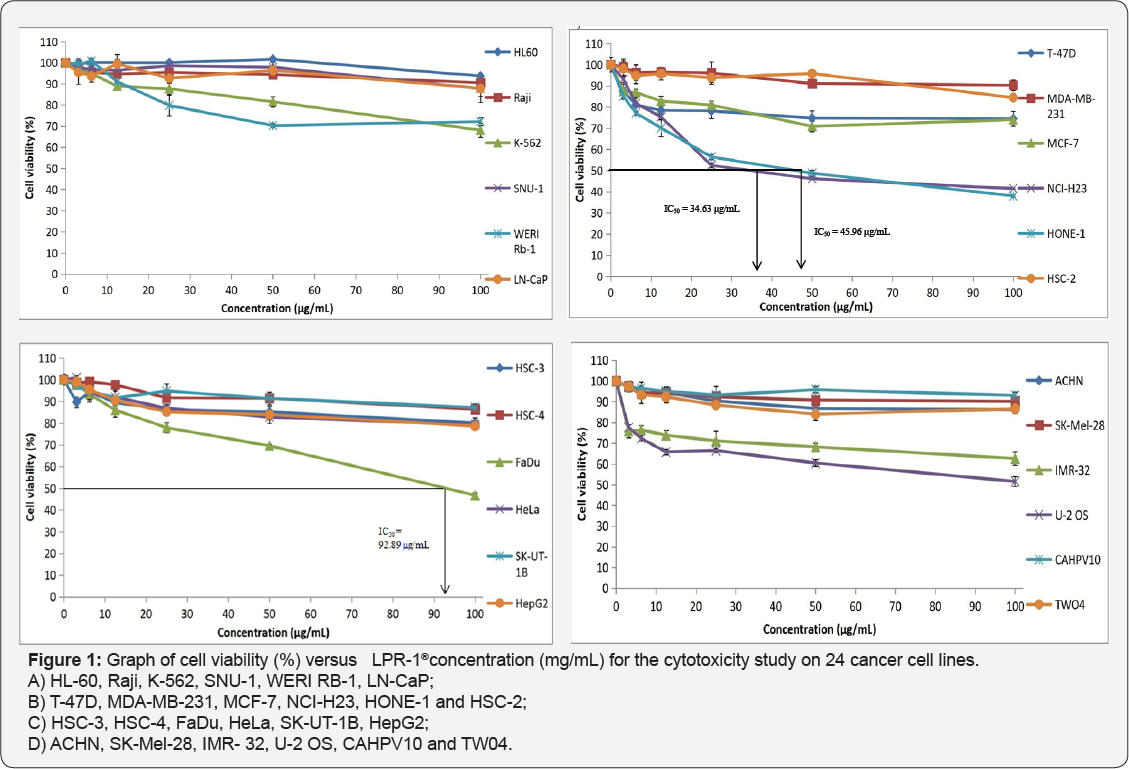
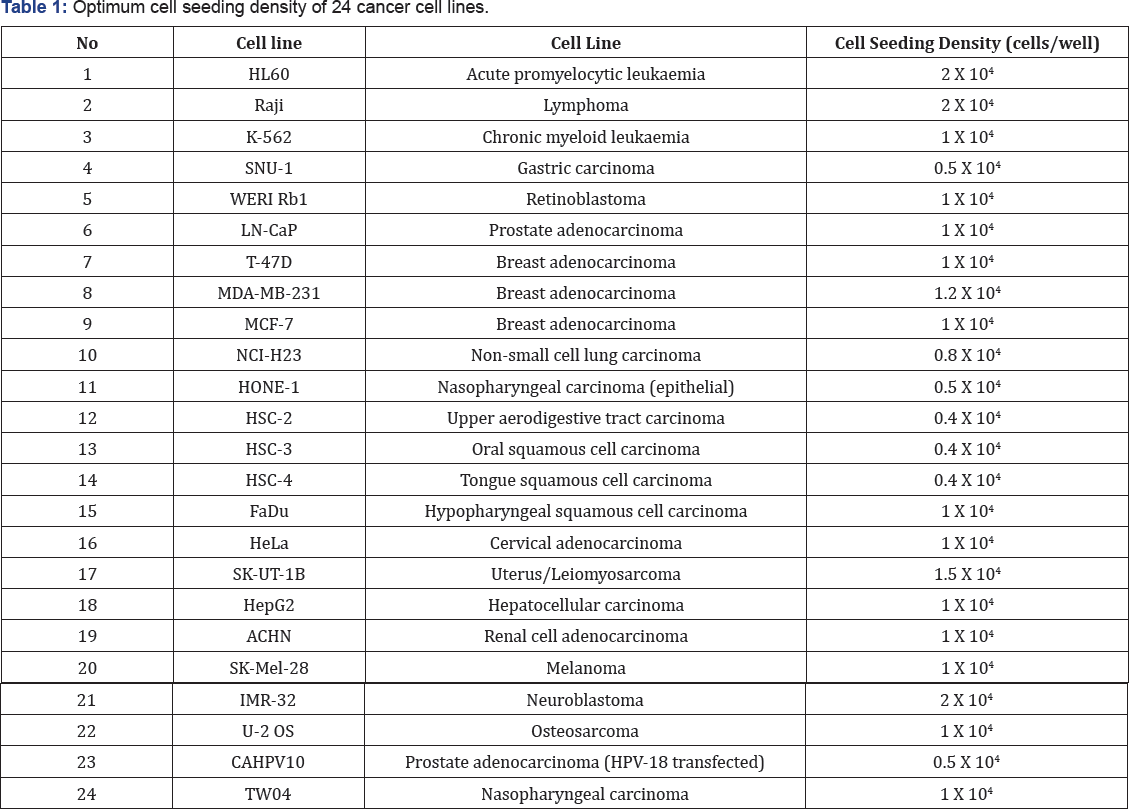
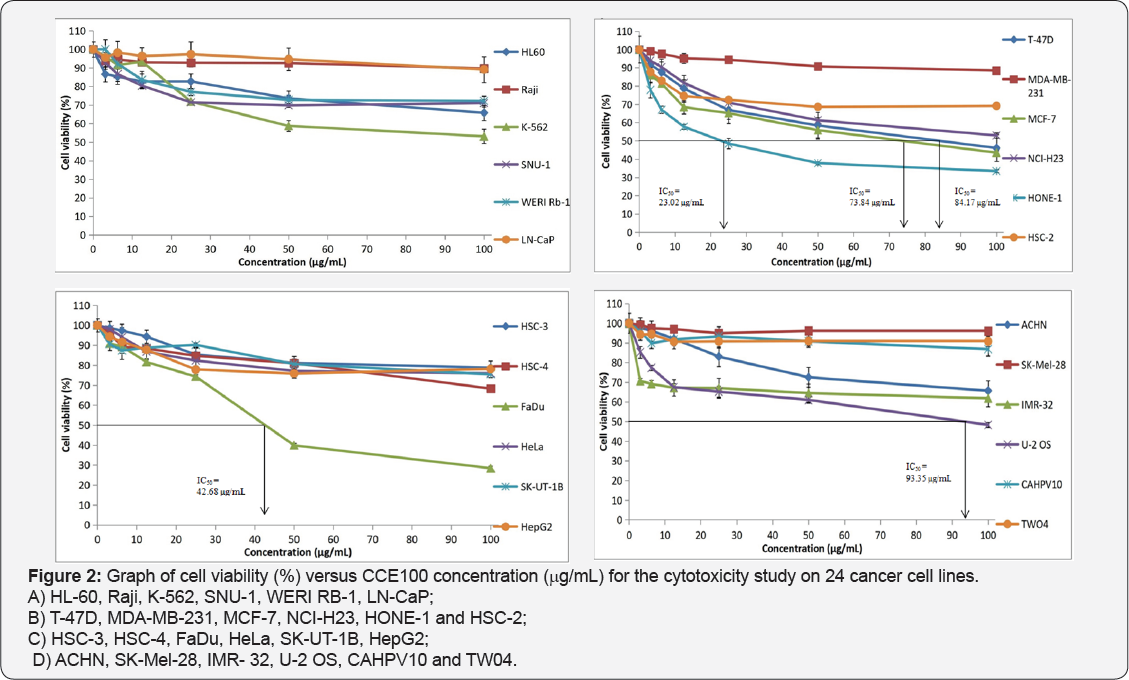
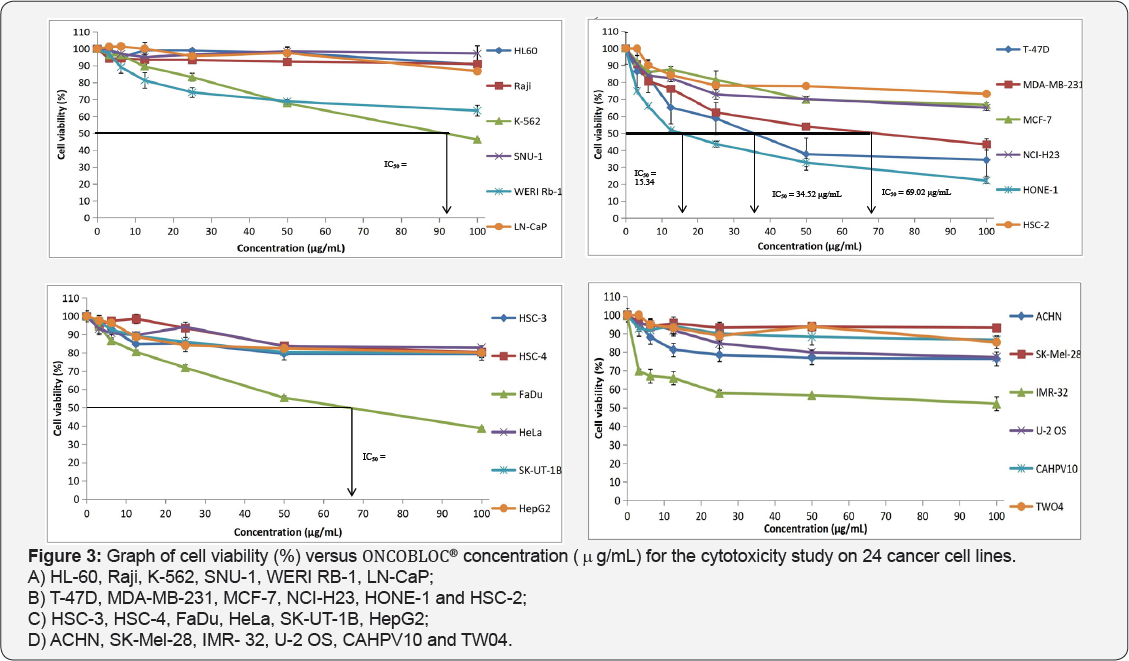
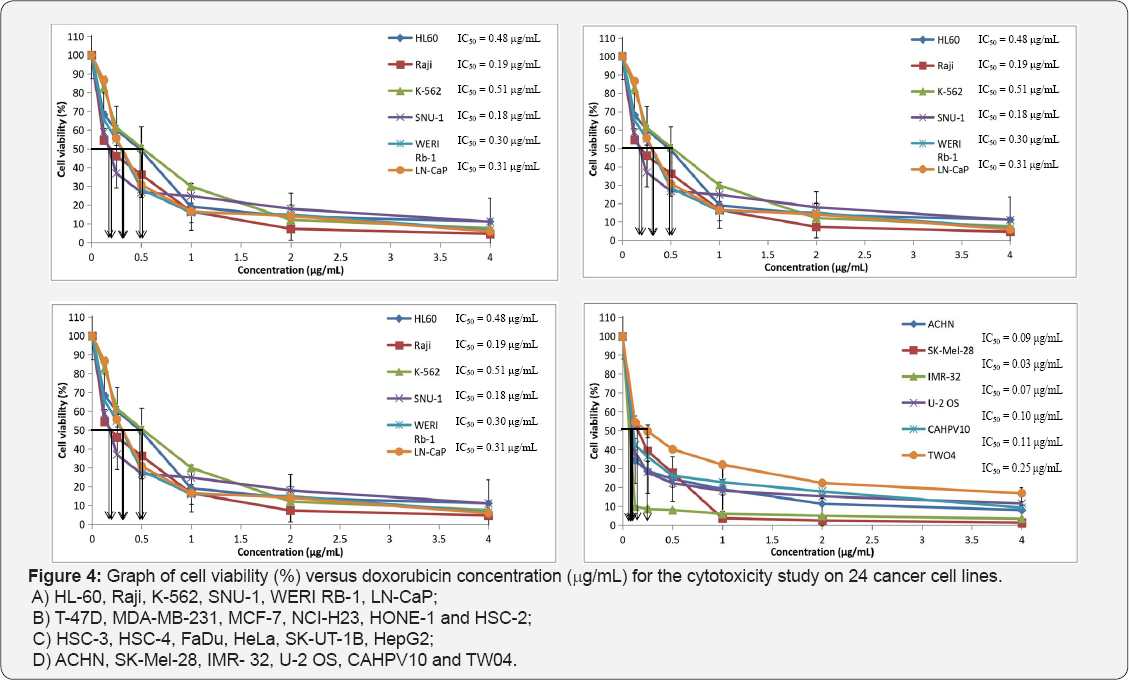
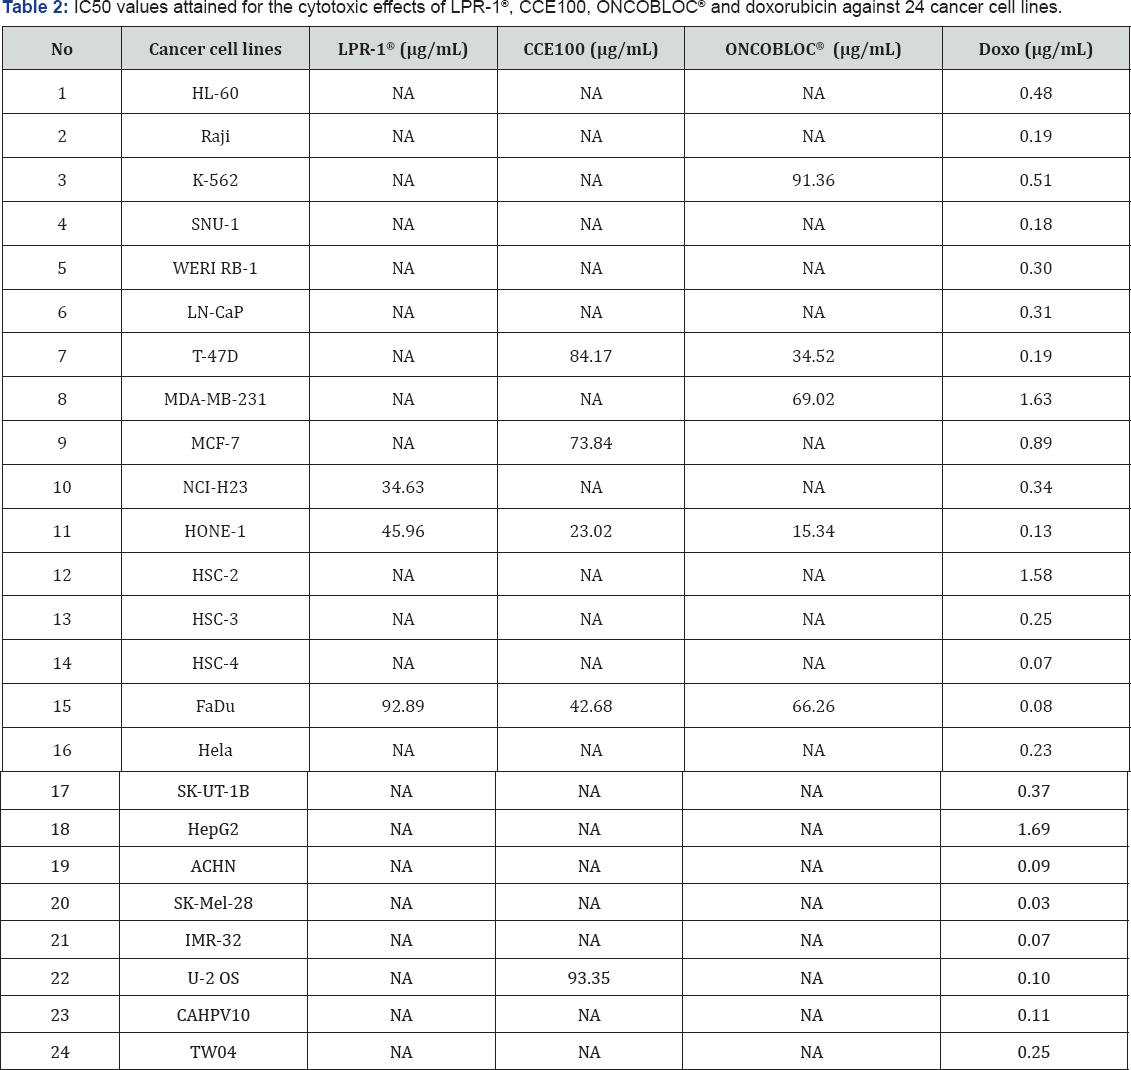
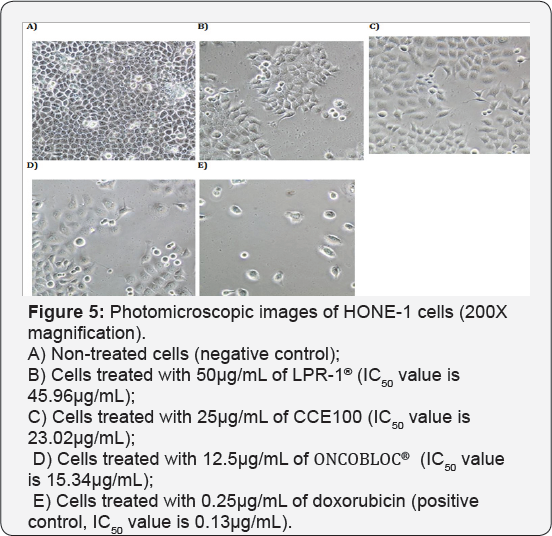
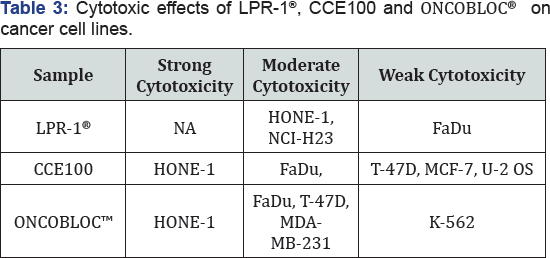
Table 1 displays the results obtained for the optimum cell seeding density of each cell line. The optimum cell seeding density of each cell line was ranging from 0.4 X 10⁴ to 2 X 10⁴ cells. The 1C50 values for the cytotoxic effects of LPR-1®, CCE100, ONCOBLOC® and doxorubicin evaluated are indicated in Figures 1-4, respectively and summarised in Table 2. The results obtained indicate that the three extracts of LPR-1®, CCE100 and ONCOBLOC® exhibited different cytotoxic effects towards different kinds of cancer cells, which is categorized as weak, moderate, and strong cytotoxic effects (Table 3). From the results obtained, ONCOBLOC® showed the strongest cytotoxic effects towards HONE-1 with the 1C50 value of 15.34μg/mL, followed by CCE100 with the 1C50 value of 2 3.02μg/mL. LPR-1® exhibited moderate cytotoxic effect towards HONE-1 and the 1C50 value obtained was at 45.96 μg/mL. Figure 5 shows the images of HONE-1 cells treated with LPR-1®, CCE100, ONCOBLOC® and doxorubicin. Meanwhile, both CCE100 and ONCOBLOC® showed moderate cytotoxic effects towards FaDu with the 1C50 values of 42.68 and 66.26 μg/mL, respectively. LPR-1® exhibited weak cytotoxic effect towards FaDu and the 1C50 value attained was at 92.89 μg/mL. Figure 6 shows the images of FaDu cells treated with LPR-1® CCE100, ONCOBLOC® and doxorubicin.


Note: NA = Nonachievable, the IC50 values cannot be obtained due to the cytotoxic effects are above 50% cell death

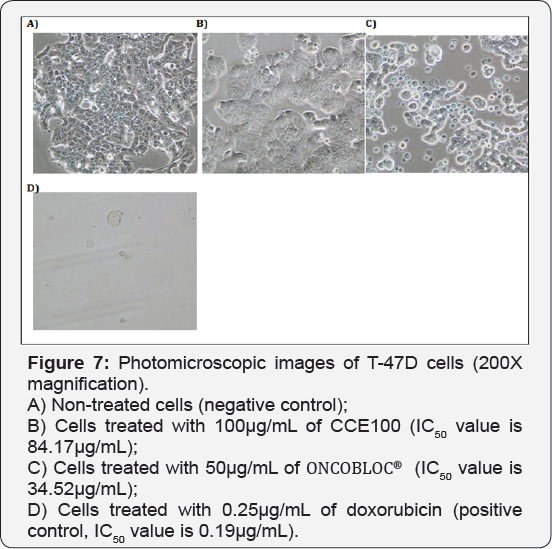
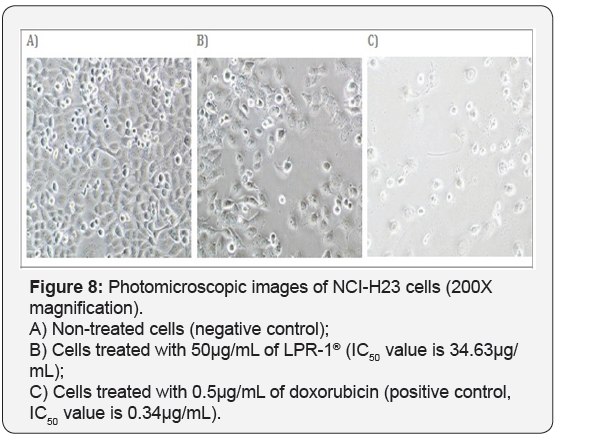
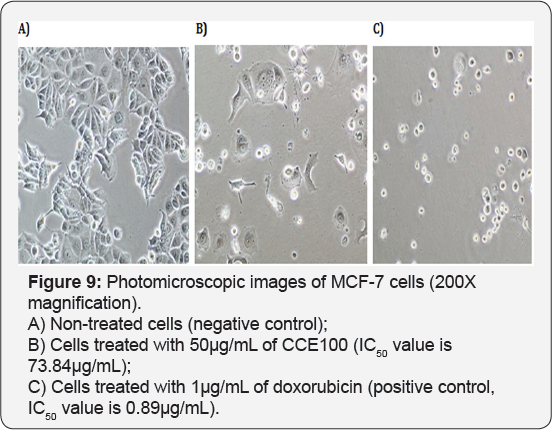
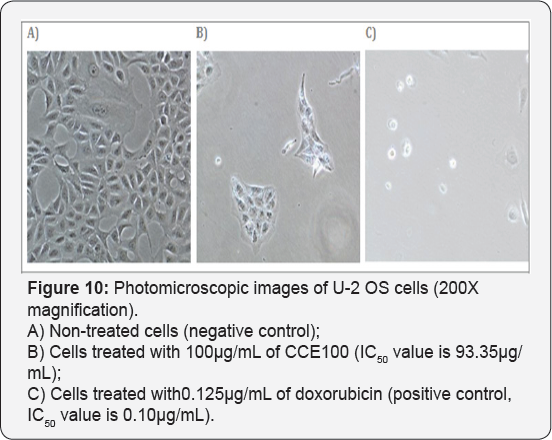
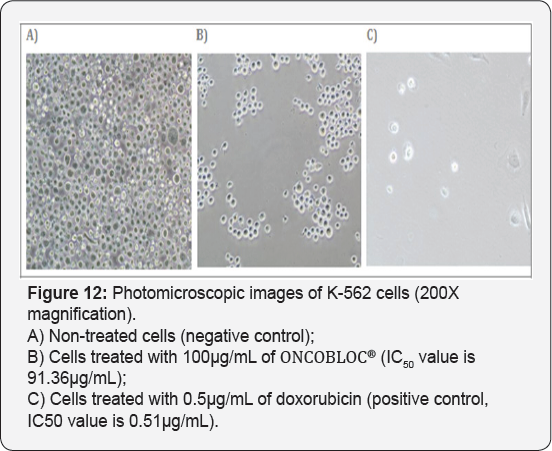
For T-47D cell line, CCE100 showed weak cytotoxic effects with the IC50 value of 84.17 μg/mL, whereas ONCOBLOC® exhibited moderate cytotoxic effect with the IC50 value of 34.52 μg/mL. Figure 7 shows the images of T-47D cells treated with CCE100, ONCOBLOC® and doxorubicin. LPR-1® exhibited moderate cytotoxic effect towards NCI-H23 and the IC50 value obtained was at 34.63 μg/mL. Figure 8 shows the images of NCI-H23 cells treated with LPR-1® and doxorubicin. CCE100 exhibited weak cytotoxic effects towards MCF-7 and U-2 OS cells with the IC50 values of 73.84 and 93.35 μg/mL respectively Figures 9,10 show the images of MCF-7 and U-2 OS cells treated with CCE100 and doxorubicin, respectively. ONCOBLOC® showed moderate cytotoxic effect towards MDA-MB-231 with the IC50 value of 69.02 μg/mL. Figure 11 shows the images of MDA-MB-231 cells treated with ONCOBLOC® and doxorubicin. Meanwhile, ONCOBLOC® showed weak cytotoxic effect towards K-562 with the IC50 value of 91.36 μg/mL. Figure 12 shows the images of K-562 cells treated with ONCOBLOC® and doxorubicin.
Note: Strong cytotoxicity = IC50 value < 30 μg/mL; Moderate cytotoxicity = 30 μg/mL < IC50 value ≤ 70 μg/mL; Weak cytotoxicity = IC50 value > 70 μg/mL; NA = Nonachievable
The findings obtained from this study demonstrate that ONCOBLOC® has the greatest cytotoxic effects towards cancer cells compared to LPR-1® and CCE100. Photomicroscopic images of cell with IC50 values only (Figures 5-12) are displayed in this report. There was no cytotoxic effect observed for LPR-1®, CCE100 and ONCOBLOC® against HL-60, Raji, SNU-1, WERI RB-1, LN-CaP, HSC-2, HSC-3, HSC-4, HeLa, SK-UT-1B, HepG2, ACHN, SK- Mel-28, IMR-32, CAHPV10 and TWO4 cancer cells. The cytotoxic effects of these three extract may contributed by the major active compounds present in C. militaris, such as cordycepin and water- soluble polysacharides. Cordycepin has been reported to induce apoptosis in neuroblastoma SK-N-BE (2)-C and melanoma SK- MEL-2 cells [30]. This preliminary study reported for the first time that LPR-1®, CCE100 and ONCOBLOC® exhibit various level of cytotoxicity towards different cancer cell lines.


Conclusion

In conclusion, these extracts exhibit cytotoxic effects on nasopharyngeal carcinoma epithelial cells (HONE-1), hypopharyngeal squamous carcinoma cells (FaDu), breast cancer cells (T-47D, MCF-7 & MDA-MB-231), non-small cell lung carcinoma cells (NCI-H23), osteosarcoma (U-2 OS) and chronic myeloid leukaemia cells (K-562). ONCOBLOC® showed the most cytotoxicity effects compared to LPR-1® and CCE100. The preliminary findings of this study suggest that ONCOBLOC® could be potentially developed as a novel therapeutic candidate for cancer treatment. Nevertheless, more efficacy studies should be conducted to confirm its anticancer activities.

To know more about Juniper Publishers

Wednesday, March 4, 2020

On A Boundary Value Problem for A Singularly Perturbed Differential Equation of Non-Classical Type-JuniperPublishers

Journal of Biostatistics and Biometrics-Juniper Publishers


Abstract

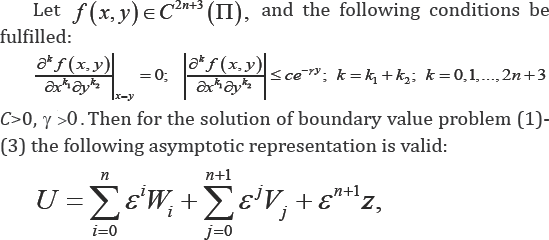
In a semi-infinite strip we consider a boundary value problem for a non-classical type equation of third order degenerating into a hyperbolic equation. The asymptotic expansion of the problem under consideration is construction is constructed in a small parameter to within any positive degree of a small parameter.

Introduction

Boundary value problems for non-classical singularly perturbed differential equations were not studied enough. We can show the papers devoted to construction of asymptotic solutions to some boundary value problems for non-classical type differential equations [1-3].
In this note in the infinite semi-strip  we consider the following boundary value problem
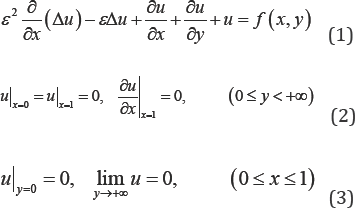
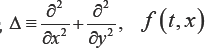
Where &>0 is a small parameter, is the given function.
The goal of the work is to construct the complete asymptotics in a small parameter of the solution of problem (1)-(3). When constructing the asymptotics we follow the M.I. Vishik LA & Lusternik [4] technique.
The following theorem is proved.
Theorem
where the functions Wi are determined by the first iterative process, Vj are the boundary layer type functions near the boundary x=1 determined by the second iterative process, en+1 Z is a remainder term, and for z we have the estimation
Where c1>0, c2>0 are the constants independent of e. References


To know more about Juniper Publishers

Monday, March 2, 2020

Prion theory: Induction of Prion Diseases by Nanoparticles Conversion (Prpc To Prpsc) Related to Electromagnetic Field-JuniperPublishers

Journal of Neurology & Neurosurgery-Juniper Publishers

Abstract

Prion theory point to a mechanism of toxicity related to the conversion of Coated (PrPc) nanoparticles (NPs) to uncoated (PrPsc) NPs under electromagnetic field could help scientific community to better understand prion diseases. However, research using nanosciences associated to electromagnetic field exposure of coated (PrPc) NPs and its conversion to uncoated NPs (PrPsc) triggering membrane receptors of the nervous system is poorly understood. Protein (PrPc) activated or influenced by uncoated NPs (PrPsc) under electromagnetic field could enhance protein 3D conversion; leading to prion diseases. The present prion theory gives the scientific community a novel approach. Interestingly, magnetic field-enhanced nano-protein to do a pathological folding, can generate large numbers of uncoated protein (PrPsc) and has scientific relevant applications for adoptive neurology.

Introduction

Until now in the field of neurobiology and medicine, prion diseases can be considered as a mystery to their unusal mechanism of pathogenicity. Take anything you learned in the field of neurobiology, especially about genetics of nervous system diseases and throw it out the door because prion diseases are exceptional and probably the only pathology without genetic support and clear mechanism. Incredibly, when we begin to understand the prion diseases in order to explain Mad Cow disease and other related diseases, conversion from 3D protein PrPc to PrPc remained unclear until now [1]. In the field of zoonosis or other diseases, the screening of pathogens give us quick results, they are not a bacteria, not a fungi, not a virus, but a protein called prion. The theory that a protein can propagate and induce disease has become a lightning-rod for controversy and has made the prion hypothesis one of the most hotly contested issues in molecular neurobiology for all these considerations we propose a new theory based on nanosciences and the bioeffects of electromagnetic field that could explain in part the folding or misfolding of many proteins. The prion theory of disease was developed in order to explain the old nomenclature of prion diseases (Transmissible Spongiform Encephalopathies (TSEs)), a group of fatal diseases that overwhelm neural cells and riddle the brain with sponge-like holes. TSEs have been found in various species, including sheep, cows, elk and human beings. The disease, appropriately named scrapies, was devastating, often requiring the sacrifice of entire herds. Human variants of TSEs are extremely rare, limited mainly to a neurodegenerative disease called Kuru found in cannibalistic Pacific Islanders, and Creutzfeldt-Jakob Disease (CJD), a disorder diagnosed in one person per million. Both these diseases share common symptoms, including gait disorders, jerky movements, and dementia that lead to death months after the first appearance of symptoms [2-4]. When Prusiner obtained a pure sample of infectious material, he began working to identify the disease causing agent. Prusiner added enzymes that destroyed DNA and RNA, he found no change in infectivity. Adding protein- neutralizing enzymes to this cocktail, however, caused a sharp drop in infectivity. This observation set the stage for a theory of disease transmission that Prusiner admitted was "heretical" when he suggested it. In a 1982 Science paper, Prusiner [2] introduced the world to the idea of a proteinaceous infectious particle-or "prion" as he dubbed it. The complete nature of the theory remains unknown and some of the fundamental issues are unresolved [2].
Researchers believe that at the heart of TSEs is the conversion of a particular protein (known as the Prion-related Protein, or PrP) from a normal (PrPc) to an abnormal, "scrapie-cell" (PrPsc), shape. Both forms of the protein consist of the same building blocks but different final products - just like the Transformers toys that could assume two shapes, one benign and the other aggressive. In the prion theory of disease, a PrPsc recruits and re-shapes a PrPc to match its own form. As more cells die of infection, they leave behind the spongy, holey brain that is a hallmark of TSEs. The present mini-review discusses a new theory based on the concept of induction of prion diseases by a simple conversion from coated nanoparticles which is a normal form of protein (PrPc) to an abnormal form which is the uncoated nanoparticles (PrPsc). It is important to mention that the PrPc or PrPsc sizes can be considered as nanoparticles in reference to nanosciences definitions. In nanosciences the uncoated nanoparticles agglomerate with chemical and physical laws as show previously in different studies [5,6]. Moreover, toxic effects of uncoated (PrPsc) nanoparticles in different nervous system animal species were well discussed by different researchers related to the increase of relativities of the particles with different compounds of the nervous system. Human and animal brains were exposed to different concentrations of uncoated (PrPsc) nanoparticles and contain naturally in its structure coated (PrPc) nanoparticles probably inducing and inversion of PrP ratio= PrPsc/PrPc. In physiological environment the PrP ratio is equal to zero. Following the generation of the uncoated NPs the ratio increase and reach high values. In exposures to coated-NPs, particles induced lower cytotoxicity than uncoated particles. Analysis showed that uncoated NPs were more cytotoxic to the nervous system. Changes in sub-cellular architecture were observed with uncoated (PrPsc). Moreover, while uncoated- NPs resulted in decreased quality and functionality of nervous system. In nowadays, the complete nature of the prion theory remains unknown as far as we know and some of the fundamental issues are unresolved. The real question is by any mechanism we have the conversion of PrPc to PrPsc probably by different agents like electromagnetic field, pesticides, heavy metals, and other xenobiotics. Both forms of the protein coated nanoparticles (PrPc) to uncoated nanoparticles (PrPsc) consist of the same building blocks but different final products - just like the Transformers toys that could assume two shapes, one benign and the other aggressive.

Nanoparticle Theory of Prpc

Coated and uncoated nanoparticles, like other nano-sized particles, exhibit special properties relative to their bulk counterparts partly due to their very small size and greater surface area. As a consequence of production of different types of nps as a ratio=nps (prpsc)/nps (prpc) which the pathogen form can be considered as uncoated nps (prpsc). new applications under development, rigorous knowledge are needed about the potential impacts of these pathogen nps (prpsc) on human and/ or animals. Over the past decade, research on biological effects of various np types (prpsc) & nps (prpc) has been performed on various cell lines, and animal models. in vitro toxicity studies have indicated effects of np types (prpsc) & nps (prpc) on neuron cells. in vivo, exposures of nps (prpsc) have shown toxic effects in various mammalian models. Moreover, studies in rats and mice have demonstrated toxicity of nps in a variety of target of the human and animal brains. from these in vitro and in vivo studies, the proposed mechanisms of coated and uncoated nps-induced toxicity are the increase of reactivity of the uncoated nps with the nervous system related to their high specific surface. even though, there is growing evidence that uncoated nps (prpsc) are toxic in various test models, the exact mechanisms of uncoated nps toxicity remain unclear. Toxicological studies of nps (prpsc) have demonstrated that physicochemical properties of nps including size, shape, surface coating, surface charge, solubility, and chemical composition could dramatically affect nps behaviour in biological systems and thus influence the toxicity of nps in the nervous system of different animal models. A number of studies reported that uncoated nps (prpsc) toxicity was dependent on their size and surface. Similarly to other nps, the size of uncoated nps probably is linked to cellular uptake processes in the brain. The surface has been shown to affect the affinity of nps for the neuron cell surface and the dissolution or the release of compounds from uncoated nps, which could explain the toxicity mechanism of uncoated nps (prpsc) compared to coated nps (prpc). the investigation of the physicochemical characteristics and their impact on the biological effects of uncoated nps is important for the better understanding of neurotoxic mechanism. the study provides scientific insight relating physical/chemical characteristics of uncoated nps to cell damage and possible toxicity mechanisms of these nps in the central nervous system [5-7].

Electromagnetic Field Theory of PrPc

Many animals can sense the geomagnetic field, which appears to aid in behaviours such as migration. The influence of man-made electromagnetic fields (EMF) on biology, however, is potentially more sinister, with adverse health effects being claimed from exposure to fields from earth magnetic field, mobile phones or high voltage power lines. Do these phenomena have a common, biophysical origin, and is it even plausible that such weak fields can profoundly cause bioeffects of EMF especially on free radicals and oxidative stress associated to a positive modulation or negative modulation of protein folding or misfolding [8].
Radical pair intermediates are widespread in protein reaction mechanisms, and the radical pair mechanism has risen to prominence as perhaps the most plausible means by which even very weak fields might impact biology [5,9] especially coated nps (prpc) to convert them to uncoated nps (prpsc) without any genetic mechanism. In this new views mini-review, we will discuss the literature that has investigated the topic of magnetic field effects in proteins and the implication of the size/shape of the nps on the pathogencity of prion diseases in the nervous system. The lack of complete mechanism related to prion diseases encourages us to propose a new view and theory related to these exceptional diseases. Electromagnetic field and spin effects have proven to be useful mechanistic tools for radical mechanism and protein folding-misfolding model in neurobiology. Magnetic fields can influence the course of chemical reactions on coated nps to transform them on uncoated nps via different mechanism using nanosciences laws. Despite growing anxiety about the possibly damaging effects of nonionizing electromagnetic radiation on living tissue especially nervous system very little attention has been devoted to the investigation of magnetic field effects on biological systems especially protein like prpc. The proposed research will investigate uncoated nps reactions in neuron cells under the influence of magnetic fields with a particular focus on the effects of magnetic fields on the conversion from coated to uncoated nps and the behaviour of uncoated nps near neurons or glial cells [10]. Additionally, prompted by theoretical predictions, the protein folding-misfolding depend on magnetic field effects directly or indirectly via free radicals to generate prion diseases [11].

Conclusion

The prion theory based on nanosciences and electromagnetic bioeffects on protein folding give the scientific community an innovative research approach that enhanced nano-protein to do a pathological folding or misfolding implicated in the generation of large numbers of uncoated protein (PrPsc) leading to prion diseases.

To know more about Juniper Publishers

Lower Psoas Muscle Area is associated with increased mortality after endovascular aneurysm repair in older adults - Juniper Publishers

  Gerontology & Geriatric Medicine - Juniper Publishers Abstract Lower Psoas Muscle Area is associated with increased mortality after en...