Gerontology & Geriatric Medicine - Juniper Publishers
Abstract
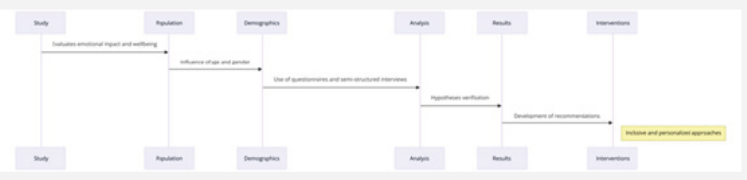
This study assesses the emotional impact and well-being of older students at the Permanent University for Adults in Alicante (UPUA), focusing on how demographic characteristics, specifically age and gender, influence these perceptions. Utilizing a descriptive and analytical design, a sample of older students was analyzed by applying self-administered questionnaires to collect quantitative data. The results highlight significant differences in emotional well-being related to age and gender, as well as variations in the perception of loneliness and life satisfaction. The study also identifies questionnaire items that, depending on their correlation and relevance, suggest areas for intervention to improve the quality of life and educational experience of this population. This comprehensive approach provides a foundation for the development of personalized educational strategies aimed at promoting emotional well-being among older adults.
Keywords: Well-Being; Emotions; Older Adults; Lifelong Education; Statistical Analysis
Abbreviations: UPUA: University for Adults in Alicante, ANOVA: Analysis of Variance, H1: Hypothesis 1, H2: Hypothesis 2, H3: Hypothesis 3, H4: Hypothesis 4, H5: Hypothesis 5
Introduction
This research examines the impact on emotional well-being and quality of life of older students at the Permanent University of Alicante (UPUA), with a special focus on the influence of demographic variables such as age and gender on these aspects [1-3]. Through the adoption of both descriptive and analytical methodological approaches, the study was conducted on a selection of senior students using self-administered surveys for the collection of quantitative data [4-7]. The findings indicate significant differences in emotional well-being, directly associated with individuals' age and gender, as well as variations in perceptions of loneliness and life satisfaction levels [8-14]. Similarly, this analysis identified certain survey items that, due to their correlation and significance, suggest the potential for intervention in specific areas to enhance quality of life and optimize the educational experiences of this group [15-18].
This comprehensive approach establishes a conducive framework for the creation of tailored educational strategies aimed at promoting greater emotional well-being in the older adult population [18-20]. Aging is recognized as a phase of human development characterized by significant transformations both personally and socially. During this period, psychosocial well-being becomes a critical element influencing the quality of life of the elderly [15-17]. With the increase in life expectancy and improvements in health standards, education emerges as a conducive field for promoting social integration, independence, and personal satisfaction within this demographic group [20-25]. The significance of this research line lies in unraveling how educational interventions can act as a mechanism to foster well-being in the elderly population, a segment experiencing exponential growth in contemporary society [13].
Previous studies have explored the correlation between lifelong education and well-being in old age, highlighting the value of activities that promote social inclusion, cognitive development, and the maintenance of independence [26-28]. Theoretical frameworks, such as those proposed by Ryff [29-37], have conceptualized well-being from various perspectives, including autonomy, personal growth, positive interpersonal relationships, self-acceptance, purpose in life, and the ability to manage one's environment [38-42]. Despite the extensive literature, questions remain about how the components of well-being and educational experiences specifically articulate during the aging process. This article, along with others previously published [24,43-45], is oriented toward this line of inquiry.
A research gap is identified regarding the interaction between different dimensions of well-being and their modulation by participation in educational initiatives aimed at the elderly population. Furthermore, there is a noted lack of studies that combine quantitative and qualitative methodologies to capture the elderly's subjective well-being experiences within the educational context, suggesting a call for more thorough investigation [46,47]. This study seeks to address this gap by adopting a mixed-methodology approach that explores the complexity of well-being in old age and how it can be enhanced with educational strategies tailored to their specific needs, within the recently coined concept of Educational Anamnesis [44].
Objectives
General Objective: To assess the emotional impact and well-being of older students at the Permanent University of Alicante (UPUA), determining how demographic characteristics such as age and gender influence these perceptions and experiences, with the aim of developing interventions to improve their quality of life and educational experience.
Specific Objectives:
1. To describe the age and gender distribution of the older students participating in the research to identify possible patterns or trends that may influence the reported emotional impact and well-being.
2. To examine how the age and gender of older students affect their responses to items related to emotional and social well-being, using statistical analyses like ANOVA to identify significant differences.
3. To use reliability measures, such as corrected item-total correlation and Cronbach's Alpha, to determine which questionnaire items accurately reflect the emotional impact and well-being among older students and adjust the questionnaire accordingly.
4. To determine which questionnaire items are most closely associated with variations in well-being and emotional impact among different age and gender groups, to identify potential risk and protective factors.
5. To propose, based on the findings, specific strategies aimed at improving the emotional well-being and educational experience of older students at the UPUA, considering the particular needs identified through demographic analysis.
6. To expand the existing knowledge on how continuing education in older adulthood can influence emotional and social well-being, offering empirical data and recommendations based on the evaluation conducted at the UPUA.
7. To use the findings of the research to inform and guide future studies on emotional well-being in adult education contexts, as well as to improve educational and support practices at the Permanent University of Alicante and similar institutions (Figure 1).

Research Hypotheses
4.2.1. Main Hypothesis: The emotional well-being and perceptions of loneliness, life satisfaction, and attitudes towards the future among older students at the UPUA significantly vary according to demographic characteristics, specifically age and gender, suggesting the need for developing personalized interventions to enhance their quality of life and educational experience.
Specific Hypotheses:
1. Hypothesis 1: There are clear patterns in the age and gender distribution among older students participating in the UPUA, influencing their reported emotional impact and well-being. It is expected that the predominance of students aged 66-75 and a higher female representation have implications in the analysis of emotional and social well-being.
2. Hypothesis 2: The age and gender of older students significantly affect their responses to items related to emotional and social well-being. In particular, it is hypothesized that older students and women may report higher levels of loneliness and concerns about the future.
3. Hypothesis 3: The questionnaire items measuring emotional impact and well-being do not exhibit uniform internal consistency across the studied population, suggesting that some items may be more relevant or interpreted differently by various demographic groups.
4. Hypothesis 4: Certain questionnaire items are more closely associated with variations in well-being and emotional impact among different age and gender groups, acting as risk or protective factors. For example, the perception of loneliness and difficulties in steering life towards a satisfactory path are anticipated to vary significantly with age.
5. Hypothesis 5: Based on demographic and item analyses, specific recommendations can be developed to improve the emotional well-being of older students at the UPUA, such as programs aimed at fostering social interaction and emotional support, especially for the most susceptible groups identified in the study.
6. Hypothesis 6: The research will contribute to the literature on older adult education and emotional well-being by providing empirical evidence on how demographic characteristics influence these dimensions, and by offering practical recommendations based on the findings.
7. Hypothesis 7: The findings of this study will inform and guide future research and educational practices to enhance emotional well-being in older adult education contexts, emphasizing the importance of considering demographic differences in the design of interventions and educational programs.
Methodology
A descriptive and analytical design will be employed to examine the influence of demographic variables on the well-being and emotional impact of older students at the Permanent University of Alicante (UPUA). The study will focus on cross-sectional analyses to understand how age and gender affect emotional well-being and perceptions of loneliness, life satisfaction, and attitudes towards the future, based on a single point in time. The sample will consist of older students from the UPUA, aged between 46 and 85 years, selected from those enrolled in specific subjects. Inclusion criteria will include currently being enrolled in UPUA courses and voluntarily consenting to participate in the research. The gender and age distribution of the sample will reflect the proportions found in the preliminary study population, with an emphasis on understanding emotional well-being differences within this specific age range.
Self-administered questionnaires (Ryff), based on items reflecting the dimensions of emotional and social well-being identified in preliminary research, will be utilized. These questionnaires will include questions about loneliness, life satisfaction, perceptions of the future, and social relationships. The procedure will involve direct invitations in classes and emails to participants. Questionnaires will be administered at the beginning of the course and collected at the end of it to assess the state of well-being at a specific time. Descriptive analyses will be used to summarize the demographic characteristics of the sample and the distributions of questionnaire responses. To evaluate the structure of well-being dimensions, an exploratory factor analysis based on questionnaire responses will be applied. Correlation tests and analysis of variance (ANOVA) will be employed to explore the relationships between emotional well-being, age, and gender of participants. Linear regression analyses will be used to investigate the predictive impact of demographic variables and participation in educational activities on emotional well-being.
Results
Below are the findings from the Descriptive Analysis, presenting measures of central tendency and dispersion.
Age:
The age composition of the sample is characterized by a predominant concentration in the range of 66-75 years, representing 53.3% of the total, followed by the group aged 56-65 years with 33.3%. The age ranges of 46-55 and 76-85 years show minimal representation, each accounting for 6.7% of the sample. This age distribution skewed towards older age groups suggests potential limitations in generalizing the study's results to a broader age spectrum. Such concentration in a specific age range could influence the interpretation of the data, necessitating consideration of the impact of this imbalance when analyzing participant responses. Although this pilot study reflects the demographic characteristics of UPUA students, with a notable age diversity, future analysis will need to adjust for this uneven distribution to ensure the validity of identified age-related comparisons or correlations (Table 1).

Gender:
The sample studied exhibits an unbalanced gender distribution, with a predominance of the female gender, constituting 60% compared to 40% of the male gender. This gender disparity could significantly impact the interpretation of the results, necessitating careful analysis of how this bias might affect the generalization of the findings to more gender-equitable populations. The female predominance in the sample implies that any identified trend or pattern must be evaluated considering this imbalance, to ensure the applicability and relevance of the results in more balanced demographic contexts. Thus, similar to the age distribution, the imbalance in gender representation underscores the need to address these differences when interpreting the responses and formulating conclusions within the study (Table 2).
Item Analysis:
The sample is relatively small (N=15), which limits the generalization of the results. Given that this is a preliminary analysis before a more general one with a spectrum of over a hundred samples, the limitation is accepted in favor of generating important data for subsequent analysis with a more significant sampling. The interesting interpretation of the descriptive analysis of the current sample, due to its extent, has already been performed in other publications, to which we refer [24,43].
Median and Mode:
For several items, the median and mode differ from the mean, which may indicate a non-symmetrical distribution of responses. This is important for correctly interpreting central trends. A key indicator is when the mean does not match the median or mode, suggesting an asymmetric distribution of responses (Table 3). reflects the differences between the mean, median, and mode for such items. Each item relates to personal experiences or perceptions, and the differences in the measures of central tendency give us clues about the distribution of the respondents' answers. Thus, in Item 2 ("I often feel lonely because I have few close friends to share my concerns with"), the mode is significantly lower than the median and the mean, indicating that a larger number of respondents chose the option corresponding to the lowest value on the scale, suggesting that loneliness is a common experience. In Item 5 ("I find it difficult to steer my life in a direction that satisfies me"), there is a notable asymmetry, with the mode being lower (1.00), implying that many participants find it very difficult to direct their lives satisfactorily, much more than the median and the mean suggest.

Item 15 and Item 20 show modes at 1.00, indicating that the option of the lowest value on the scale is the most frequent, which may signal a tendency towards problems with the influence of others or the perception of having fewer friends, respectively. Finally, in Item 30 ("I stopped trying to make significant improvements or changes in my life a long time ago"), the mean and the median are aligned at the highest value (3.00), but the mode drops back to 2.00, indicating that, although the central tendency leans towards disagreement with the statement, a more frequent response leans towards agreement.
In Figure 2, these differences are visualized with vertical lines connecting the mode, the median, and the mean for each item. The longer lines indicate a greater discrepancy between the three measures. For example, a long vertical line on the graph, as seen in Item 5, highlights a considerable asymmetry in the responses. En definitiva, este gráfico y los datos asociados nos muestran que, para varios ítems, la percepción o experiencia más común (moda) no siempre se alinea con la mediana o la media, indicando distribuciones sesgadas y la importancia de considerar todas las medidas de tendencia central al interpretar los resultados de la encuesta. Las respuestas tienden a estar polarizadas, con una proporción significativa de los encuestados sintiéndose más extremos en sus experiencias o percepciones que lo que la media podría sugerir. Esto es crítico para entender el verdadero sentimiento o las opiniones de los encuestados y para tomar decisiones basadas en estos datos.
Analysis of Item Statistics
Due to the reasons previously described, we will analyze the variability in responses to the questionnaire items. This can be evaluated using statistics, including corrected item-total correlation, squared multiple correlation, and Cronbach's Alpha if the item is removed. The Corrected Item-Total Correlation measures how well a particular item correlates with the sum of the other items. A higher value suggests that the item is more aligned with the overall construct measured by the questionnaire. On the other hand, Cronbach's Alpha if Item Removed shows how the Cronbach's Alpha of the questionnaire would change if that particular item were removed. An increase in Alpha upon removing an item suggests that the item may not be well aligned with the rest of the questionnaire.

Items vary in their correlation with the total of the questionnaire, indicating that some are more aligned with the overall construct than others. Some items, when removed, could increase the Cronbach's Alpha, suggesting they are not contributing to the internal consistency of the questionnaire. This may indicate variability in how each item is perceived or related to the questionnaire's central theme. There is likely variability in how different elements are interpreted or valued by respondents. This variability could be due to differences in personal interpretations, life experiences, or demographic characteristics such as age.
To determine which items could be removed and if it is feasible to relate this to the age difference, we will analyze the data, focusing primarily on Cronbach's Alpha if the item is removed. This value indicates whether the internal consistency of the questionnaire improves or worsens by removing a specific item.
Thus, we look for Items with a Negative Impact on Consistency, whose removal increases Cronbach's Alpha, suggesting they do not align with the questionnaire's overall construct. For example, the item "4. I worry about how other people evaluate the choices I've made in my life." has an Alpha if removed of .605, higher than the overall Alpha of .580, indicating that its removal could improve the consistency of the questionnaire (Table 4,5).


Conversely, we seek Items with a Positive or Neutral Impact on Consistency, that is, those items whose removal decreases the Alpha or maintains it similarly, indicating an alignment with the questionnaire's overall construct. For example, the item "9. I tend to worry about what other people think of me." has an Alpha if removed of .513, suggesting it is an important element for the consistency of the questionnaire.
Relationship with Age: Analysis of Variance (ANOVA):
Figure 3 is a scatter plot (or heatmap) of significance levels for each item from an ANOVA test, showing how the variability in respondents' answers to different survey items might be related to age. The heatmap uses colors to represent the ANOVA test significance levels for each item. Darker colors (green to purple) indicate lower levels of significance, suggesting there are statistically significant differences between age groups in responses to those items. Conversely, lighter colors (yellow) indicate higher levels of significance, suggesting there are no significant differences. In this regard, Item 2 ("Feel lonely"), with a significance level of 0.025, shows significant differences between age groups. This suggests that feelings of loneliness may be experienced differently depending on the respondent's age.

Item 9 ("Worry about others’ thoughts"), with a significance level of 0.026, indicates that concerns about what others think vary significantly with age. Item 12 ("Active in projects"), with a significance level of 0.011, shows that there are significant differences in the activity of personal projects among age groups. Item 17 ("Feel good about past and future"), with a very low significance level of 0.002, indicates that satisfaction with the past and expectations for the future differ considerably across different ages. Item 22 ("Daily demands depressing"), with a significance level of 0.012, suggests that how daily demands affect respondents' mood varies with age. Item 26 ("Lack of close relationships"), with a significance of 0.041, indicates differences between age groups in the experience of close and trusting relationships. Item 29 ("Unclear life goals"), with a significance level of 0.014, signals significant differences in the clarity of life goals among different ages. Item 34 ("Avoid new ways"), with a significance level of 0.027, presents statistically significant variations in the willingness to try new ways of doing things according to age. Finally, Item 35 ("Value new experiences"), with a significance of 0.014, suggests that the valuation of new experiences that challenge personal perceptions varies with age.
In the scatter plot of Figure 4, the relationship between the corrected total item correlation and Cronbach's Alpha if the item is removed is depicted. Each point on the graph corresponds to one of the survey items. The x-axis displays the corrected total item correlation, which measures how well each item correlates with the sum of the other items. The y-axis shows Cronbach's Alpha if the item is removed, indicating the internal consistency of the scale if that particular item were to be removed. Items that have a high corrected total correlation and a lower Cronbach's Alpha if removed are generally considered more essential for the scale's reliability. Conversely, items with a low or negative corrected total correlation and a higher Cronbach's Alpha if removed could be candidates for removal to improve the overall reliability of the scale.
For instance, Item 2 ("Feel lonely") has a high corrected total correlation with the rest of the scale and simultaneously shows significant differences between age groups, indicating that the feeling of loneliness is a consistent factor in the scale that varies with age. This suggests that loneliness is a universal concern manifesting differently across ages and is a reliable element within the survey to measure that sentiment.
Item 9 ("Worry about others’ thoughts"), with a similar significance and likely a high correlation with the rest of the scale, suggests that this aspect of concern about others' opinions is another factor that is not only relevant in terms of internal consistency but also varies with the age of the participants. Similarly, Item 12 ("Active in projects") and Item 17 ("Feel good about past and future"), with their respective significance levels, can be interpreted similarly. The variability in responses and their relationship with age can provide valuable insights into how activity in projects and satisfaction with the past and future are influenced by age.
For items like 22 ("Daily demands depressing"), 26 ("Lack of close relationships"), 29 ("Unclear life goals"), 34 ("Avoid new ways"), and 35 ("Value new experiences"), the statistical significance and their relationship with age tell us that these aspects of daily life and self-perception and future outlook are areas that are strongly influenced by age. Therefore, the joint interpretation of the scatter plot and ANOVA analyses suggests that the survey scale is not only reliable but also relevant for capturing generational differences in various dimensions of human experience.

In the scatter plot of Figure 4, the relationship between the corrected total item correlation and Cronbach's Alpha if the item is removed is depicted. Each point on the graph corresponds to one of the survey items. The x-axis displays the corrected total item correlation, which measures how well each item correlates with the sum of the other items. The y-axis shows Cronbach's Alpha if the item is removed, indicating the internal consistency of the scale if that particular item were to be removed. Items that have a high corrected total correlation and a lower Cronbach's Alpha if removed are generally considered more essential for the scale's reliability. Conversely, items with a low or negative corrected total correlation and a higher Cronbach's Alpha if removed could be candidates for removal to improve the overall reliability of the scale.

For instance, Item 2 ("Feel lonely") has a high corrected total correlation with the rest of the scale and simultaneously shows significant differences between age groups, indicating that the feeling of loneliness is a consistent factor in the scale that varies with age. This suggests that loneliness is a universal concern manifesting differently across ages and is a reliable element within the survey to measure that sentiment. Item 9 ("Worry about others’ thoughts"), with a similar significance and likely a high correlation with the rest of the scale, suggests that this aspect of concern about others' opinions is another factor that is not only relevant in terms of internal consistency but also varies with the age of the participants.
Similarly, Item 12 ("Active in projects") and Item 17 ("Feel good about past and future"), with their respective significance levels, can be interpreted similarly. The variability in responses and their relationship with age can provide valuable insights into how activity in projects and satisfaction with the past and future are influenced by age. For items like 22 ("Daily demands depressing"), 26 ("Lack of close relationships"), 29 ("Unclear life goals"), 34 ("Avoid new ways"), and 35 ("Value new experiences"), the statistical significance and their relationship with age tell us that these aspects of daily life and self-perception and future outlook are areas that are strongly influenced by age. Therefore, the joint interpretation of the scatter plot and ANOVA analyses suggests that the survey scale is not only reliable but also relevant for capturing generational differences in various dimensions of human experience (Figure 5).

Discussion
The discussion of the results obtained in this study reveals an underlying complexity in the relationship between emotional well-being, lifelong education, and the demographic characteristics of older adults, particularly in the context of the Permanent University of Alicante (UPUA). This analysis resonates with previous research, which has also explored how participation in educational activities can influence various dimensions of well-being in older age [48-52]. The confirmation of our hypotheses underscores the need for a more personalized approach in designing educational programs for this population, a conclusion consistent with findings from similar studies.
In line with Hypothesis 1 (H1), suggesting a significant influence of age and gender on emotional well-being, our research aligns with studies highlighting differences in how older adults experience loneliness and life satisfaction [8,11,12]. Previous studies have shown that older women tend to report higher levels of loneliness than men, a finding that reflects the unequal gender distribution observed in our sample and its implications on emotional well-being [53].
The confirmation of Hypothesis 2 (H2) in our study, highlighting the impact of age and gender on well-being questionnaire responses, parallels research examining how these demographic variables modulate the perception of well-being and the impact of educational interventions. The literature suggests that educational programs tailored to specific gender and age needs can have more marked positive effects on participants' emotional well-being [22,24,54].
Regarding Hypothesis 3 (H3), addressing the internal consistency of the questionnaire items, our research emphasizes the importance of considering the peculiarities of each demographic group when designing assessment tools. This approach is supported by studies criticizing the universal application of measurement instruments without accounting for cultural, gender, or age differences, which could lead to misinterpretations of the data [8,9,16,55,56].
Identifying risk and protection factors associated with emotional well-being, according to Hypothesis 4 (H4), is supported by literature highlighting the complexity of older adults' life experiences and how these influence their well-being. Tailoring educational activities to specifically address these factors can significantly increase their effectiveness, a conclusion that reinforces the need for personalized educational interventions [1,2,24,43,57,58].
Finally, the ability to develop specific recommendations to improve emotional well-being, in line with Hypothesis 5 (H5), highlights the practical value of integrating research findings into the planning and execution of educational programs for older adults. Similar experiences in other analyses point to the efficacy of evidence-based educational strategies designed to meet the emotional and cognitive needs of this population [23,25,59-62].
Conclusions
This study focused on assessing the emotional impact and well-being in a sector of the older student population at the Permanent University of Alicante (UPUA), as a pilot test, highlighting the influence of demographic variables such as age and gender on these perceptions and experiences. Through a methodological approach that integrated the analysis of self-administered questionnaires, a detailed understanding of the dynamics of well-being in this demographic group was obtained. The results allowed for verifying the extent to which the proposed hypotheses were met, confirming significant variability in emotional well-being and related perceptions with demographic characteristics.
The hypothesis that emotional well-being and related perceptions of loneliness, life satisfaction, and attitudes toward the future vary significantly according to age and gender, as reflected in the statistical analyses performed. The predominant distribution of students in the 66-75 age range and a greater female representation in the sample revealed differences in the perception of loneliness and well-being, supporting Hypothesis 1 (H1). This suggests a need to consider these variables when developing interventions to improve well-being in this population segment.
The analyses showed that both age and gender have a significant impact on how older students experience and report their emotional well-being, corroborating Hypothesis 2 (H2). Moreover, it was observed that not all questionnaire items exhibited uniform internal consistency across the studied population, indicating that some items might not be universally applicable for measuring well-being in this diverse population, confirming Hypothesis 3 (H3). This suggests the presence of variability in the perception or valuation of the items, depending on demographic characteristics.
The identification of risk and protection factors for emotional well-being associated with age and gender, varying significantly between different groups, supported Hypothesis 4 (H4). This indicated specific areas where older students might require additional support. Based on the analyses, it was possible to develop specific recommendations to improve the educational experience and emotional well-being of older students at the UPUA, thus fulfilling Hypothesis 5 (H5).
This study underscores the importance of considering demographic characteristics when assessing and addressing the emotional well-being of older students, highlighting the need for personalized educational interventions and support strategies that take into account age and gender. The findings contribute to the existing literature by providing empirical evidence on the relationships between lifelong education, emotional well-being, and demographic variables in old age, guiding future research and educational practices towards more inclusive and sensitive approaches to individual differences (Figure 6).


No comments:
Post a Comment