Tuesday, April 30, 2024

Design, Development and In- vitro Evaluation of PLGA Based Nanoparticles Loaded Tamoxifen Citrate to Optimize the Sustain Action in Breast Cancer Therapy - Juniper Publishers

 Drug Designing & Development - Juniper Publishers


Abstract

The aim of the present study is to optimize and develop tamoxifen citrate loaded PLGA (Poly lactide co glycolic acid) based nanoparticles for sustaining the action of tamoxifen citrate by controlling the release at a predetermined rate. Tamoxifen citrate is a non- steroidal anti- estrogenic drug used for breast cancer therapy and PLGA is a biodegradable co- polymer that can be given parenterally for its biocompatibility. The drug- excipients compatibility study, pre- formulation and post- formulation interaction and stability studies, preparation and characterization of the nanoparticles’ shape, surface, size, and size distribution have been performed. Tamoxifen citrate loaded PLGA based nanoparticles have been prepared by double emulsification and solvent evaporation technique with the variation of tamoxifen citrate- PLGA ratio, emulgent and stabilizer polyvinyl alcohol- water solutions’ concentrations and quantity, and speeds of homogenization to obtain the optimized nanoparticles with desired shape, surface properties, size and size distribution, drug loading efficiency, drug content and drug release profile. The characterization of particle size and shape have been performed by field emission scanning electron microscope and particles size distribution patterns and polydispersity indices have been studied by dynamic light scattering method using Zetasizer nano- series. The drug loading, drug content and in- vitro drug release studies of all the prepared batches have been performed by UV- spectroscopic analysis.

Keywords: Biodegradable; Biocompatibility; PLGA; Nanoparticles; Stability Studies; Homogenization; Antiestrogen; Estrogen; Breast Cancer; Cancer Chemotherapy; Drug Entrapment Efficiency

Introduction

Cancer is a major human health problem worldwide and it is the second leading cause of death in USA [1,2]. Breast cancer [3] is the most fatal disease especially for women world. Tamoxifen [4], a non- steroidal active antiestrogen and selective estrogen receptor modulator [5] (SERM), has been the clinical choice for the treatment of advanced or metastatic breast cancer for more than 30 years [2]. It has been used as adjuvant or additional therapy following primary treatment for early- stage breast cancer [6-8] and to treat post- menopausal breast cancer [9,10]. Microparticles [11,12] and nanoparticles [13] have been developed and utilized as anticancer drug delivery systems and are rapidly expanding area in the pharmaceutical fields. Nanoparticles [14,15] for their attractive properties occupy unique position in anticancer as well as other drugs delivery technology. The tremendous opportunities [1] exist for using nanoparticles [16] as controlled release drug delivery systems for cancer treatment [17,18]. PLGA is a USFDA approved copolymer for human use as surgical sutures, implantable devices and parenterally administrable drug delivery systems, owing to its biodegradability and biocompatibility [19]. Depending on the ratio of lactide to glycolide used for the polymerization, different forms of PLGA can be obtained and it undergoes hydrolysis in the body to produce the original monomers, lactic acid and glycolic acid. These two monomers under normal physiological conditions are by- products of various metabolic pathways in the body. Since the body effectively deals with the two monomers, there is very minimal systemic toxicity associated with using PLGA for drug delivery or biomaterial applications [20]. PLGA based nanoparticles [21] containing several types of drugs including anticancer drugs have been reported the uniqueness of this type of formulations [1]. Enhanced systemic stability of drugs or therapeutics, continuous and controlled drug release, reduced dosage and decrease in systemic side effects, reduced possibility of dose dumping, reduced frequency of administration and therefore increased patient compliance are some of the advantages of sustained release nanoparticles based on PLGA [19,22]. Therefore, an effort was made here to develop and evaluate (invitro) through optimization of various parameters biodegradable [23] PLGA (85:15) based nanoparticles for providing sustained release of tamoxifen citrate for the betterment in breast cancer therapy [24]. The development of drug delivery systems for cancer chemotherapy in the lowest dose of the drug (selective or specific) for providing the most patient compliance dosage form of available at minimum price and can work at the proper target site, is the most essential theme of the formulation scientists due to the high toxicity of the drugs which could lead to serious side effects as well as health hazards. Tamoxifen citrate is a costly drug, and the dose of tamoxifen citrate is 20- 40mg in a single dose or in 2 divided doses given orally in conventional tablet dosage forms. The optimum duration of treatment for breast cancer therapy using this drug is uncertain. The drug should be given at least 2 years and probably for 5 years or even lifelong left. For the longterm treatment policy, the development of PLGA based sustained release nanoparticles containing tamoxifen citrate is the interest of our research works and it is the need for the betterment of breast cancer therapy as well as to save the women from the fatal disease.

Materials

Tamoxifen citrate was obtained as gifts from Khandelwal Pharmaceutical (Mumbai, India). Biodegradable polymer Poly (D, L- lactide- co- glycolide)- 85:15 (PLGA) from Sigma- Aldrich Company (Bangalore, India), dichloromethane, dimethyl sulfoxide (DMSO) and methanol from Merk (Mumbai, India) were purchased. Polyvinyl alcohol (PVA) (M.W.-1,25,000) was purchased from S.D. Fine- Chem. Pvt. Ltd. (Mumbai, India) [25].

Methods

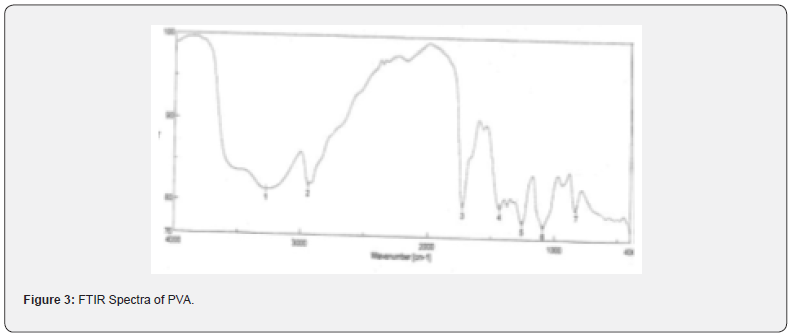
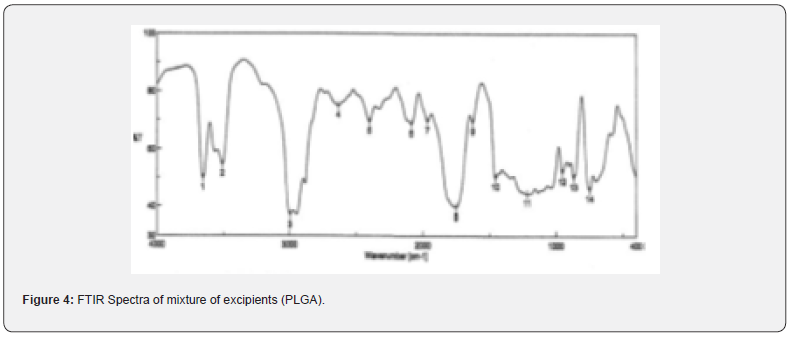
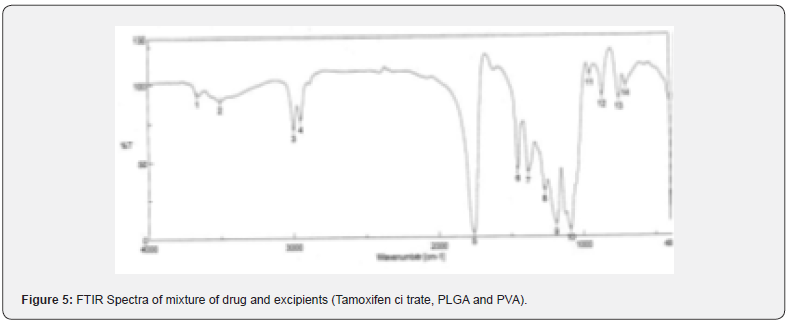
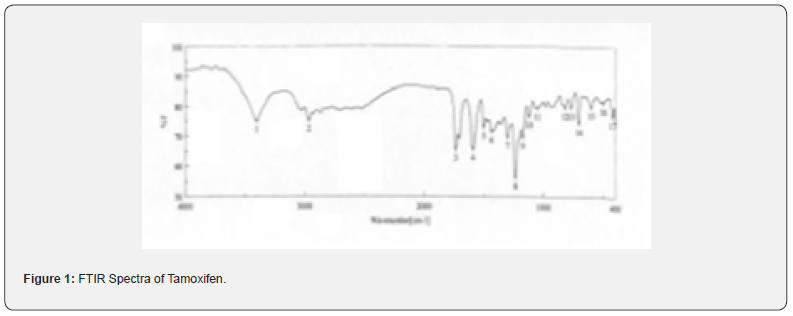
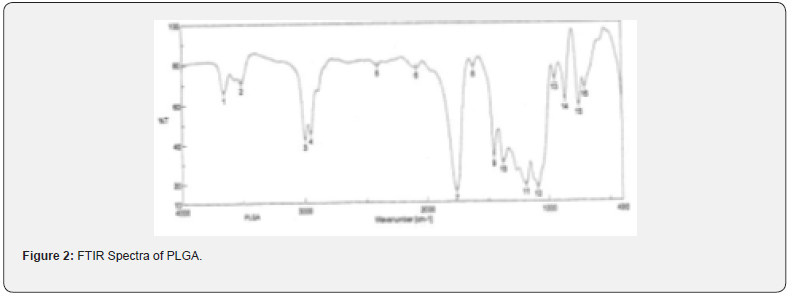
The pure drug tamoxifen citrate, PLGA- 85:15, PVA, a mixture of PLGA and PVA, and a mixture of tamoxifen citrate, PLGA and PVA were mixed separately with IR grade KBr in the ratio of 1:100 and corresponding pellets were prepared by applying 5.5 metric ton pressure with a hydraulic press. The pellets were scanned in an inert atmosphere over a wave number range of 4000- 400cm- 1 in Magna IR 750 series II, (Nicolet, USA) FTIR instrument [25] and the FTIR spectra were compared, no predominant interactions between drug and the excipients molecules were noticed. Only there is a mild interaction noticed between 1300 and 1200(cm- 1) wave number due to IR stretching vibration zone of functional group such as C- O (alcohol) and C- N [26,13]. There might be for the formation of weak physical bonds such as hydrogen bonding, bond due to Van der Waal’s forces or dipole moment between C- N present in the drug molecule and -OH present in the PLGA.

The data suggests that there is no chemical interaction that exists between the drug and the excipients since no shifting of peak was noticed as the shifting of peak is claimed as chemical interaction.

Nano- particles were prepared by double emulsification (w/o/w) and solvent evaporation technique. Desired amount of Tamoxifen citrate was taken in beaker with required quantity of DMSO/ methanol and 5%w/v PVA (M.W.- 125000) - water solutions were added to dissolve the drug with the help of sonicator (TRANS- O- SONIC, Mumbai), required amount of PLGA- 85:15 was weighed and taken in another beaker with desired quantity of dichloromethane to dissolve the PLGA. After dissolution of drug and PLGA, the required quantity of 2.5% w/v of PVA - water solution was added to drug- DMSO/methanol- PVA water solution slowly drop- wise to the oil phase i.e. PLGA - dichloromethane solution under continuous homogenization using high speed homogenizer at 6000 / 8000 / 10000 / 12000 / 13500 / 16000 r.p.m for 4 minutes, The first emulsion w/o was formed and it was added slowly to 75 ml of 1.5% w/v of PVA (M.W.- 125000, s.d.fine) solution under continuous homogenization at same speed 6000 / 8000 /10000 / 12000 /13500 / 16000 r.p.m respectively for 6 minutes and w/o/w emulsion was formed. Then the prepared emulsion was placed on magnetic stirrer for continuous stirring at room temperature for 12 hours for the evaporation of organic solvents DMSO / methanol and dichloromethane. The emulsion containing microparticles were filtered and washed with double distilled water by using cooling centrifuge (REMI) at 4ºC in speed 5000 or 14000 r.p.m. and kept the separated samples in freezer at - 20ºC (LG freeze) and dried in a freeze drier (Laboratory Freeze Drier, IIC Industrial Corporation, Kolkata) at - 42ºC [25]. The details of quantities of drug, polymer, stabilizer and solvents used for different batches of microparticles were given in Table 1.

Method for Optimization and Standardization of Formulations

Optimization and standardization were done to establish a standard formula, to optimize the speed of homogenization for preparation of formulations, speeds of centrifugation for separation of different particles size to obtain quality drug products with optimum and uniform range of particles size, drug content and drug entrapment efficiency in different variables by analyzing SEM and FESEM photographs, DLS zeta sizer particle size distribution analysis, drug loading efficiency and content estimation, and drug release profiles through UV visible spectrophotometric analysis of the drug product samples.

Method for Drug Content Studies

Nanoparticles (2mg) were dispersed in 1ml of 0.1M NaOH aqueous solution containing 5%w/v sodium dodecyl sulphate and in methanol- water (1%v/v) mixture for extraction of drug from nanoparticles. The extracts were filtered by centrifuge and 0.8 ml of supernatant was taken with the help of micropipette and absorbance was noted. The content of tamoxifen citrate and drug entrapment efficiency were calculated from standard curve using the following formula [25]. Percentage of Drug Content = (Weight of drug in the products /Total weight of the products) × 100 Percentage of Drug Entrapment Efficiency = (Weight of the drug in 1mg. product × Total products) / Total drug taken for formulation of a particular batch.

Method for Particle Size Distribution Analysis

The characterization of particle size and their distribution pattern were determined by Dynamic Light Scattering (DLS, Zetasizer nano ZS) and analyzed using DTS software (Malvern Instrument Limited, UK), Average particle size was calculated and expressed in nanometer [25].

Methods for Surface Morphology of Micro and Nanoparticles

The surface morphology of nanoparticles was investigated using Field Emission Scanning Electron Microscope (FESEM). Nanoparticles samples were mounted on the stubs using doublesided adhesive tapes. The stubs were then vacuum coated with platinum using JEOL JFC 1600 Autofine coater (JEOL, Tokyo, Japan). The nanoparticles were examined with FESEM, JEOL JSM 6700F (JEOL, Tokyo, Japan) [25].

Method for Drug and Drug Formulations Stability Studies

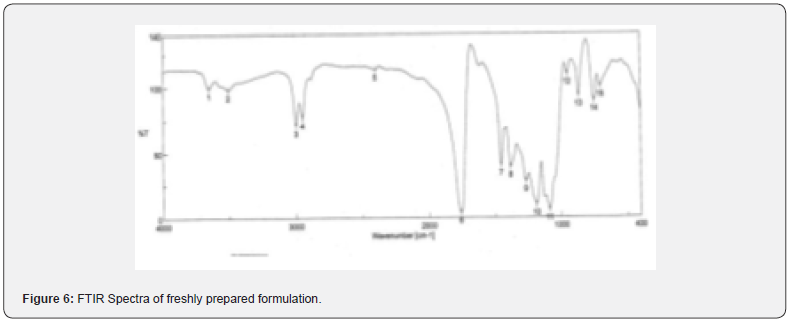
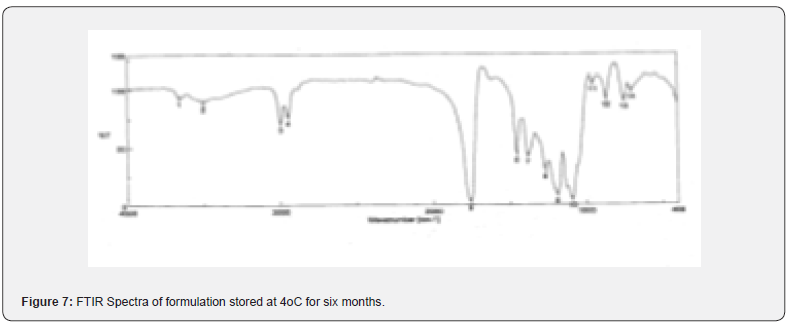
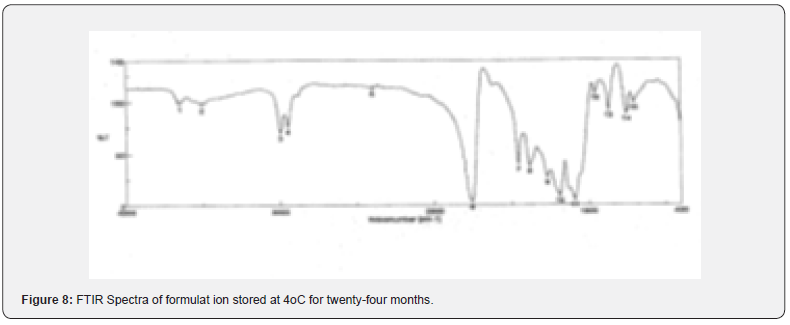
The pure drug tamoxifen citrate, a mixture of tamoxifen citrate, PLGA and PVA, a freshly prepared formulation, a formulation kept at 4oC for six months and a formulation kept at 4oC for twenty- four months were mixed separately with IR grade KBr in the ratio of 1:100 and corresponding pellets were prepared by applying 5.5 metric ton pressure with a hydraulic press. The pellets were scanned in an inert atmosphere over a wave number range of 4000- 400cm- 1 in Magna IR 750 series II, (Nicolet, USA) FTIR instrument [25] and a comparative study of FTIR spectra of different samples were done to analyze the stability of drug in the formulations.
Method for Drug Release Studies

Nanoparticles (3mg) containing drug tamoxifen citrate were taken in 1ml phosphate buffer solution at pH- 7.4 as dissolution medium in 2ml Eppendorf tube and kept in incubator shaker at 37oC. Number of such tubes were kept for analysis of drug release at different time points. At a particular time point the tube intended for analysis at that time point was taken and the others remained in the incubator shaker to be analyzed at their respective time points. The tubes were centrifuged at 5000 rpm for 10 min, a measured quantity of supernatant was taken and analyzed spectrophotometrically at 238nm [25] (Figures 1-6) .

Results and Discussion

When the FTIR spectra of the different formulations Figures 7 and Figure 8 were compared with the spectra of individual drug, PLGA, PVA, mixture of drug, PLGA, PVA and freshly prepared formulation (Figures 1-6), no predominant chemical interactions between drug and the excipients molecules were noticed as all the characteristic peaks of the polymers were found to be present in the mixture of drug and excipients (Figure- 5), freshly prepared formulation (Figure 6), formulation stored at 4oC for six months (Figure 7) and formulation stored at 4oC for twenty four months or two years (Figure 8). A mild physical interaction was noticed between 1300 and 1200(cm- 1) wave number in the region of the IR stretching vibration zone of functional group such as CO (alcohol) and C- N for the formation of weak physical bonds such as hydrogen bonding, bond due to Van der Waal’s forces or dipole moment between C- N present in the drug molecule and -OH present in the PLGA. Since no shifting of peak was noticed as the shifting of peak is claimed as chemical interaction in Figure 7,8 [26,13], the chemical integrity of drug molecule should be maintained at least two years or formulations will be stable for two years in this particular storage condition.

Drug Content and Drug Loading Percentage Efficiency

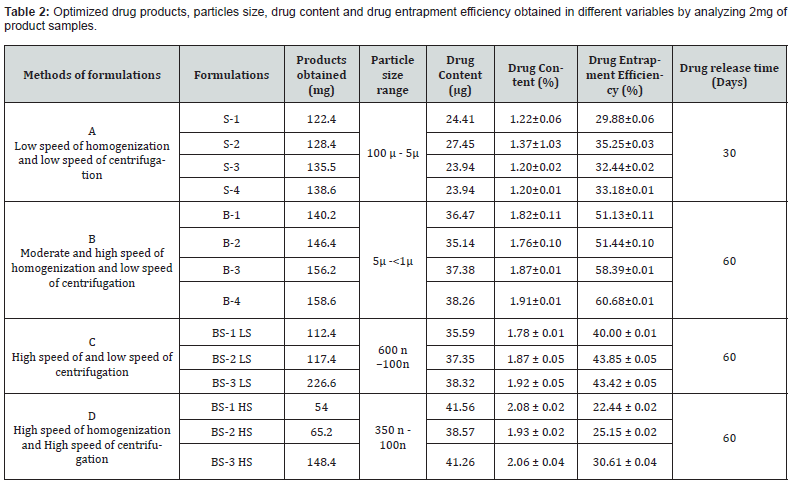
The drug loading values were expressed in terms of the quantity of drug entrapped in the formulations [2, 15] and the drug entrapment efficiency was associated with the percentage of total drug entrapped in a particular formulation [27]. The drug loading and the drug entrapment efficiency in the formulated particles can be enhanced by taking more drugs in preparatory steps and with the proper solvent [28]. The drug entrapment and content of the particulate drug devices gradually increased with the reduction of particles size. In this study results show the maximum drug content in the smallest nanoparticles formulation. The methanolic extraction method shows slightly better results due to the higher solubility of drug in methanol [27] causing better extraction of drug from formulation than SDS- NaOH solution (Table 2).
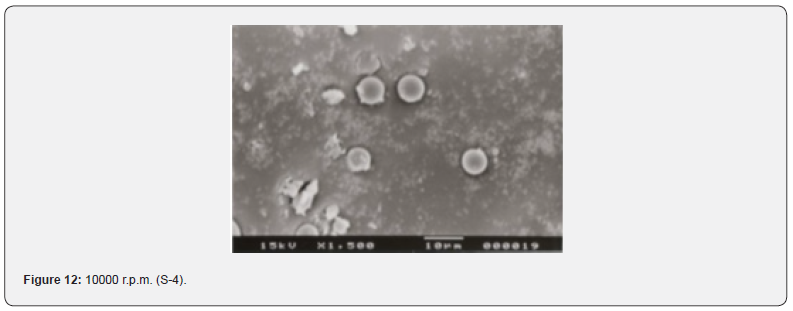
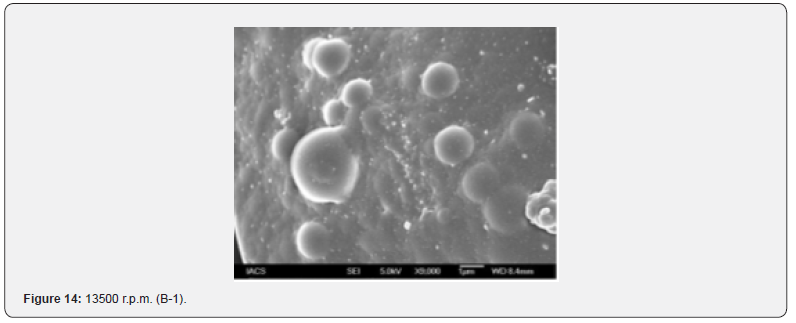
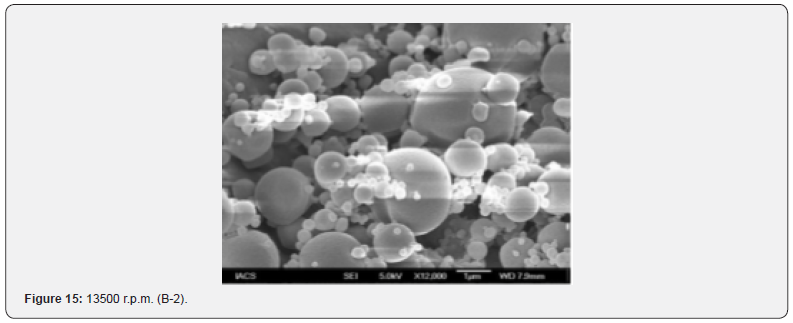
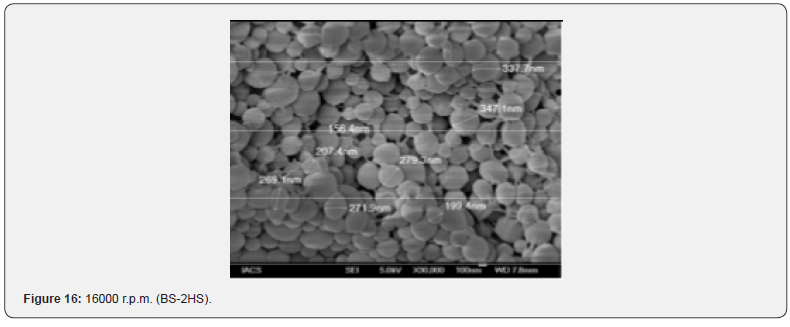
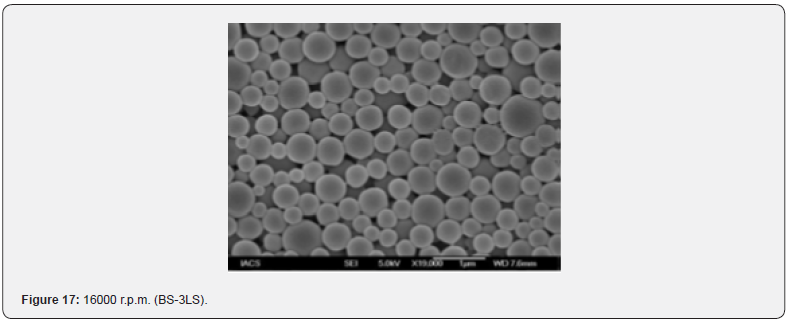
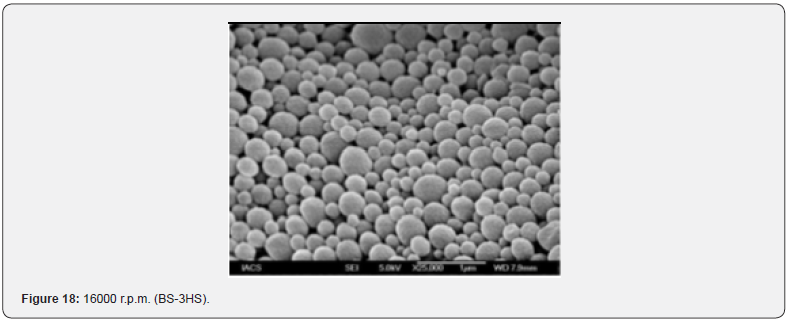
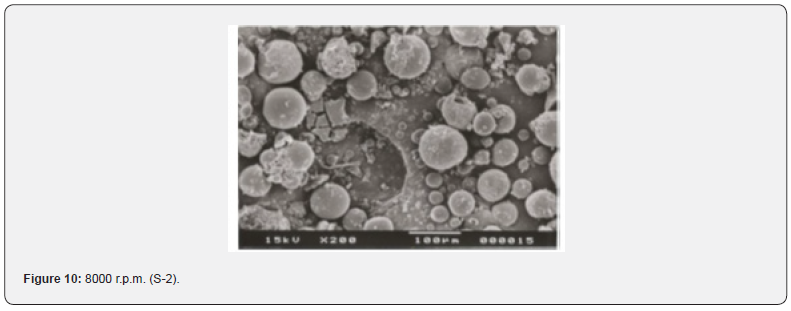
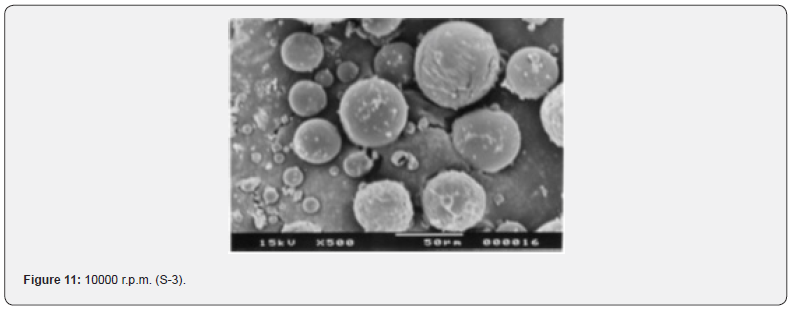
The Figures 9-14 show spherical microparticles of around 100 μ - 5μ range of particles, Figures 15 shows smooth surface micro and nanoparticles within the range of less than 5μ to 100 nm approximately, and Figures 16-18 show 100nm to 350nm in size range and few particles were of around 650nm. These formulations show the uniformity of the particle size due to high speeds of homogenization (16000 r.p.m) and centrifugation (14000 r.p.m) for preparations and separation of formulations respectively.
Particles Size Distribution Analysis and Polydispersity Indices (PDI)

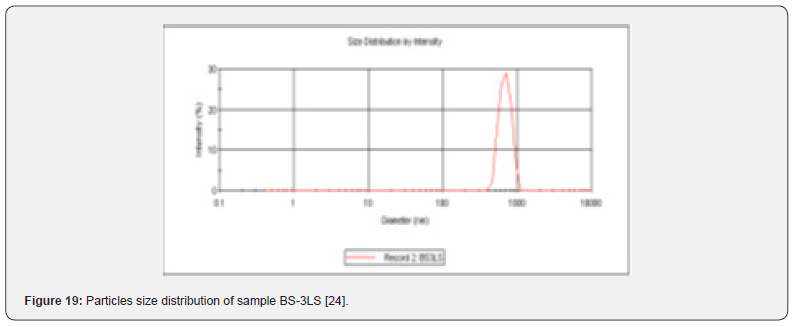
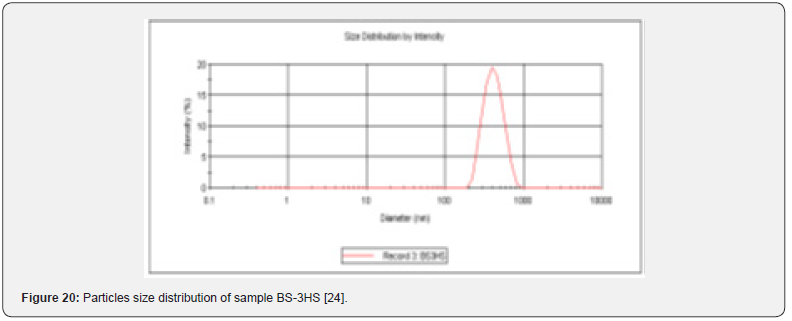
In the Figure 19 shows the particles size distribution varied from 400nm to1000 nm and the average particle size was about 650 nm with poly dispersity index (PDI) 0.04 of the sample formulation obtained from low- speed centrifugation (5000 r.p.m). The polydispersity indices suggest the particles were within nano range only and uniform monodisperse particle size distribution. The Figure 20 shows the particle size distribution pattern which ranged from 100nm to 800 nm and the average particle size was about 350 nm with poly dispersity index (PDI) 0.02 of the sample formulation obtained from high- speed centrifugation (14000 r.p.m).
In- Vitro Drug Release Profile of the PLGA Based Micro and Nanoparticles

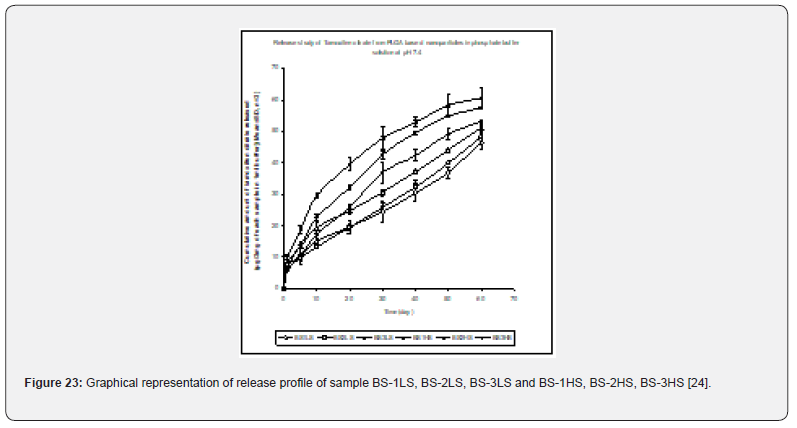
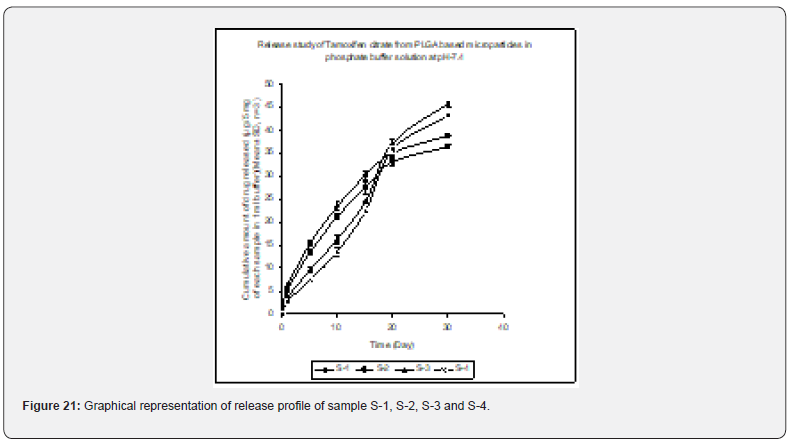
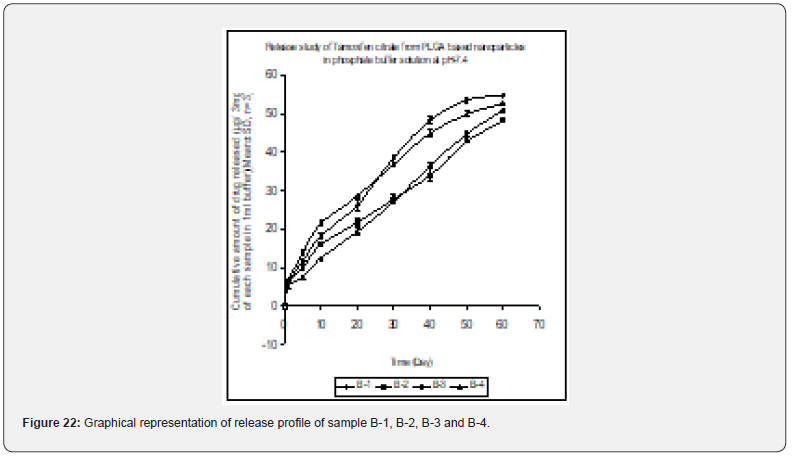
In- vitro drug release profile of Tamoxifen citrate from the PLGA based particulate drug formulations S- 1 to S- 4 was shown in Figure 21. The gradual increment of cumulative amount of drug release was seen and around 85% of the actual drug content in the formulations was released within 30 days. The results show the uniformity and faster drug release from formulations S- 1 to S- 4 as compared to the other experimental formulations. The results of in- vitro release profile of Tamoxifen citrate from formulations B- 1 to B- 4 (Figure 22) shows the gradual increment of cumulative amount of drug released and around 90% of the actual drug content in the formulations was released within 60 days. The results show the uniformity and slower drug release from formulations B- 1 to B- 4 as compared to the formulations (S- 1 to S- 4) and near about same as the formulations BS1LS to BS3HS. In- vitro release profile of Tamoxifen citrate from the PLGA based nanoparticle formulations BS- 1LS to BS- 3HS Figure 23 shows the gradual uniform release of Tamoxifen citrate and about 90% of drug was released within 60 days. The results show uniform and slower drug release from the experimental nanoparticles formulations. However, slowest and almost ‘zeroorder’ drug release was obtained in case of formulation BS- 1LS and faster and ‘first order’ kinetic pattern was observed in case of formulation BS- 1HS.

All the analytical data were analyzed at 238 nm for drug content study, drug entrapment efficiency study and in- vitro drug release study. The standard calibration curves show minor deviations which show favorable accuracy of our experiments.
Conclusion

The biodegradable polymer Poly (D,L- Lactide- co- Glycolide)/ PLGA- 85:15 based nanoparticles containing Tamoxifen citrate can be prepared by water- in- oil- in- water (w/o/w) emulsification and solvent evaporation method [29]. This method enables a high entrapment of hydrophobic (i.e Tamoxifen citrate) bioactive [30]. The particles size can be minimized by increasing the speeds of homogenizer up to a certain limit and uniform particle size distribution can be improved by the filtration or separation in different speeds of centrifugation. The particle size of the formulations was reduced with increasing the speeds of homogenizer. The uniform particle size was obtained by proper filtration by centrifugation with low poly dispersity index. The present study has been performed about the development and evaluation of nanoparticles containing anti- breast cancer drug with biodegradable polymeric devices which can be administered parenterally after reconstitution with sterile water for injection. This particular pharmaceutical product development was formulated with the biodegradable polymer [31] PLGA- 85:15 based nanoparticles with desired specific characters and successful entrapment, reasonable loading, controlled and prolonged release of tamoxifen citrate for the betterment breast cancer therapy. Thus, the mentioned nanoparticles formulation containing tamoxifen citrate could be beneficial system to deliver tamoxifen to breast cancer tissues through long term- controlled release for the betterment of the treatment via parenteral intramuscular or subcutaneous administration as a depot and it will be the potential alternative dosage form for the treatment of breast cancer. PLGA based nanoparticles containing tamoxifen citrate have been developed in the research laboratories. If this dosage form will be developed, established and available in the market, the patients as well as the society will be benefited due to the advantages of providing a long- term sustained release action after parenteral administration as a depot of the drug for the treatment of breast cancer. Therefore, we hope that in near future this dosage form will be reality for use economically and become a potential alternative to conventional controlled release dosage forms available in the market.

To Know more about Novel Approaches in Drug Designing & Development

To Know more about our Juniper Publishers

Friday, April 26, 2024

An Investigation on Psychosocial Factors Impacting Frailty in Older Adults: A Case of Singapore - Juniper Publishers

 Online Journal of Public Health - Juniper Publishers

Abstract

Background

Frailty is a geriatric syndrome of increased vulnerability due to diminished physiologic reserves. It is still unclear how the psychosocial factors and physical frailty are related to health outcomes. This study presents prevalence, related physical and psychosocial factors of frailty in older adults in Singapore and the mediation effect of frailty among psychosocial factors.

Methods

Using a cross-sectional analysis of 491 individuals over 65 years of age from 17 community centers, frailty conditions were grouped as Robust, Prefrail and Frail. Psychosocial profiles were collected through established Depression, Social Support, Quality of Life and Loneliness scales.

Results

Approximately 60.4% of the participants were between 65 and 74 years of age and 70.3% were women with 3.3% and 37.1% of participants rated as frail and pre-frail, respectively. Results indicated that depression, loneliness, and fall efficacy were significantly lower while social support and quality of life higher in the robust participants compared to prefrail and frail participants. Pathway analyses examined the mediation effect of frailty from psychosocial factors (depression, loneliness, social support) to quality of life. Depression had direct significant association with both frailty (B = 0.034, p <.001) and quality of life (B = -0.497, p <.001).

Conclusions

Frailty has been validated as a mediator on the pathway from psychosocial conditions to health. Psychosocial interventions should be considered further to reduce frailty and improve quality of life. Longitudinal research combining both physical and psychosocial factors are promising to explore the pathways to frailty and its adverse health outcomes.

Keywords: Frailty; Psychosocial Factors; Depression; Social Support; Loneliness; Pathway Analysis

Introduction

Worldwide and in Singapore, the population is ageing. Until now, Singapore’s older adults (aged 65 years and above) constitute 15.2% of the total population [1]. This is expected to be 53.4% in 2050 [2]. Frailty is a condition in which the individual is in a vulnerable state at increased risk of adverse health outcomes and/or dying when exposed to a stressor [3]. It is usually recognized in older adults and leads to adverse health effects [4,5]. Frail people have a significantly higher risk of falls, disability, long-term care and even leading to death [6,7]. In a report which reviewed 21 community-based cohort studies of 61,500 elderly people, the prevalence rate of frailty among older adults aged 65 or more is 9.9% [8]. Global data from more than 120,000 senior citizens of 28 countries suggests a 43.4% frailty incidence rate [9]. While it is generally believed that frailty increases with age, no consensus has been reached on the prevalence of frailty [8]. Singapore is a global business hub with 4.04 million residents, and the median age of the resident population rise to reach 41.5 years [1]. It is also one of the fastest ageing nations in the world. The old-age support ratio of residents computed as the ratio of residents aged 20-64 years for each resident aged 65 years and over, declined further to 4.3% until 2020 [1]. One of the most urgent ageing issues to address is frailty [10]. That is, high prevalence among older adults and increased risk of adverse health outcomes such as falls, disability, depression, hospitalization, medical costs, and mortality [4,11-14]. Singapore’s government has responded to the ongoing frailty movement [15]. In the past decade, many studies have examined the association between frailty and socio-demographic factors. However, few studies focus on the psychosocial factors and their impact on frailty prevalence in Singapore [13,15-17]. highlighted the need to investigate the psychosocial factors impacting frailty in older adults, vital to addressing the health and well-being of the rapidly ageing population in Singapore.

Many studies have tried to explain the mediators and moderators within the pathway of frailty and health outcome [18-20, 21] developed a working framework to elaborate the pathway from frailty to its adverse outcomes. In the meantime, [22]. and [18] also elaborated those psychosocial factors in a general matter for health and wellbeing. There are numerous research studies that investigated factors such as: (i) depression being associated with a higher risk of frailty [23-25]. and (ii) living alone lacking in social support and socially isolated had a higher risk of developing frailty [26-28]. Recent findings suggest being older, female, living alone, lacking regular exercise and poor health status are significantly associated with frailty prevalence [29-31] suggested the presence of adverse health outcomes, poor cognition, polypharmacy, sarcopenia, fall rate, living in a private institution or hospital and mortality are related to frailty. Similar findings are supported by [32]. where physiological issues such as poor weight management, disease, and poor psychological health contribute to frailty. Hence, according to Berkman’s model [18] and the frailty pathway framework [21]. we examined the existing pathway model on the effects of psychosocial factors on frailty and health outcomes among community-dwelling older adults. In a summary, using Singapore as a case example, the study aimed to investigate the prevalence and related psychosocial factors of frailty in older adults in Singapore and the main research question is: RQ: What are association between psychosocial factors and frailty and mediate role of frailty between psychosocial factors and Quality of Life (QoL)?

Methodology

Study design

This was a cross-sectional study using convenience sampling. Participants underwent a screening phase and a psychosocial profiling phase to gather pre-study data. In the screening phase, upon providing informed consent to take part in the study, participants were issued a questionnaire to gather their basic demographic information and proceeded with the screening session, in which participants were assessed using the frailty scale (Five-item Frail Scale) from [33]. In which the ratings were used to identify the state of frailty in the participants: non-frail (0); pre-frail (1-2); and frail (3-5). Frail participants did not proceed with physical performance assessments. Other self-reported questionnaires include the Katz Activities for Daily Living (ADLs) [34]. and Lawton’s Instrumental Activities of Daily Living (IADLs) [35]. as well as a Fall Efficacy Scale [36], were used. Other biomechanical/physical performance data were collected using the Short Physical Performance Battery (SPPB) [37]. Gait Speed [38]. One-Leg Stand and Grip Strength [33]. In the psychosocial profiling phase, an interviewer-administered questionnaire consisting of validated scales were used to gather data pertaining to participants’ psychosocial conditions to measure Depression, Social Support, Quality of Life, and Loneliness (Table 1). Trained personnel (who had undergone training by research staff/occupational therapist/physiotherapists) conducted the various physical performance assessment components. The study was a single research visit per participant. The entire process took approximately 1 hour per participant.

Measurements

5-Item frail scale

The FRAIL scale included 5 components: Fatigue; Resistance; Ambulation; Illness; and Loss of Weight. Frail scale score ranged from 0-5 (i.e., 1 point for each component; 0=best to 5=worst) and represented frail (3-5), pre-frail (1-2), and robust (0) health status.

Katz activities of daily living (ADLs)

Basic ADLs included seven items (bathing, dressing, eating, transferring bed or chair, walking across a room, getting outside, and using the toilet).

Lawton instrumental activities of daily living (IADLs)

IADLs included eight items (preparing meals, shopping for groceries, managing money, making phone calls, doing light housework, doing heavy housework, getting to places outside walking distance, and managing medications).

Short physical performance battery (SPPB)

The SPPB is a summary measure of lower body performance based on three-component tasks: standing balance; chairs stand; and usual walking speed. Each component task was scored as 0-4 (range 0=worst to 4 best), and a composite score was computed as the sum of scores on component tasks as 0-12 (range 0=worst to 12=best).

Gait speed

Gait speed was assessed in respondents’ homes using a standardized 4-meter course with participants instructed to walk at their usual pace. The average walking speed (meters/second) was computed for two trials.

One-leg stand

For the one-leg stand test, individuals chose their preferred leg to balance on and were required to raise the other foot at least 2 inches above the ground and hold the position for as long as possible up to 30 seconds.

Grip strength

Isometric grip strength was assessed using a digital handgrip dynamometer. The mean of the last two maximal effort trials were used in the analysis. The test was performed seated in a chair (without armrests), with feet flat on the floor and the other arm held flat against the side with the elbow at 90°.

Falls efficacy scale

The Falls Efficacy Scale (FES) measures confidence in performing 10 everyday activities without falling. The response for each FES item ranges from 0 (no confidence) to 10 (complete confidence) and the FES total score ranges from 0-100.

Depression

The Center for Epidemiologic Studies Depression Scale (CES-D) included 20 items comprising 6 scales reflecting major dimensions of depression [39]. depressed mood; feelings of guilt and worthlessness; feelings of helplessness and hopelessness; psychomotor retardation; loss of appetite; and sleep disturbance. It measured self-reported symptoms associated with depression experienced in the past week. Higher scores represent more depressive symptoms. A cut-off score of 16 indicates high depressive symptoms.

4 Social support

The Multidimensional Scale of Perceived Social Support (MSPSS) measured how much support a person feels he or she gets from family, friends, and significant others [40]. The items tended to divide into factor groups relating to the family (FAM), friends (FRI) or significant others (SO). (1=very strongly disagree, 2=strongly disagree; 3=mildly disagree; 4=neutral; 5=mildly agree; 6=strongly agree; 7=very strongly agree).

4 Quality of life

The EQ-5D-5L is a standardized instrument to measure generic health status [41]. It is made up of two components: health state description and evaluation. The health state description contained 5 dimensions with 5 response levels (no, slight, moderate, severe, or extreme). The evaluation part measured respondents’ overall health status on a visual analog scale (VAS).

4 Loneliness

This scale evaluated feelings of loneliness in individuals. An 8-item short form using a 4-point Likert scale ranging from 1, never, to 4, always. Minimum and maximum possible scores are 8 and 32, respectively. Higher scores from USL-8 corresponded to severe loneliness. A cut-off score of 24 was used to classify lonely and not lonely participants based on a previous study [42].

Data Collection

We conducted a survey study on the target population to identify frailty conditions and psychosocial profiles among older adults in Singapore. A total of 491 community-dwelling older adults were recruited from 17 Senior Activity Centers (SACs) / Voluntary Welfare Organizations (VWOs) in Singapore from March to September 2018. The inclusion criteria were: (i) Age >= 65 years (WHO, 2013); (ii) No significant cognitive deficits and can understand and follow instructions; (iii) No significant physical impairments and community ambulant; and (iv) Living in the community and not in a nursing home.

Results & Analyses

Calculations were made using the SPSS IBM 25.0 software. A chi-square (2) analysis was performed for intergroup sociodemographic and categorical data. Independent t-tests and analysis of variances were used on continuous data. Kruskal-Wallis H test was used when assumptions of normality and/or homogeneity was/were violated. Multiple regression was carried out with frailty score and quality of life as dependent variables. In all hypotheses, a significance level of α=0.05 was used, and a confidence interval of 95 % was accepted for statistical significance (p<0.05) at a 2-tailed level.

Demographics

A total of 491 eligible older adults took part in the study. The average age of the participants was (M=74.23, SD=6.25) and 127 were males. Socio-demographic findings showed that majority of the study participants were in the age group of 65-74 years (54.6%) in three major ethnic groups of Chinese (87.58%), Malay (8.96%) and Indian ethnic group (3.46%). Of the 491 participants, 6.52% were ascribed to tertiary education, unemployed (never worked and not working) (89.82%), married (56.1%) and living with family members (70.06%). The variables measuring health status showed that 39.31% of the study participants had at least two chronic conditions (the combination of hypertension, cardiovascular disease, arthritis, respiratory disease etc.) and 10.79% had depressive symptoms. About 3.46% reported feelings of loneliness.

Here are three findings:

Prevalence of frailty among community-dwelling older adults (65 years and above)

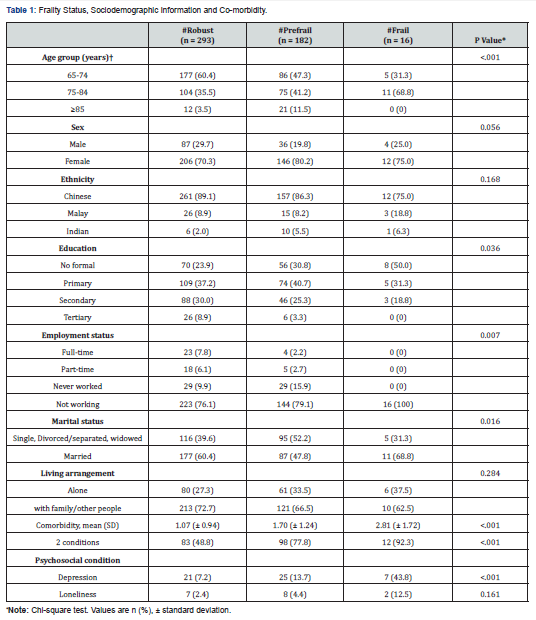
The prevalence of frailty among community-dwelling older adults aged 65 years old and above in Singapore was at 3.3%. Approximately 37.1% and 59.7% were identified as pre-frail and robust respectively. The socio-demographic information associated with frailty is shown in (Table 1). The prevalence of frailty increased significantly with age, p <.001 among those aged 60-74 years and 75 years and above, from 31.3% to 68.8% respectively. There was a higher prevalence of frailty among females, with marginal significance, p=.056. Among ethnic groups, a larger proportion of Chinese was robust as compared to the Malay and Indian ethnic groups. While ethnicity was not significantly associated with frailty status, it is interesting to note that the Indians had a higher proportion of pre-frails at 58.82% compared to those in robust, 35.29%. Education was significantly different across frailty status, p=.036. Half of the frail participants had no formal education followed by 31.3% and 18.1% in primary education and secondary education respectively. Employment status was significantly associated with frailty status, p=.007, where 100% of frail participants were not working. There was a higher proportion of married people who were robust (60.4%) compared to those who were single, divorced/separated, widowed (39.4%). Interestingly, more people were frail in the “Married” (68.8%) than “those otherwise/not married” categories (31.3%). A higher proportion of those who lived alone was frail (37.5%) than prefrail (33.5%) and robust (27.3%) (Table 2).

Association among frailty, functional status, fall efficacy, physical performance, psychosocial well-being, and health-related quality of life

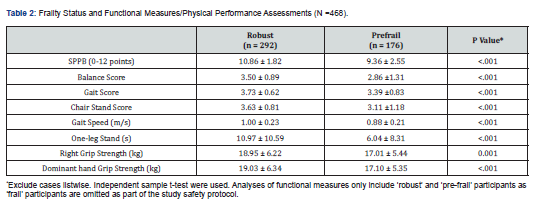
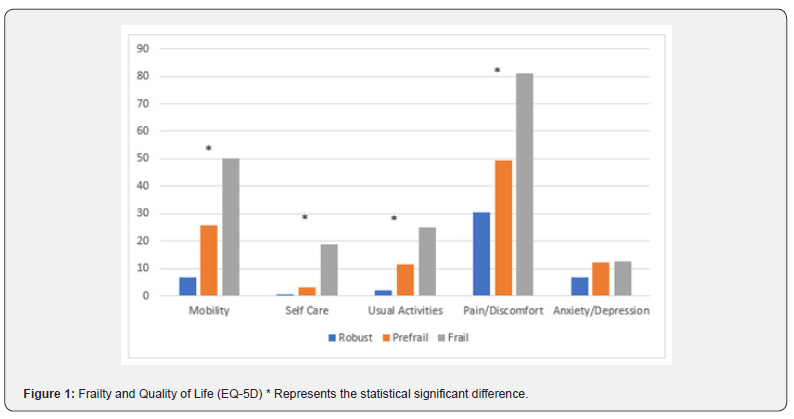
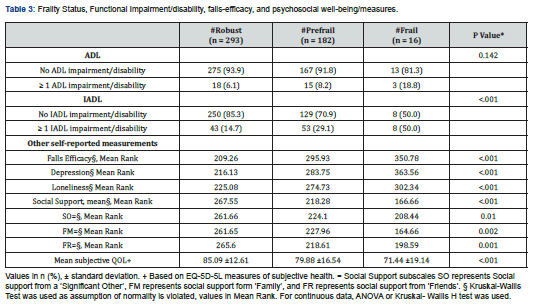
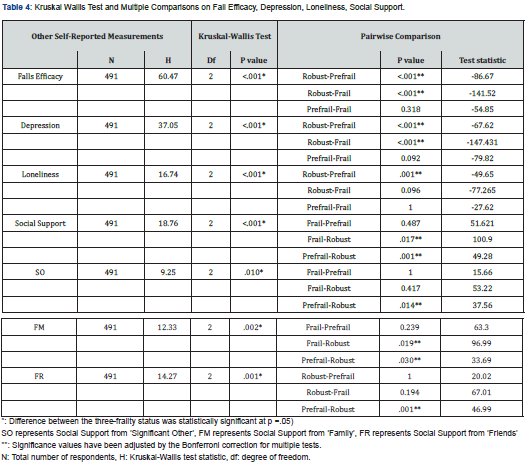
There was a significant difference in IADL functional status, where p < .001 but not ADL functional status. As frailty status progresses from robust to frail, the proportion of older adults with ADL/IAD impairment increases as shown in (Table 3). Significant differences were also seen in Fall efficacy where frail participants had higher mean rank scores compared to prefrail and robust participants (Table 3). Pairwise comparison comparing the three-frailty status be found in (Table 4). Physical performance measures were compared between robust and prefrail participants. Significant differences in physical performance measures between the two groups, p <.001 (Table 2). Robust participants had significantly higher SPPB scores, higher gait speed, better performance in one-leg stand time, and stronger dominant handgrip strength than those in prefrail, p <.001. Hence, for the second research question, we conclude that IADL functional status, fall efficacy and Physical performance are significantly associating with frailty. A significantly higher proportion of frail (43.8%) participants depressed/have high depressive symptoms than prefrail (13.7%) and robust (7.2%) participants, where p <.001. However, there was no significant difference in the proportion of participants who were lonely across frailty status. Significant differences were observed in loneliness and depression scores across frailty status, p < .001 (Table 2). Loneliness score was significantly higher in both prefrail and frail participants than robust participants, where p =.001. Robust participants had a significantly lower score depression score than prefrail and frail participants respectively, p <.001. Kruskal-Wallis H tests showed that there was a significant difference in overall social support between the different frailty status, χ2(2) = 18.76, p < .001. Multiple Pairwise comparisons showed that robust participants were significantly higher than frail participants (Mean Rank = 166.66), p =.017, and robust participants (Mean Rank =267.55) were significantly higher than pre-frail participants (Mean Rank = 218.28), p =.001. Social support from the subscales from friends (FR), family (FM), and a significant other (SO) was also found to be significant. Multiple pairwise comparisons results can be found in (Table 4). We measured frailty with health-related quality of life. Self-reported health status was significantly lower in frail, followed by prefrail, and robust participants (Table 3). Frailty was significantly associated with having problems in all domains of health dimensions where robust participants had the least problems except in anxiety/depression. (Figure 1) shows the percentage/proportion of frail, prefrail, and robust participants who had problems with all five health domains (EQ-5D). The top two domains frail participants had problems with were pain/discomfort (81.3%) and mobility (50%). Self-evaluated overall health status was significantly lower in frail participants followed by prefrail and robust (Table 3). Findings showed that factors affecting psychosocial well-being and health-related quality of life are significantly associated with frailty.

Validation of the mediation effect of frailty through pathway analyses

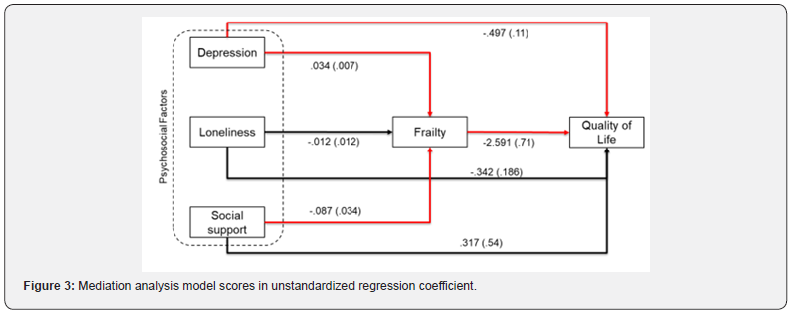
Based on the existing pathway models [19-21]. We selected the existing model linking psychosocial factors (X) to quality of life (Y), which is conditional if the indirect effect of X on Y through M (a mediator variable) depends on W (a moderator variable) (Figure 2). To validate the mediation effect of frailty among psychosocial factors and quality of life, two regression models to obtain the path coefficients to determine whether independent variables like depression, loneliness, social support, and frailty scores would significantly predict the quality of life, the outcome dependent variable. Multiple regression was run to predict the quality of life from loneliness, depression, social support, and frail scores. The multiple regression model statistically significantly predicted quality of life, F (4,485) = 25.891, p < .001, adj. R2 = .176. All variables added statistically significantly to the prediction, p < .05 except for social support, p = .558 and loneliness, p = .066. Regression coefficients and standard errors can be found in (Table 5). (Figure 3) shows the frailty mediational hypothesis model from psychosocial factors to quality of life. The red and black lines represent the significant and non-significant relationships. A cumulative odds ordinal logistic regression with proportional odds was run to determine whether depression, loneliness and social support affect the frail scores. A decrease in social support was associated with an increase in the odds of higher frail scores, with an odds ratio of .832 (95% CI, .711 to .972), Wald χ2(1) = 5.369, p = .020. An increase in depression scores was associated with an increase in the odds of higher frail scores, with an odds ratio of 1.071 (95% CI, 1.037 to 1.105), Wald χ2(1) = 17.814, p < .0005. A decrease in loneliness was not associated with an increase in the odds of higher frail scores, with an odds ratio of .982 (95% CI, .930 to 1.036), Wald χ2(1) = .444, p = .505. These results supported the existing mediational hypothesis model, which revealed that the indirect effect of depression, loneliness, and social support on quality of life was mediated by frailty. Depression had both direct and indirect impacts on quality of life.

Discussion

This study investigated the prevalence of frailty among community older adults (65 years and above) in Singapore. Based on our findings, the prevalence of frailty (3.3%) is similar to earlier study conducted from 2010 to 2013 in Singapore [16,17]. Compared to other countries where the prevalence of frailty ranged from 4% to 44% [8]. The prevalence of frailty among the older adults in Singapore is at the lower end of the spectrum at 3.3%, and early interventions at personal, community and societal levels are needed before the problem becomes serious. Results also revealed that the prevalence of frail and pre-frail states increased with age, which is in line with the general literature [8]. The study also showed that approximately 31.3% of those aged 60-75 years were frail, showing the importance of assessing frailty even among those aged <60 years. We observed ethnic differences in pre-frailty and frailty, concurring with findings from a study by [16]. Singapore primarily has three main ethnic groups, namely, Chinese (74.3%); Malays (13.5%); Indians (9.0%) [1]. Chinese older adults were found to have a lower prevalence of both frailty (2.79%) and pre-frailty (36.5%) at the bivariate level, compared to Indian older adults who were found to have almost twice the odds for frailty (5.88%) and pre-frailty (58.82%) (Table 1). However, Malay older adults have a prevalence of frailty (6.82%) and pre-frailty (34.09%). [43] and [44] pointed out that frailty is more prevalent in ethnic minorities, as cultural factors, and lifestyle choices in turn lead to variations in health habits and access to resources. Older adults may benefit from the multicultural society and environment in Singapore, hence the prevalent difference between the ethnic group is not significant. More longitudinal studies to understand relationships between frailty and social support are pertinent in formulating customized intervention programs for the different ethnic groups in Singapore.

While many studies have already done on predictors of physical frailty in older people, less is known on psychosocial factors for whom and how they exert their effects. Based on the Bergman conceptual framework and possible model identified recently [19,21]. The adopted conditional process model is the indirect effect of depression, loneliness, and social support on Quality of Life through frailty that is moderated (Figure 2). Observing associations between quality of life and conditions measured concurrently does not necessarily permit understanding of the direction of effect. Rather, these associations describe how Quality of Life levels vary with a broad set of psychological conditions in older people. Based on our findings, frailty is one mediator among the psychosocial factors to Quality of Life, while age, gender, ethnicity, education, employment, and marital status are possible moderators on pathways from psychological conditions to Quality of Life.

Conclusion

As a summary, establishing frailty prevalence and its related psychosocial factors is undoubtedly important for both clinical practice and the national healthcare system. According to our study results, the prevalence of frailty and pre-frailty are 3.3% and 37.1%; the results also investigated the association between psychosocial factors and frailty and mediate role of frailty between psychosocial factors and Quality of Life. The study has several clinical, research, and policy implications. Though sampling participants and periods are limited, the psychosocial factors impacting frailty may be underestimated. Preliminary findings have shown the factors (social support, depression, loneliness and fall efficacy) associated with frailty and pre-frailty which require a need for greater collaboration between health professionals, social services and researchers concerned with the health and well-being of older adults in the community. This study’s findings confirmed that depression, loneliness, and social support have direct and indirect impacts on quality of life. Hence, a good social functioning with the meaningful networked community is important as it nudges healthy ageing and reduced vulnerability [45]. And loneliness.


To Know more about Juniper Online Journal of Public Health
Click here: https://juniperpublishers.com/jojph/index.php

To Know more about our Juniper Publishers
Click here: https://juniperpublishers.com/index.php


Tuesday, April 23, 2024

Unveiling the Intersection of Age and Gender in the Emotional Well-being of Older Students: A Pilot Study at the Permanent University for Adults in Alicante (Spain) - Juniper Publishers

 Gerontology & Geriatric Medicine - Juniper Publishers

Abstract

This study assesses the emotional impact and well-being of older students at the Permanent University for Adults in Alicante (UPUA), focusing on how demographic characteristics, specifically age and gender, influence these perceptions. Utilizing a descriptive and analytical design, a sample of older students was analyzed by applying self-administered questionnaires to collect quantitative data. The results highlight significant differences in emotional well-being related to age and gender, as well as variations in the perception of loneliness and life satisfaction. The study also identifies questionnaire items that, depending on their correlation and relevance, suggest areas for intervention to improve the quality of life and educational experience of this population. This comprehensive approach provides a foundation for the development of personalized educational strategies aimed at promoting emotional well-being among older adults.

Keywords: Well-Being; Emotions; Older Adults; Lifelong Education; Statistical Analysis

Abbreviations: UPUA: University for Adults in Alicante, ANOVA: Analysis of Variance, H1: Hypothesis 1, H2: Hypothesis 2, H3: Hypothesis 3, H4: Hypothesis 4, H5: Hypothesis 5

Introduction

This research examines the impact on emotional well-being and quality of life of older students at the Permanent University of Alicante (UPUA), with a special focus on the influence of demographic variables such as age and gender on these aspects [1-3]. Through the adoption of both descriptive and analytical methodological approaches, the study was conducted on a selection of senior students using self-administered surveys for the collection of quantitative data [4-7]. The findings indicate significant differences in emotional well-being, directly associated with individuals' age and gender, as well as variations in perceptions of loneliness and life satisfaction levels [8-14]. Similarly, this analysis identified certain survey items that, due to their correlation and significance, suggest the potential for intervention in specific areas to enhance quality of life and optimize the educational experiences of this group [15-18].

This comprehensive approach establishes a conducive framework for the creation of tailored educational strategies aimed at promoting greater emotional well-being in the older adult population [18-20]. Aging is recognized as a phase of human development characterized by significant transformations both personally and socially. During this period, psychosocial well-being becomes a critical element influencing the quality of life of the elderly [15-17]. With the increase in life expectancy and improvements in health standards, education emerges as a conducive field for promoting social integration, independence, and personal satisfaction within this demographic group [20-25]. The significance of this research line lies in unraveling how educational interventions can act as a mechanism to foster well-being in the elderly population, a segment experiencing exponential growth in contemporary society [13].

Previous studies have explored the correlation between lifelong education and well-being in old age, highlighting the value of activities that promote social inclusion, cognitive development, and the maintenance of independence [26-28]. Theoretical frameworks, such as those proposed by Ryff [29-37], have conceptualized well-being from various perspectives, including autonomy, personal growth, positive interpersonal relationships, self-acceptance, purpose in life, and the ability to manage one's environment [38-42]. Despite the extensive literature, questions remain about how the components of well-being and educational experiences specifically articulate during the aging process. This article, along with others previously published [24,43-45], is oriented toward this line of inquiry.

A research gap is identified regarding the interaction between different dimensions of well-being and their modulation by participation in educational initiatives aimed at the elderly population. Furthermore, there is a noted lack of studies that combine quantitative and qualitative methodologies to capture the elderly's subjective well-being experiences within the educational context, suggesting a call for more thorough investigation [46,47]. This study seeks to address this gap by adopting a mixed-methodology approach that explores the complexity of well-being in old age and how it can be enhanced with educational strategies tailored to their specific needs, within the recently coined concept of Educational Anamnesis [44].

Objectives

General Objective: To assess the emotional impact and well-being of older students at the Permanent University of Alicante (UPUA), determining how demographic characteristics such as age and gender influence these perceptions and experiences, with the aim of developing interventions to improve their quality of life and educational experience.

Specific Objectives:

1. To describe the age and gender distribution of the older students participating in the research to identify possible patterns or trends that may influence the reported emotional impact and well-being.

2. To examine how the age and gender of older students affect their responses to items related to emotional and social well-being, using statistical analyses like ANOVA to identify significant differences.

3. To use reliability measures, such as corrected item-total correlation and Cronbach's Alpha, to determine which questionnaire items accurately reflect the emotional impact and well-being among older students and adjust the questionnaire accordingly.

4. To determine which questionnaire items are most closely associated with variations in well-being and emotional impact among different age and gender groups, to identify potential risk and protective factors.

5. To propose, based on the findings, specific strategies aimed at improving the emotional well-being and educational experience of older students at the UPUA, considering the particular needs identified through demographic analysis.

6. To expand the existing knowledge on how continuing education in older adulthood can influence emotional and social well-being, offering empirical data and recommendations based on the evaluation conducted at the UPUA.

7. To use the findings of the research to inform and guide future studies on emotional well-being in adult education contexts, as well as to improve educational and support practices at the Permanent University of Alicante and similar institutions (Figure 1).

Research Hypotheses

4.2.1. Main Hypothesis: The emotional well-being and perceptions of loneliness, life satisfaction, and attitudes towards the future among older students at the UPUA significantly vary according to demographic characteristics, specifically age and gender, suggesting the need for developing personalized interventions to enhance their quality of life and educational experience.

Specific Hypotheses:

1. Hypothesis 1: There are clear patterns in the age and gender distribution among older students participating in the UPUA, influencing their reported emotional impact and well-being. It is expected that the predominance of students aged 66-75 and a higher female representation have implications in the analysis of emotional and social well-being.

2. Hypothesis 2: The age and gender of older students significantly affect their responses to items related to emotional and social well-being. In particular, it is hypothesized that older students and women may report higher levels of loneliness and concerns about the future.

3. Hypothesis 3: The questionnaire items measuring emotional impact and well-being do not exhibit uniform internal consistency across the studied population, suggesting that some items may be more relevant or interpreted differently by various demographic groups.

4. Hypothesis 4: Certain questionnaire items are more closely associated with variations in well-being and emotional impact among different age and gender groups, acting as risk or protective factors. For example, the perception of loneliness and difficulties in steering life towards a satisfactory path are anticipated to vary significantly with age.

5. Hypothesis 5: Based on demographic and item analyses, specific recommendations can be developed to improve the emotional well-being of older students at the UPUA, such as programs aimed at fostering social interaction and emotional support, especially for the most susceptible groups identified in the study.

6. Hypothesis 6: The research will contribute to the literature on older adult education and emotional well-being by providing empirical evidence on how demographic characteristics influence these dimensions, and by offering practical recommendations based on the findings.

7. Hypothesis 7: The findings of this study will inform and guide future research and educational practices to enhance emotional well-being in older adult education contexts, emphasizing the importance of considering demographic differences in the design of interventions and educational programs.

Methodology

A descriptive and analytical design will be employed to examine the influence of demographic variables on the well-being and emotional impact of older students at the Permanent University of Alicante (UPUA). The study will focus on cross-sectional analyses to understand how age and gender affect emotional well-being and perceptions of loneliness, life satisfaction, and attitudes towards the future, based on a single point in time. The sample will consist of older students from the UPUA, aged between 46 and 85 years, selected from those enrolled in specific subjects. Inclusion criteria will include currently being enrolled in UPUA courses and voluntarily consenting to participate in the research. The gender and age distribution of the sample will reflect the proportions found in the preliminary study population, with an emphasis on understanding emotional well-being differences within this specific age range.

Self-administered questionnaires (Ryff), based on items reflecting the dimensions of emotional and social well-being identified in preliminary research, will be utilized. These questionnaires will include questions about loneliness, life satisfaction, perceptions of the future, and social relationships. The procedure will involve direct invitations in classes and emails to participants. Questionnaires will be administered at the beginning of the course and collected at the end of it to assess the state of well-being at a specific time. Descriptive analyses will be used to summarize the demographic characteristics of the sample and the distributions of questionnaire responses. To evaluate the structure of well-being dimensions, an exploratory factor analysis based on questionnaire responses will be applied. Correlation tests and analysis of variance (ANOVA) will be employed to explore the relationships between emotional well-being, age, and gender of participants. Linear regression analyses will be used to investigate the predictive impact of demographic variables and participation in educational activities on emotional well-being.

Results

Below are the findings from the Descriptive Analysis, presenting measures of central tendency and dispersion.

Age:

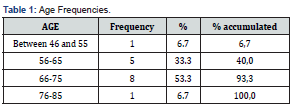
The age composition of the sample is characterized by a predominant concentration in the range of 66-75 years, representing 53.3% of the total, followed by the group aged 56-65 years with 33.3%. The age ranges of 46-55 and 76-85 years show minimal representation, each accounting for 6.7% of the sample. This age distribution skewed towards older age groups suggests potential limitations in generalizing the study's results to a broader age spectrum. Such concentration in a specific age range could influence the interpretation of the data, necessitating consideration of the impact of this imbalance when analyzing participant responses. Although this pilot study reflects the demographic characteristics of UPUA students, with a notable age diversity, future analysis will need to adjust for this uneven distribution to ensure the validity of identified age-related comparisons or correlations (Table 1).

Gender:

The sample studied exhibits an unbalanced gender distribution, with a predominance of the female gender, constituting 60% compared to 40% of the male gender. This gender disparity could significantly impact the interpretation of the results, necessitating careful analysis of how this bias might affect the generalization of the findings to more gender-equitable populations. The female predominance in the sample implies that any identified trend or pattern must be evaluated considering this imbalance, to ensure the applicability and relevance of the results in more balanced demographic contexts. Thus, similar to the age distribution, the imbalance in gender representation underscores the need to address these differences when interpreting the responses and formulating conclusions within the study (Table 2).

Item Analysis:

The sample is relatively small (N=15), which limits the generalization of the results. Given that this is a preliminary analysis before a more general one with a spectrum of over a hundred samples, the limitation is accepted in favor of generating important data for subsequent analysis with a more significant sampling. The interesting interpretation of the descriptive analysis of the current sample, due to its extent, has already been performed in other publications, to which we refer [24,43].

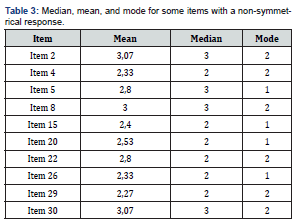
Median and Mode:

For several items, the median and mode differ from the mean, which may indicate a non-symmetrical distribution of responses. This is important for correctly interpreting central trends. A key indicator is when the mean does not match the median or mode, suggesting an asymmetric distribution of responses (Table 3). reflects the differences between the mean, median, and mode for such items. Each item relates to personal experiences or perceptions, and the differences in the measures of central tendency give us clues about the distribution of the respondents' answers. Thus, in Item 2 ("I often feel lonely because I have few close friends to share my concerns with"), the mode is significantly lower than the median and the mean, indicating that a larger number of respondents chose the option corresponding to the lowest value on the scale, suggesting that loneliness is a common experience. In Item 5 ("I find it difficult to steer my life in a direction that satisfies me"), there is a notable asymmetry, with the mode being lower (1.00), implying that many participants find it very difficult to direct their lives satisfactorily, much more than the median and the mean suggest.

Item 15 and Item 20 show modes at 1.00, indicating that the option of the lowest value on the scale is the most frequent, which may signal a tendency towards problems with the influence of others or the perception of having fewer friends, respectively. Finally, in Item 30 ("I stopped trying to make significant improvements or changes in my life a long time ago"), the mean and the median are aligned at the highest value (3.00), but the mode drops back to 2.00, indicating that, although the central tendency leans towards disagreement with the statement, a more frequent response leans towards agreement.

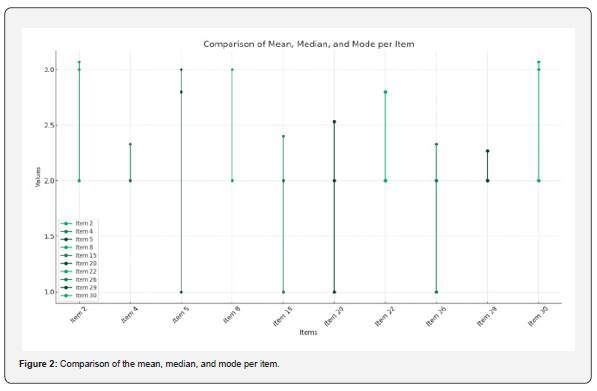
In Figure 2, these differences are visualized with vertical lines connecting the mode, the median, and the mean for each item. The longer lines indicate a greater discrepancy between the three measures. For example, a long vertical line on the graph, as seen in Item 5, highlights a considerable asymmetry in the responses. En definitiva, este gráfico y los datos asociados nos muestran que, para varios ítems, la percepción o experiencia más común (moda) no siempre se alinea con la mediana o la media, indicando distribuciones sesgadas y la importancia de considerar todas las medidas de tendencia central al interpretar los resultados de la encuesta. Las respuestas tienden a estar polarizadas, con una proporción significativa de los encuestados sintiéndose más extremos en sus experiencias o percepciones que lo que la media podría sugerir. Esto es crítico para entender el verdadero sentimiento o las opiniones de los encuestados y para tomar decisiones basadas en estos datos.

Analysis of Item Statistics

Due to the reasons previously described, we will analyze the variability in responses to the questionnaire items. This can be evaluated using statistics, including corrected item-total correlation, squared multiple correlation, and Cronbach's Alpha if the item is removed. The Corrected Item-Total Correlation measures how well a particular item correlates with the sum of the other items. A higher value suggests that the item is more aligned with the overall construct measured by the questionnaire. On the other hand, Cronbach's Alpha if Item Removed shows how the Cronbach's Alpha of the questionnaire would change if that particular item were removed. An increase in Alpha upon removing an item suggests that the item may not be well aligned with the rest of the questionnaire.

Items vary in their correlation with the total of the questionnaire, indicating that some are more aligned with the overall construct than others. Some items, when removed, could increase the Cronbach's Alpha, suggesting they are not contributing to the internal consistency of the questionnaire. This may indicate variability in how each item is perceived or related to the questionnaire's central theme. There is likely variability in how different elements are interpreted or valued by respondents. This variability could be due to differences in personal interpretations, life experiences, or demographic characteristics such as age.

To determine which items could be removed and if it is feasible to relate this to the age difference, we will analyze the data, focusing primarily on Cronbach's Alpha if the item is removed. This value indicates whether the internal consistency of the questionnaire improves or worsens by removing a specific item.

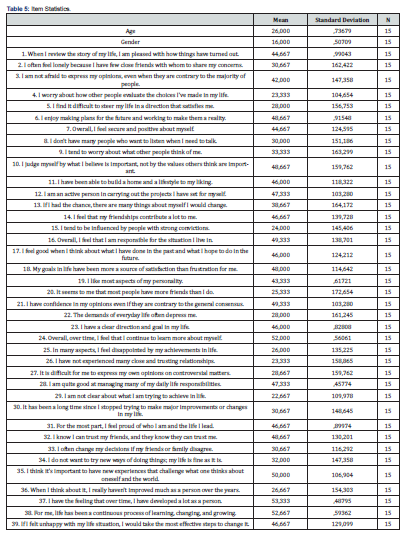
Thus, we look for Items with a Negative Impact on Consistency, whose removal increases Cronbach's Alpha, suggesting they do not align with the questionnaire's overall construct. For example, the item "4. I worry about how other people evaluate the choices I've made in my life." has an Alpha if removed of .605, higher than the overall Alpha of .580, indicating that its removal could improve the consistency of the questionnaire (Table 4,5).

Conversely, we seek Items with a Positive or Neutral Impact on Consistency, that is, those items whose removal decreases the Alpha or maintains it similarly, indicating an alignment with the questionnaire's overall construct. For example, the item "9. I tend to worry about what other people think of me." has an Alpha if removed of .513, suggesting it is an important element for the consistency of the questionnaire.

Relationship with Age: Analysis of Variance (ANOVA):

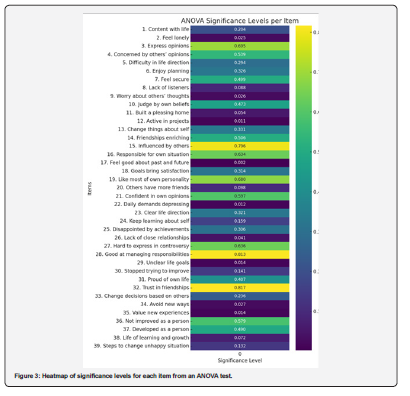
Figure 3 is a scatter plot (or heatmap) of significance levels for each item from an ANOVA test, showing how the variability in respondents' answers to different survey items might be related to age. The heatmap uses colors to represent the ANOVA test significance levels for each item. Darker colors (green to purple) indicate lower levels of significance, suggesting there are statistically significant differences between age groups in responses to those items. Conversely, lighter colors (yellow) indicate higher levels of significance, suggesting there are no significant differences. In this regard, Item 2 ("Feel lonely"), with a significance level of 0.025, shows significant differences between age groups. This suggests that feelings of loneliness may be experienced differently depending on the respondent's age.

Item 9 ("Worry about others’ thoughts"), with a significance level of 0.026, indicates that concerns about what others think vary significantly with age. Item 12 ("Active in projects"), with a significance level of 0.011, shows that there are significant differences in the activity of personal projects among age groups. Item 17 ("Feel good about past and future"), with a very low significance level of 0.002, indicates that satisfaction with the past and expectations for the future differ considerably across different ages. Item 22 ("Daily demands depressing"), with a significance level of 0.012, suggests that how daily demands affect respondents' mood varies with age. Item 26 ("Lack of close relationships"), with a significance of 0.041, indicates differences between age groups in the experience of close and trusting relationships. Item 29 ("Unclear life goals"), with a significance level of 0.014, signals significant differences in the clarity of life goals among different ages. Item 34 ("Avoid new ways"), with a significance level of 0.027, presents statistically significant variations in the willingness to try new ways of doing things according to age. Finally, Item 35 ("Value new experiences"), with a significance of 0.014, suggests that the valuation of new experiences that challenge personal perceptions varies with age.

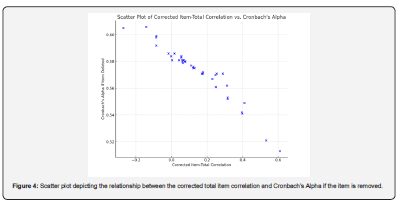
In the scatter plot of Figure 4, the relationship between the corrected total item correlation and Cronbach's Alpha if the item is removed is depicted. Each point on the graph corresponds to one of the survey items. The x-axis displays the corrected total item correlation, which measures how well each item correlates with the sum of the other items. The y-axis shows Cronbach's Alpha if the item is removed, indicating the internal consistency of the scale if that particular item were to be removed. Items that have a high corrected total correlation and a lower Cronbach's Alpha if removed are generally considered more essential for the scale's reliability. Conversely, items with a low or negative corrected total correlation and a higher Cronbach's Alpha if removed could be candidates for removal to improve the overall reliability of the scale.

For instance, Item 2 ("Feel lonely") has a high corrected total correlation with the rest of the scale and simultaneously shows significant differences between age groups, indicating that the feeling of loneliness is a consistent factor in the scale that varies with age. This suggests that loneliness is a universal concern manifesting differently across ages and is a reliable element within the survey to measure that sentiment.

Item 9 ("Worry about others’ thoughts"), with a similar significance and likely a high correlation with the rest of the scale, suggests that this aspect of concern about others' opinions is another factor that is not only relevant in terms of internal consistency but also varies with the age of the participants. Similarly, Item 12 ("Active in projects") and Item 17 ("Feel good about past and future"), with their respective significance levels, can be interpreted similarly. The variability in responses and their relationship with age can provide valuable insights into how activity in projects and satisfaction with the past and future are influenced by age.

For items like 22 ("Daily demands depressing"), 26 ("Lack of close relationships"), 29 ("Unclear life goals"), 34 ("Avoid new ways"), and 35 ("Value new experiences"), the statistical significance and their relationship with age tell us that these aspects of daily life and self-perception and future outlook are areas that are strongly influenced by age. Therefore, the joint interpretation of the scatter plot and ANOVA analyses suggests that the survey scale is not only reliable but also relevant for capturing generational differences in various dimensions of human experience.

In the scatter plot of Figure 4, the relationship between the corrected total item correlation and Cronbach's Alpha if the item is removed is depicted. Each point on the graph corresponds to one of the survey items. The x-axis displays the corrected total item correlation, which measures how well each item correlates with the sum of the other items. The y-axis shows Cronbach's Alpha if the item is removed, indicating the internal consistency of the scale if that particular item were to be removed. Items that have a high corrected total correlation and a lower Cronbach's Alpha if removed are generally considered more essential for the scale's reliability. Conversely, items with a low or negative corrected total correlation and a higher Cronbach's Alpha if removed could be candidates for removal to improve the overall reliability of the scale.

For instance, Item 2 ("Feel lonely") has a high corrected total correlation with the rest of the scale and simultaneously shows significant differences between age groups, indicating that the feeling of loneliness is a consistent factor in the scale that varies with age. This suggests that loneliness is a universal concern manifesting differently across ages and is a reliable element within the survey to measure that sentiment. Item 9 ("Worry about others’ thoughts"), with a similar significance and likely a high correlation with the rest of the scale, suggests that this aspect of concern about others' opinions is another factor that is not only relevant in terms of internal consistency but also varies with the age of the participants.

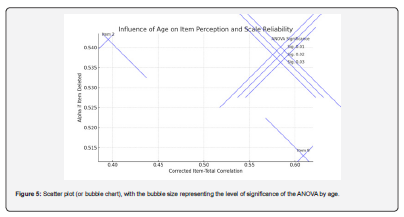
Similarly, Item 12 ("Active in projects") and Item 17 ("Feel good about past and future"), with their respective significance levels, can be interpreted similarly. The variability in responses and their relationship with age can provide valuable insights into how activity in projects and satisfaction with the past and future are influenced by age. For items like 22 ("Daily demands depressing"), 26 ("Lack of close relationships"), 29 ("Unclear life goals"), 34 ("Avoid new ways"), and 35 ("Value new experiences"), the statistical significance and their relationship with age tell us that these aspects of daily life and self-perception and future outlook are areas that are strongly influenced by age. Therefore, the joint interpretation of the scatter plot and ANOVA analyses suggests that the survey scale is not only reliable but also relevant for capturing generational differences in various dimensions of human experience (Figure 5).

Discussion

The discussion of the results obtained in this study reveals an underlying complexity in the relationship between emotional well-being, lifelong education, and the demographic characteristics of older adults, particularly in the context of the Permanent University of Alicante (UPUA). This analysis resonates with previous research, which has also explored how participation in educational activities can influence various dimensions of well-being in older age [48-52]. The confirmation of our hypotheses underscores the need for a more personalized approach in designing educational programs for this population, a conclusion consistent with findings from similar studies.

In line with Hypothesis 1 (H1), suggesting a significant influence of age and gender on emotional well-being, our research aligns with studies highlighting differences in how older adults experience loneliness and life satisfaction [8,11,12]. Previous studies have shown that older women tend to report higher levels of loneliness than men, a finding that reflects the unequal gender distribution observed in our sample and its implications on emotional well-being [53].

The confirmation of Hypothesis 2 (H2) in our study, highlighting the impact of age and gender on well-being questionnaire responses, parallels research examining how these demographic variables modulate the perception of well-being and the impact of educational interventions. The literature suggests that educational programs tailored to specific gender and age needs can have more marked positive effects on participants' emotional well-being [22,24,54].

Regarding Hypothesis 3 (H3), addressing the internal consistency of the questionnaire items, our research emphasizes the importance of considering the peculiarities of each demographic group when designing assessment tools. This approach is supported by studies criticizing the universal application of measurement instruments without accounting for cultural, gender, or age differences, which could lead to misinterpretations of the data [8,9,16,55,56].

Identifying risk and protection factors associated with emotional well-being, according to Hypothesis 4 (H4), is supported by literature highlighting the complexity of older adults' life experiences and how these influence their well-being. Tailoring educational activities to specifically address these factors can significantly increase their effectiveness, a conclusion that reinforces the need for personalized educational interventions [1,2,24,43,57,58].

Finally, the ability to develop specific recommendations to improve emotional well-being, in line with Hypothesis 5 (H5), highlights the practical value of integrating research findings into the planning and execution of educational programs for older adults. Similar experiences in other analyses point to the efficacy of evidence-based educational strategies designed to meet the emotional and cognitive needs of this population [23,25,59-62].

Conclusions

This study focused on assessing the emotional impact and well-being in a sector of the older student population at the Permanent University of Alicante (UPUA), as a pilot test, highlighting the influence of demographic variables such as age and gender on these perceptions and experiences. Through a methodological approach that integrated the analysis of self-administered questionnaires, a detailed understanding of the dynamics of well-being in this demographic group was obtained. The results allowed for verifying the extent to which the proposed hypotheses were met, confirming significant variability in emotional well-being and related perceptions with demographic characteristics.

The hypothesis that emotional well-being and related perceptions of loneliness, life satisfaction, and attitudes toward the future vary significantly according to age and gender, as reflected in the statistical analyses performed. The predominant distribution of students in the 66-75 age range and a greater female representation in the sample revealed differences in the perception of loneliness and well-being, supporting Hypothesis 1 (H1). This suggests a need to consider these variables when developing interventions to improve well-being in this population segment.

The analyses showed that both age and gender have a significant impact on how older students experience and report their emotional well-being, corroborating Hypothesis 2 (H2). Moreover, it was observed that not all questionnaire items exhibited uniform internal consistency across the studied population, indicating that some items might not be universally applicable for measuring well-being in this diverse population, confirming Hypothesis 3 (H3). This suggests the presence of variability in the perception or valuation of the items, depending on demographic characteristics.

The identification of risk and protection factors for emotional well-being associated with age and gender, varying significantly between different groups, supported Hypothesis 4 (H4). This indicated specific areas where older students might require additional support. Based on the analyses, it was possible to develop specific recommendations to improve the educational experience and emotional well-being of older students at the UPUA, thus fulfilling Hypothesis 5 (H5).

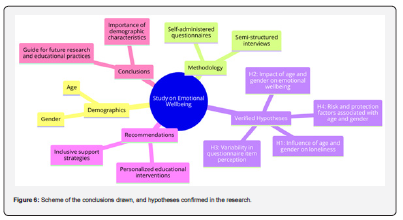
This study underscores the importance of considering demographic characteristics when assessing and addressing the emotional well-being of older students, highlighting the need for personalized educational interventions and support strategies that take into account age and gender. The findings contribute to the existing literature by providing empirical evidence on the relationships between lifelong education, emotional well-being, and demographic variables in old age, guiding future research and educational practices towards more inclusive and sensitive approaches to individual differences (Figure 6).


To Know more about our Juniper Publishers
Artificial Intelligence System for Value Added Tax Collection via Self Organizing Map (SOM)- Juniper Publishers
  Forensic Sciences & Criminal Investigation - Juniper Publishers Abstract Findings:  Based on our experiments, our approach is an effec...