Gynecology and Womens Health - Juniper Publishers
Summary
In this case study, the author analyzed, predicted, and interpreted a type 2 diabetes (T2D) patient’s hemoglobin A1C variance or A1C value based on nine time periods, ~5 months each, utilizing the GH-Method: math-physical medicine (MPM) approach. He utilized the same method and calculation formulas since 1/1/2014. This particular article emphasizes the ninth period (Period I) ranging from 5/20/2019 to 10/21/2020. Unlike the previous eight periods, in the ninth period, he used the continuous glucose monitor (CGM) sensor collected glucose data, which he implemented with the recently developed linear elastic glucose behavior theory (Reference 7, No. 352) to calculate his postprandial plasma glucose (PPG) difference.
Utilizing an auto-learning and auto-correction technique of artificial intelligence (AI), his software system would learn from lab-tested A1C values and then make necessary corrections. Therefore, in Period I, he utilized a higher conversion factor of 17.13 from glucose to HbA1C instead of 12.5 in the previous seven periods (Period A throughout Period G). He wrote two articles for the eighth period (Period H) using 12.5 (No. 329) and 17.13 (No. 329B), respectively. The difference on the final HbA1C results is a mere 0.01% which increased his predicted HbA1C from 6.31% to 6.39%, while the lab-tested HbA1C was 6.4% [1-6].
There are 10 hemoglobin A1C lab-tested results, with his 10 predicted HbA1C values using his developed methods:
a)6.7% on 4/9/2017 (predict 6.7%)
b)6.1% on 9/12/2017 (predict 6.1%)
c)6.9% on 1/26/2018 (predict 6.9%)
d)6.5% on 6/29/2018 (predict 6.5%)
e)6.6% on 10/22/2018 (predict 6.6%)
f)6.8% on 4/4/2019 (predict 6.8%)
g)6.6% on 9/25/2019 (predict 6.6%)
h)6.6% on 12/20/2019 (predict 6.6%)
i)6.4% on 5/20/2019 (predict 6.4%)
j)6.2% on 10/21/2020 (predict 6.2%)
It should be pointed out that all of his 10 predicted HbA1C values match 100% with his lab-tested HbA1C values. The author focused on nine periods over 1,299 days. It contains 3,897 meal data, including key contribution factors such as carbs/sugar intake, post-meal exercise, weather, and more. This study demonstrated a high degree of accuracy for the calculation and prediction of the patient’s forthcoming HbA1C value by using the GH-Method: math-physical medicine approach. In this article, the author also utilized CGM sensor glucose data with AI-tuned conversion factor between glucose and HbA1C. Furthermore, he also implemented his developed linear elastic glucose behavior theory [7] for his PPG calculation in order to obtain a better estimation for the final HbA1C value. Once the healthcare professionals and T2D patients understand the HbA1C mathematical prediction method, then the overall diabetes condition for the patient can be easier to control. The purpose for this research paper is to help people with T2D by preventing further damage to their internal organs caused by elevated A1C values, before taking the laboratory test [1,2].
If healthcare professionals and diabetes patients have an interest to delve deeper regarding the formation of tested glucose and mathematical predicted A1C, they should focus on the influential factors and their respective weighted contribution percentages described in the author’s previous papers.
Here is the summary:
a)The most important month which contributes to the A1C is the month prior to the lab test.
b)PPG contribute > 2/3 of HbA1C.
c)Body weight controls ~77% or more of the fasting plasma glucose (FPG) which contributes <1/3 of HbA1C; therefore, it is important to keep BMI below 25.
d)Carbs/sugar amount contributes ~39% to PPG. For T2D patients, it is safe to keep carbs/sugar intake amount below 15 grams per meal.
e)Post-meal walking steps contributes ~41% to PPG. It is recommended to maintain post-meal walking exercise around 4,000 steps after each meal.
f)A combined effort of diet and exercise controls ~80% to PPG formation [3,4].
Introduction
In this case study, the author analyzed, predicted, and interpreted a type 2 diabetes (T2D) patient’s hemoglobin A1C variance or A1C value based on nine time periods, ~5 months each, utilizing the GH-Method: math-physical medicine (MPM) approach. He utilized the same method and calculation formulas since 1/1/2014. This particular article emphasizes the ninth period (Period I) ranging from 5/20/2019 to 10/21/2020. Unlike the previous eight periods, in the ninth period, he used the continuous glucose monitor (CGM) sensor collected glucose data, which he implemented with the recently developed linear elastic glucose behavior theory (Reference 7, No. 352) to calculate his postprandial plasma glucose (PPG) difference. Utilizing an auto-learning and auto-correction technique of artificial intelligence (AI), his software system would learn from lab-tested A1C values and then make necessary corrections. Therefore, in Period I, he utilized a higher conversion factor of 17.13 from glucose to HbA1C instead of 12.5 in the previous seven periods (Period A throughout Period G). He wrote two articles for the eighth period (Period H) using 12.5 (No. 329) and 17.13 (No. 329B), respectively. The difference on the final HbA1C results is a mere 0.01% which increased his predicted HbA1C from 6.31% to 6.39%, while the lab tested HbA1C was 6.4% [5,6].
Material and Methods
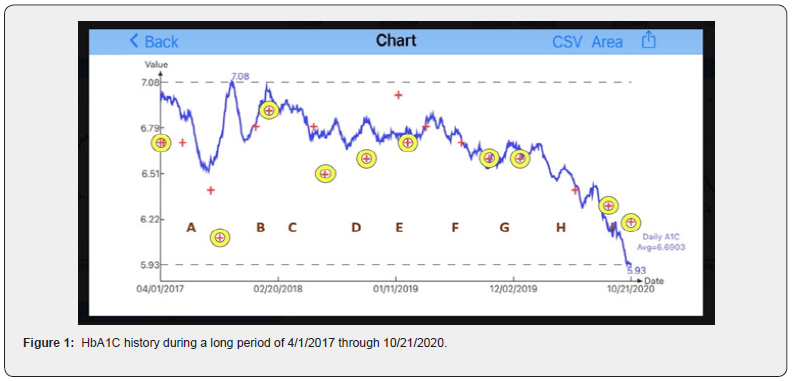
As shown in Figure 1, there are 10 hemoglobin A1C labcheckup results, with his 10 predicted HbA1C values using his developed methods:
a) 6.7% on 4/9/2017 (predict 6.7%)
b) 6.1% on 9/12/2017 (predict 6.1%)
c) 6.9% on 1/26/2018 (predict 6.9%)
d) 6.5% on 6/29/2018 (predict 6.5%)
e) 6.6% on 10/22/2018 (predict 6.6%)
f) 6.8% on 4/4/2019 (predict 6.8%)
g) 6.6% on 9/25/2019 (predict 6.6%)
h) 6.6% on 12/20/2019 (predict 6.6%)
i) 6.4% on 5/20/2019 (predict 6.4%)
j) 6.2% on 10/21/2020 (predict 6.2%)
It should be pointed out that all of his 10 predicted HbA1C values match 100% with his lab-tested HbA1C values.
The author selected nine periods of almost equal length with ~5 months each, then observed their measured A1C changes (variances) against the previous period as follows:
a. Period A (4/1/2017 - 8/31/2017): -0.6%
b. Period B (9/1/2017 - 1/31/2018): +0.8%
c. Period C (2/1/2018 - 6/30/2018): -0.4%
d. Period D (6/29/2018 - 10/22/2018): +0.1%
e. Period E (10/22/2018 - 4/4/2019): +0.2%
f. Period F (4/4/2019 - 9/25/2019): -0.2%
g. Period G (9/25/2019 - 12/20/2019): +0.0%
h. Period H (12/20/2019 - 5/20/2020): -0.2%
i. Period I (5/20/2020 - 10/21/2020): -0.2%
He applied his developed GH-Method: math-physical medicine approach along with the following seven contribution factors of HbA1C:
(1) A1C variances contributed by FPG between 15% to 35%, where he used 25% in his calculation for this article.
(2) FPG variance due to weight change with ~77% contribution.
(3) Colder weather impact on FPG with a decrease of each Fahrenheit degree caused 0.3 mg/dL decrease of FPG.
(4) A1C variances contributed by PPG between 65% to 85%, where he used 75% in his calculation for this article.
(5) PPG variance due to carbs/sugar intake with ~39% weighted contribution on PPG.
(6) PPG variance due to post-meal walking with ~41% weighted contribution on PPG.
(7) Warm weather impact on PPG with an increase of each Fahrenheit degree caused 0.9 mg/dL increase of PPG [7].
It should be noted that his developed mathematical HbA1C prediction model is based on different weighted ratio for the previous 4-month glucose data, instead of the standard concept of the three-month average glucose for A1C with equal weighting factors. He chose 120 days for his HbA1C calculation which is based on the fact that the average human red blood cells (RBC), after differentiating from erythroblasts in the bone marrow, are released into the blood and survive in circulation for approximately 115 days.
In 2019, he developed the following simple linear equation for PPG prediction:
Predicted PPG = (measured FPG * 0.97) + (carbs/sugar intake amount * GH-modulus) - (post-meal walking K-steps * 5) Where 97% of FPG can be served as the baseline PPG. In 2010, after re-arranging the above equation into the following two new terms with a newly defined coefficient, the “GH-modulus”:
X = carbs/sugar amount
Y = measured PPG - (FPG * 0.97) + (post-meal walking k-steps * 5)
where X functions as the input, stress, or stimulator on the liver, and Y functions as the output, strain, or consequence from the liver. Both X input and Y output are related to each other through the coefficient of GH-modulus, as shown below:
GH-modulus = (Y output) / (X input) in endocrinology of biomedical science and
Young’s modulus (E) = stress / strain in linear elasticity of engineering strength of materials The author has applied this linear elastic glucose theory in his PPG calculation for estimating his HbA1C value in the ninth period. Please note that other than his acquired biomedical knowledge and his findings from previous research work, there are no other complicated or sophisticated mathematical tools being used in this analysis.
Result
Based on the author’s numerous publications of HbA1C contributions by FPG and PPG, along with the prediction models of these two glucoses and HbA1C, a summarized chart of these HbA1C values over nine periods from 4/1/2017 to 10/21/2020 are observed in Figure 1. This long period of ~3.5 years, ~43 months, 1,299 days are divided into nine periods of almost equal length of 4.6 months. Although his calculated daily A1C data and curves are fluctuating, the 10 lab-checkup dates with two sets of A1C values (predicted A1C and lab-tested A1C) are identical to each other.
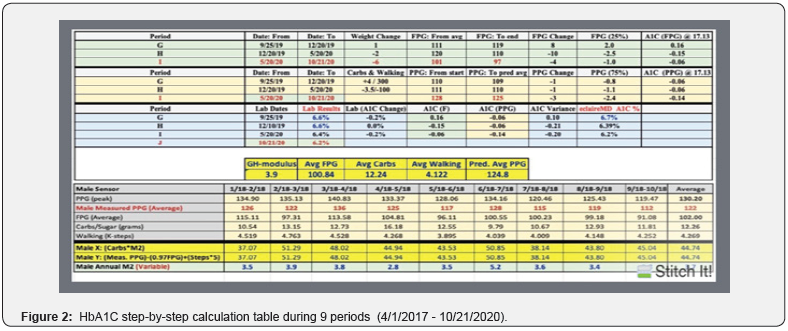
Figure 2 shows the step-by-step background data table of Period I. During this time, his primary input data for the “linear elastic glucose equation” are:
Average FPG = 100.84 mg/dL
Average carbs = 12.24 grams
GH-modulus = 3.9 [7]
Averaged walking = 4.122 k-steps
Predicted PPG = (measured FPG * 0.97) + (carbs/sugar intake amount * GH-modulus) - (post-meal walking K-steps * 5)
Therefore,
Predicted average PPG in Period I
= (100.84*0.97)+(12.24*3.9)-(4.122*5)
= 125mg/dL
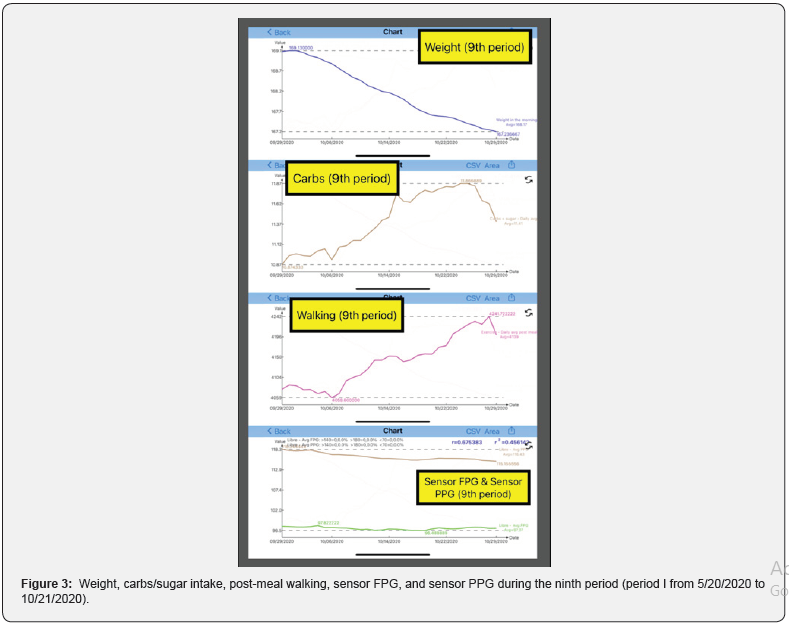
This value has been used in the calculation of obtaining the 6.2% HbA1C value in the ninth period. Figure 3 depicts his weight, carbs/sugar intake, post-meal walking, sensor FPG, and sensor PPG in Period I from 5/20/2020 to 10/21/2020.
f23
Conclusion
The author focused on nine periods over 1,299 days. It contains 3,897 meal data, including key contribution factors such as carbs/sugar intake, post-meal exercise, weather, and more. This study demonstrated a high degree of accuracy for the calculation and prediction of the patient’s forthcoming HbA1C value by using the GH-Method: math-physical medicine approach. In this article, the author also utilized CGM sensor glucose data with AI-tuned conversion factor between glucose and HbA1C. Furthermore, he also implemented his developed linear elastic glucose behavior theory [7] for his PPG calculation in order to obtain a better estimation for the final HbA1C value.


Once the healthcare professionals and T2D patients understand the HbA1C mathematical prediction method, then the overall diabetes condition for the patient can be easier to control. The purose for this research paper is to help people with T2D by preventing further damage to their internal organs caused by elevated A1C values, before taking the laboratory test. If healthcare professionals and diabetes patients have an interest to delve deeper regarding the formation of tested glucose and mathematical predicted A1C, they should focus on the influential factors and their respective weighted contribution percentages described in the author’s previous papers.
Here is the summary:
a) The most important month which contributes to the A1C is the month prior to the lab test.
b) PPG contribute > 2/3 of HbA1C.
c) Body weight controls ~77% or more of the fasting plasma glucose (FPG) which contributes <1/3 of HbA1C; therefore, it is important to keep BMI below 25.
d) Carbs/sugar amount contributes ~39% to PPG. For T2D patients, it is safe to keep carbs/sugar intake amount below 15 grams per meal.
e) Post-meal walking steps contributes ~41% to PPG. It is recommended to maintain post-meal walking exercise around 4,000 steps after each meal.
f) A combined effort of diet and exercise controls ~80% to PPG formation.
To Know more about Gynecology and Womens Health
Click here: https://juniperpublishers.com/index.php


No comments:
Post a Comment