Environmental Science Journal Juniper Publishers
Abstract
The City of Tshwane (CoT) Municipality is located between three declared air quality priority areas (i.e. Highveld, Vaal Triangle Air-Shed and Waterberg Bojanala priority areas). This city is growing rapidly, and its air quality is suspected to be declining. The main purpose of this study is to identify areas that have high PM10 (particulate matter of aerodynamic diameter < 10mm) concentration levels which serve as indicator of air pollution hotspots within the study area. The secondary PM10 data that was collected using the tapered element oscillating microbalance (TEOM) devices in the period from 2009 - 2014 at seven (7) ground based ambient air quality monitoring stations within the city was analysed. The spatial-temporal, wind fields / roses and the diurnal variation of PM10 concentrations were plotted to gain further insight on the factors affecting the measured ambient particulate levels at each monitoring station. The results show that poor air quality is not evenly distributed throughout the city but is localized in few areas with large numbers of low-cost residential areas, commercial and/or industrial areas. The data show that PM10 concentration levels has increased considerably in the past six (6) years since the commencement of the monitoring stations in 2009. Daily PM10 concentration levels are highest in the late hours, between 18:00 and 23:00, as well as during the winter. This study provides baseline information for a comprehensive understanding of the current PM10 pollution levels and possible sources within the City of Tshwane.
Keywords: PM10 variations; Spatial; Temporal; Wind fields; Hot spots; Daily average; Seasonal average; City of Tshwane
Introduction
City of Tshwane (CoT) is the capital city of South Africa. CoT is one of the three metropolitan municipalities (i.e. City of Johannesburg, Ekurhuleni and City of Tshwane) found in the province of Gauteng. Besides metros, Gauteng province also have two districts municipalities namely, Sedibeng and West Rand District Municipalities. Tshwane is a vibrant, modern capital city, which has developed tremendously since the establishment of diplomatic ties with the international community following the demise of apartheid. Significant economic sectors in Tshwane include financial and social services, manufacturing, trade, construction, electricity, transport and agriculture. The high altitude of Tshwane (Pretoria) and the highveld ensure a favorable climate throughout the year. Summer days (October to March) are pleasantly hot, though rarely to the point of discomfort, and evenings are comfortably cool. CoT has a significant winter air pollution problem that are dominated by smoke generated by domestic fire burning (coal and wood), traffic, and power stations on cold nights [1,2].
Materials and Methods
City of Tshwane established ambient air monitoring network currently consists of seven (7) permanent stations and one (1) mobile station. The stations are located at Rosslyn, Pretoria West, Mamelodi, Booysens, Olievenhoutbosch, Bodibeng, Tshwane mobile and Ekandustria (Figure 1). These monitoring stations are in strategic points to monitor the impacts of industrial, traffic and residential activities on the ambient air quality to assess compliance with the national ambient air quality standards and to determine if there are changes in the state of the air at those sites. Each of the stations is fully equipped to monitor all the criteria pollutants, but this paper focuses only on the particulate matter of aerodynamic diameter >10mm (PM10) and meteorological parameters (wind speed, wind direction, temperature, pressure, relative humidity, solar radiation and rainfall) at a temporal resolution of 1 minute.
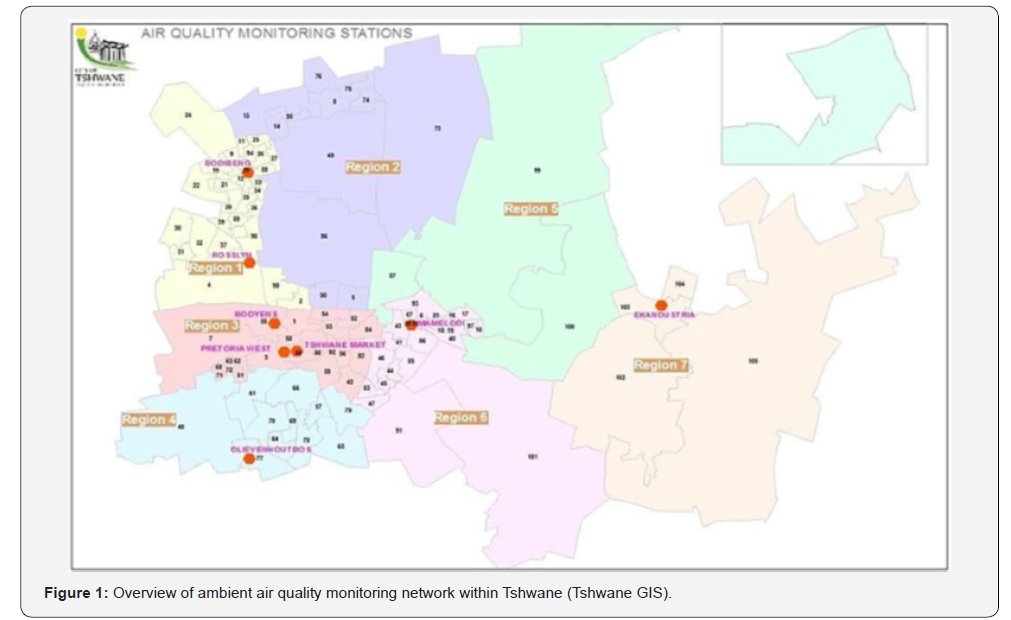
The chosen stations have sufficient data recovered (i.e. with more than 1-year data recovered) that provide hourly readings of PM10, wind speed and wind direction. Seven monitoring sites were chosen for the purpose of the study (i.e. Booysens, Bodibeng, Ekandustria, Mamelodi, Olievenhoutbosch, Rosslyn and Pretoria West stations). The date and duration for each monitoring campaign was dictated by the available data in the network and operational status of more than a year. It is also important to note that, for atmospheric modelling and trend analysis, a minimum of one year’s data is recommended.
Data quality control
For this study, the investigated hourly averaged data (for the period 2009 - 2014) for PM10, wind speed and wind direction were requested from the South African Air Quality Information System (SAAQIS) hosted at South African Weather services (SAWS) and revalidated to remove negative readings and data spikes that were not removed during the original validation. In order to assess the ambient air quality in the city, the particulate matter concentrations measured were compared against the South African National Ambient Air Quality Standards (NAAQS). The concentrations of the PM10 were averaged into either 24 hour (daily) or annual averages depending on the averaging period required for relevant air quality standard. Data used in this paper was validated and analysed using Microsoft Excel and R Programming software [3].
Statistical analysis
In order to investigate if there was a difference or comparison of the concentration of air pollutants between stations, several statistical analyses were conducted to determine the distribution of particulate matter concentrations. Time-series of PM10 concentration from each monitor station were tested for the presence of linear trend using non-parametric algorithms. In particular, the Mann-Kendall method was used to determine the significance of the trend and the Sen’s slope method (also known as Theil-Sen method) was used to obtain the magnitude (i.e., the slope) of the linear trend. These methods provide a much more robust analysis than the traditional parametric approaches and are less sensitive to outlier values. In general, a time-series was considered having a significant trend if the significance value was equal or less than 5% (i.e., the probability of erroneously assuming a significant trend under actual no-trend conditions is equal or less than 5%). It is important to recognize that results from statistical analyses were largely limited by the number of data points available and still, by outliers [3-6].
Results and Discussion
Meteorological variables and secondary PM10 data from selected ground-based monitoring sites were analysed and presented to demonstrate the spatio-temporal variations of PM10 pollution (i.e. hourly, daily and monthly concentration trends).
Time series
PM10 daily, monthly, seasonal and annual trends along with frequency distribution of air quality conditions over the city’s monitoring network (seven ambient air quality monitoring stations) has been rigorously examined over the period of 5 years (2009 to 2014) and monitoring stations shows similar patterns which could be associated with land uses activities and/or meteorological factors in the areas. The time variation of PM10 concentrations is presented in Figure 2 below. Based on the results, the observed hourly average PM10 concentration levels tends to be highest in the late hours of the afternoon than in the early hours of the morning. Highest average daily concentrations recorded were between 110μg/m³ (observed on the afternoon peak at Booysens monitoring station, around 18:00 on Monday and Saturday) and 250μg/m³ (observed in the afternoon peak on Monday and Friday at Olievenhoutbosch monitoring station, around 19:00).
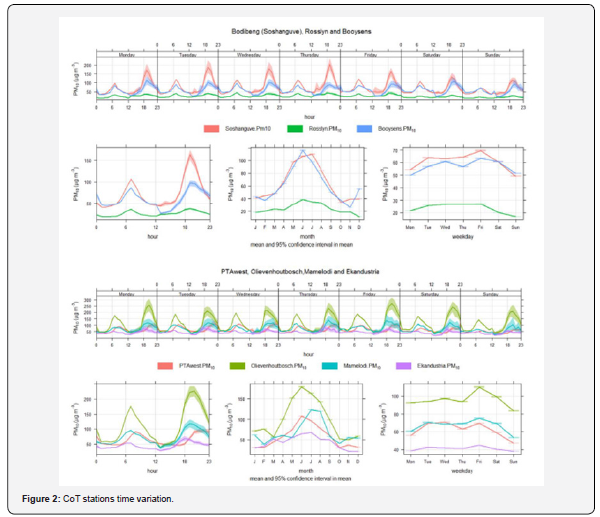
High particulate matter concentration indicates the increased risk due to high exposure of air pollution, which compromise health conditions particularly of the aging population, children and infants as well as the environment [7] sites that there is a close, quantitative relationship between exposure to high concentrations of small particulates (PM10 and PM2.5) and increased mortality or morbidity, both daily and over time [7,8]. Ekandastria, Pretoria West and Rosslyn stations are the only stations with particulate matter concentration mainly influenced by industrial sources and these stations recorded the lowest average hourly or diurnal PM10 concentration variations (with values ranging between 30μg/m³ and 100μg/m³ observed in the afternoon at Rosslyn and Pretoria West) probably due to lower density of traffics, low population density and lower residential fuel burning around the stations. Most of the peaks were observed in the early hours of the morning (5:00 - 8:00) and the evening phase (16:00 - 19:00) with increasing pollution levels. Daytime were observed with descending pollution trends from 9:00 - 16:00. A previous study undertaken in a heavily industrialized and polluted region in South Africa reported two main PM10 pollution load peaks [9].First, a large peak started in the morning, around 01:00 with a peak maximum at 07:00 and dropped at around 12:00. A second but smaller peak started in the afternoon around 15:00, with a peak maximum at 18:00 and dropped at 23:00.
Weekend average PM10 concentrations in the entire CoT network are very similar in the network with weekday maximum and weekend minimum. The highest concentrations were observed at Olievenhoutbosch on Friday with the concentration value above 110μg/m³, while the lowest concentration value below 18μg/m³ is observed at Rosslyn on Sundays from 2012-2014. This could be due to normal working days are Monday to Friday, therefore most of vehicle emissions and domestic fuel burning for preparations to work and schools will happen during the week than on weekend. The presence of commercial complexes closes to Mamelodi and Bodibeng stations also influence high levels of PM10 especially during the weekend (mostly Saturdays).
In terms of monthly and seasonal trends, all seven (7) stations in the city show a strong seasonal profile in the average PM10 concentrations. The highest annual average concentrations were observed at Mamelodi and Olievenhoutbosch which recorded values above 120μg/m³ and 180μg/m³ respectively during winter, while the lowest annual concentrations are observed at Rosslyn and Ekandustria with the recorded values below 15μg/m³ in summer. PM10 concentrations decrease from winter to summer by 36% at Bodibeng, 47% at Rosslyn, 8% at PTA West, 21% at Booysens, 14% at Ekandustria, 33% at Mamelodi and 28% at Olievenhoutbosch.
The high and low seasonal PM10 concentration variations can be explained by the difference in meteorological conditions experienced during winter and summer. Higher winter values can also be associated to atmospheric stability with frequent inversions. Stability is ability to resist vertical motion and important characteristic of atmosphere. The unstable warm atmosphere air rises to higher heights, on the other hand at the stable atmosphere air sinks, so air pollutants spread horizontally at stable conditions [10]. The lowest values during the summer (December, January and February) can be explained by dilution caused by intensive vertical exchange in the atmosphere as well as precipitation and high temperature that promote dispersion. September to December shower flowers also bring good air quality due to spring’s rain. Breezy weather helps disperse air pollutants experienced from winter month and this typically results in good air quality on most days of spring and summer months.
Annual mean
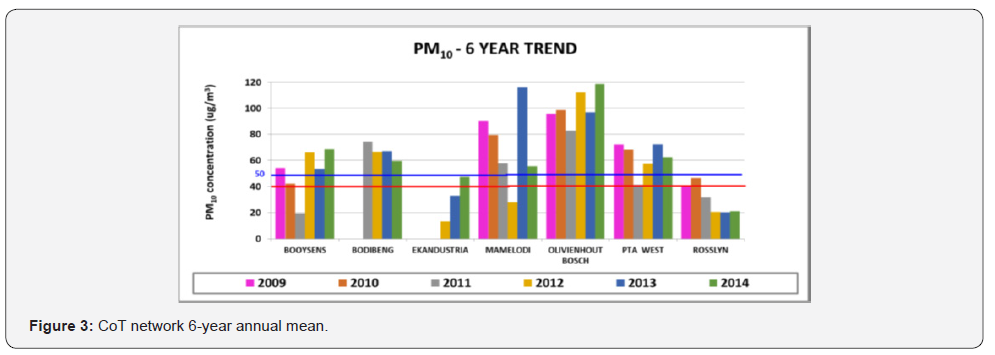
The spatial distribution of the annual average concentrations of PM10 on the seven stations of the city is shown in Figure 3 below. The observed annual mean of PM10 concentrations from the entire network ranged from 13.22μg/m³ in Ekandustria to the highest of 118.80μg/m³ observed in Olievenhoutbosch. The annual mean in the entire network exceeded the National Ambient Air Quality Standard (NAAQS) annual limit of 50μg/m³ (prior 2015) and 40μg/m³ (current) in all stations except at Rosslyn and Ekandustria stations which are found in the industrial area. The annual averaged mean concentration for six (6) year period was 55.11μg/ m³ in all seven stations also exceeded both the standards.
PM10 and meteorological factors (wind speed and wind direction)
Meteorological conditions are important in assessing the impacts of sources on surrounding areas, because they dictate the transport, dilution and dispersion of contaminants in ambient air. Wind patterns, clouds, rain, and temperature can affect how quickly pollutants move away from an area [11-14].
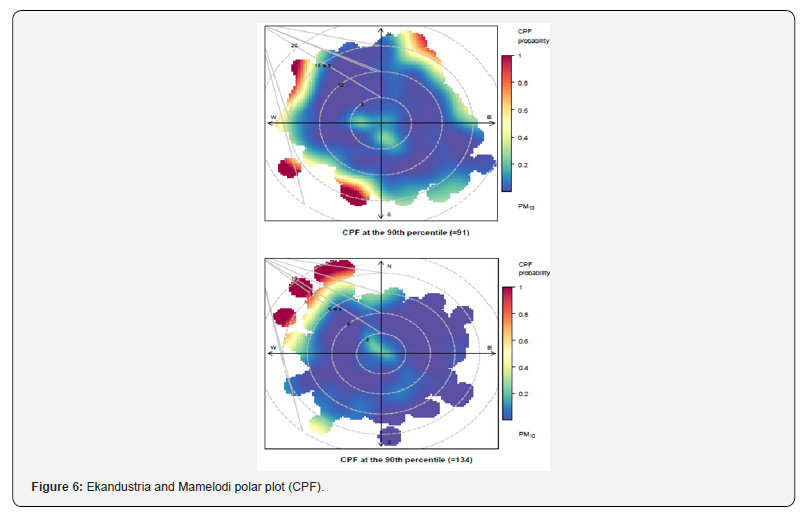
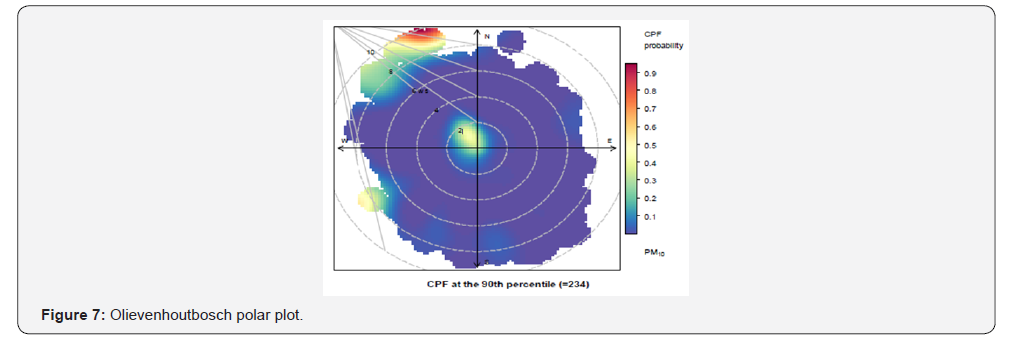
The relation between the concentration of PM10 and wind speed and direction are presented in Figure 4-7. These polar plot analyses are very useful for showing which wind directions are dominated by high concentrations and give the probability of doing so [3]. Bodibeng plot shows the highest PM10 concentrations related with occurrence of low to medium wind speed (2-4m/s) from western sector and south east dominated by occurrence of high occurrence of high winds with the range of 6-12m/s. This correspond well with the location or dominance source likely to be traffic source, commercial area, residential fuel burning around the station as well as long range pollution on the western sector, traffic sources and commercial area on the south east sector.
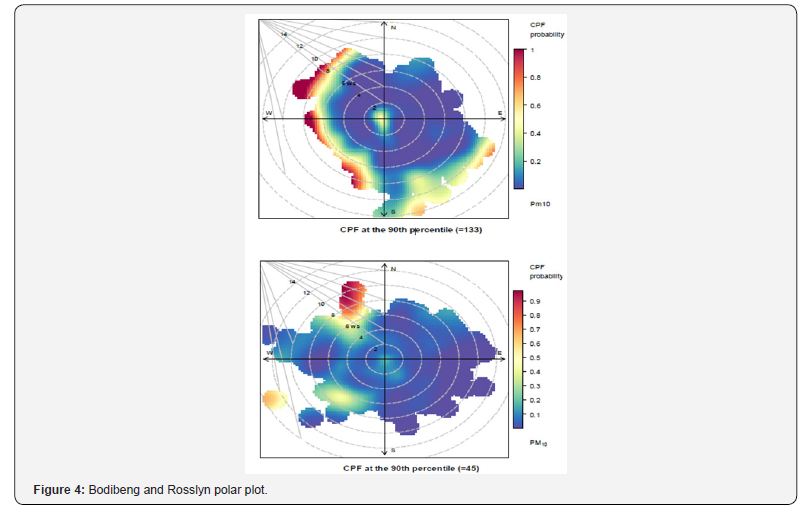
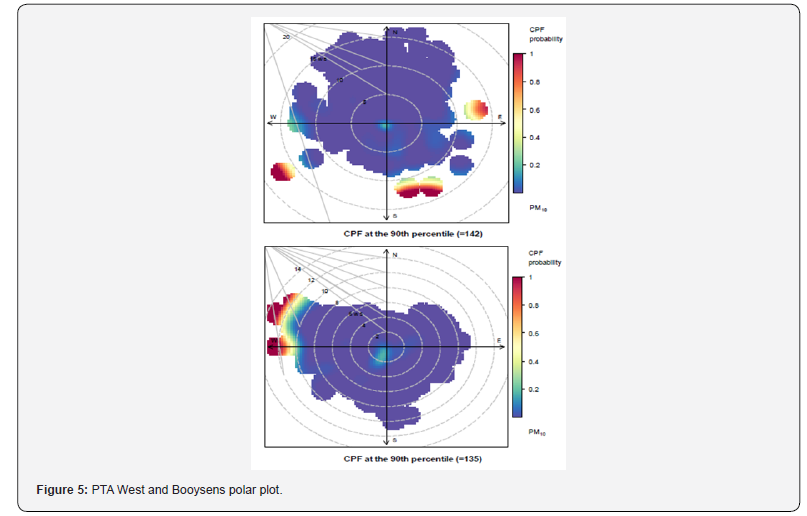
Rosslyn was characterized by low to moderate winds (frequently remained within the range of 2 – 4m/s) mainly in the westerly quadrant (i.e. north west and south west) bias with few occurrences of moderate to high winds from the south east with the rage of 6-13m/s). In Rosslyn, the polar plot shows the hot spot/potential sources of high concentration of PM10 in the area are to the north west and south west. This wind direction corresponds to the location of the low-income residential areas and industrial activities (tall and small stacks) in the south west, respectively.
In Pretoria West, the polar plot shows the hot spot of PM10 concentration associated with periods of high wind speed (> 6m/s) from the south west, south east and east while in Booysens station hot spot was identified from the western sector associated with low to moderate winds ranging from 0 - 4m/s. This wind direction corresponds to the location of the low income residential, traffic sources, tall stacks and industrial activities respectively.
In Mamelodi, the polar plot shows that concentrations of PM10 tend to be highest from the north west associated with low to moderate winds (ranging from 0 - 4m/s). High PM10 concentration in the western sector correspond well with the direction of main road, unpaved open space, commercial complex, low cost residential areas and the open mining in the far west. High probability of PM10 concentrations is to the north west, north east and south west at Ekandustria station and it is associated with high wind speeds within the range of 6 - 18m/s and this corresponds well with the direction of low cost residential area bordered by informal settlement (north west, north east and south west), industries and mining (north west, south of south west) as well as agricultural activities in western quadrant.
In the South of the city, Olievenhoutbosch polar plot shows concentration pattern with high probability concentrations is to the south west, northwest and around the monitoring station and the results correspond well with the direction of likely sources of the PM10 at the station (residential and traffic sources) around the station, while suspected source in the north west is an industrial complex. The high concentration levels in the north-west and south west can be linked with high winds with the range of 6- 9m/s.
High concentrations of particulate matter at Bodibeng, Booysens, Mamelodi and Olievenhoutbosch are believed to be due to a heavily trafficked main road near the stations, residential fuel burning, nearby taxi ranks and commercial complex. Therefore, vehicles and domestic fuel burning as well as the influence of wind fields were to be blamed for a large magnitude of PM10 concentration in the stations sited especially in areas with majority of low cost and informal residential areas as well as commercial complexes. Bodibeng, Mamelodi and Olievenhoutbosch were identified as the hot spot area in terms of the findings of this study. These stations were selected based on stations non-compliance / exceeded levels of the NAAQS on the daily basis sometimes with highest hourly average concentration levels being above 600μg/ m³.
Statistical analysis
A series of observations of a random PM10 concentration have been collected over some period of time in the City’s network and the trend results were obtained to determine if their values generally increase or decrease. In statistical terms this is a determination of the probability of distribution from which they arise has changed over time. Time-series of PM10 concentration from each monitoring station were tested for the presence of linear trend using the Mann-Kendall method and the Sen’s slope method (also known as Theil-Sen method) to obtain the magnitude (i.e., the slope) of the linear trend. On running the Mann-Kendall test on PM10 data, the results in table 1 were obtained.
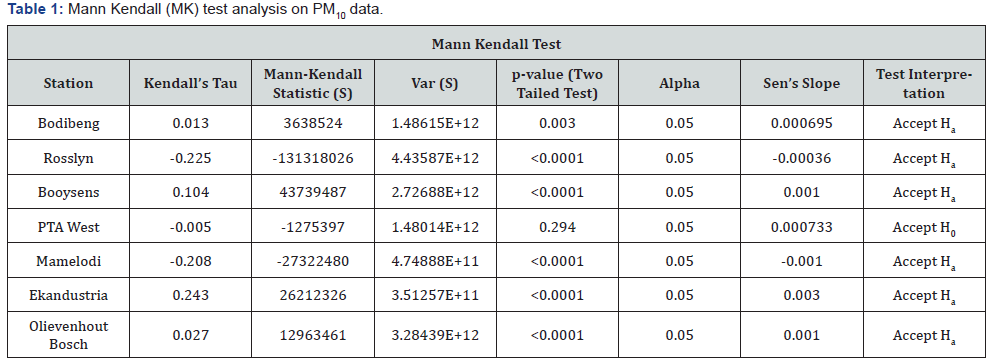
In terms of MK, if the p value is less than the significance level α (alpha) = 0.05, H0 is rejected and automatically accept the alternative hypothesis Ha, which indicates that there is a trend in the time series. Accepting H0 (null hypothesis) indicates no trend was detected. On rejecting the null hypothesis, the result is said to be statistically significant. For this test, the was rejected and the alternative hypothesis Ha was accepted for 6 stations (i.e. Bodibeng, Rosslyn, Booysens, Mamelodi, Ekandustria and Olievenhoutbosch) in the network and PTA West station accepted the H0, which indicates that no trend was detected [6].
The MK test statistic (S) indicates that there is an increasing PM10 trend at Bodibeng, Booysens, Ekandustria and Olievenhoutbosch. Booysens and Ekandustria show very positive and strong trend when compared to the other three stations in the network. However, the MK test result also indicates the low or decreasing PM10 trends at Rosslyn, PTA West and Mamelodi stations.
Conclusion
Based on the results of this study, there is strong evidence that majority of community in Tshwane are exposed to high levels of pollution during winter as well as on daily basis during rush hours, mostly in residential areas. It can be concluded that, anthropogenic activities in the city are key contributors of PM10 with high levels more enhanced by meteorological/weather conditions in residential areas. The results show that poor air quality is not evenly distributed throughout the city rather it is localized in few areas, especially in low cost residential areas, commercial and main roads. Based on the current spatial and temporal or trend results, PM10 concentration levels has increased considerably in the past six (6) years since the commencement of the monitoring stations in 2009. It can be concluded that the communities in the CoT are often exposed to moderate to high air quality conditions.
Acknowledgment
This research work was supported by the City of Tshwane and the Council for Geoscience.


No comments:
Post a Comment