PeerReviewed Chemistry Journals Juniper Publishers
Abstract
Quality by Design is the new-age path chosen towards achieving the demanding quality standards in pharmaceutical industry. The present paper aims to throw light on Pharmaceutical Quality byDesign (QbD) and how its implementation will help manufacture better quality of Pharmaceuticals. Quality by Design is introduced along with its key elements to help make the understanding process easier. To attain built-in quality is the primary objective of Quality by Design. Finally, it can be said that the quality that is achieved by end product testing is not something that can be guaranteed unlike the quality assurance that can be provided by Quality by Design.
Keywords: Quality by Design (QbD); Quality Target Product Profile; Design Space; Critical Quality Attributes
Introduction
“Quality Can Be Planned.”-Joseph Juran
The above quote is self-explanatory when it comes to product quality in the pharmaceutical manufacturing industry. Quality by design (QbD) is not very old but a recent inclusion in the pharmaceutical industry. It`s sole objective is to achieve better quality standards that is especially important in the pharmaceutical industry. The QbD approach consists of various components, important ones being risk assessment, assessment and management of the identified risks, design of experiments (DoE), quality target product profile (QTPP), and establishing a control strategy to keep the product within the design space that was created with the QbD study [1]. Out of all the components, a lot of pharmaceutical development studies have incorporated DoE for a more rational approach [2].
The target of analytical QbD approach is to establish a design space (DS) of critical process parameters (CPPs) where the critical quality attributes (CQAs) of the method have been assured to fulfil the desired requirements with a selected probability [3-4].
The principles that are involved in the pharmaceutical development and are relevant to QbD are all described in the ICH guidelines (ICHQ8-11) [5].
Any Pharmaceutical Development Process Typically Covers the Following Sections:
a) Complete portfolio including all the details as well as analysis of the Reference Listed Drug Product
b) Quality Target Product Profile (QTTP) compilation.
c) Figuring out the Critical Quality Attributes (CQA)
d) Complete characterization of API &CMA (Components of Drug product) identification of the API
e) Excipient selection& excipients CMA identification
f) Formulation Development
g) Manufacturing Process Development [6]
Quality Target Product Profile (QTPP) describes the design criteria for the product, and should therefore form the basis for development of the CQAs, CPPs, and control strategy.
Critical Quality Attributes (CQA) – A physical, chemical, biological, or microbiological property or characteristic that should be within an appropriate limit, range, or distribution to ensure the desired product quality (ICH Q8) Critical Process Parameter (CPP) – A process parameter whose variability has an impact on a CQA and therefore should be monitored or controlled to ensure the process produces the desired quality. (ICH Q8) Critical Process Parameters (CPP) identification and their impact analysis is done by conducting a preliminary risk analysis for every process parameter (PP) that is involved in the individual unit operations.
Need for QbD in Pharmaceutical Industry [7,8]:
a) To integratepatient needs, quality requirements and scientific knowledge all in one design while the pharmaceutical product is still under developmentand further extending to the manufacturing process.
b) To have a better understanding about the impact of raw materials and process parameters on the quality of the final product. This is especially important for biopharmaceutical products since raw materials like cell culture media can be the risk for variability, effecting important factors likecellular viability, cell growth and specific productivity.
c) To collaborate closely with rest of the industries and the regulators and successfully keep up with the regulatory reviews
d) To maintain harmonization in all the regions so that a single CMC submission worldwide is all that is needed.
e) To encourage continuous quality improvement for the benefit of patients.
f) To enable better product design that will have less problems while manufacturing, thus facilitating more efficiency in the manufacturing process.
g) To make post-approval changes easier since it will be contained within a pre-defined design space, thus resulting in regulatory flexibility.
Every production process in a pharmaceutical industry to implement certain control strategies with the ultimate goal of a robust process. A robust process is the gateway to high product quality at the end of the day [9]. Process variability stands as a hurdle to process robustness, and this originates from lack of control on the process parameters. Thus, QbD steps-in to avoidbatch to batch variability in pharmaceutical products [10].
The net outcome of the detailed QbD study (applied in any product) is the segregation of process parameters with respect to their criticality and the finalization of a proven acceptable range (PAR) for every operation. The knowledge that is gained post the QbD evaluation encompasses every minute detail of the operational process as well as the product in general, and lead to the defining of a Design Space. This way, the impact that the manufacturing process might have with regard to the variability of the CQAs becomes apparent, which helps in strategizing testing, quality and monitoring of batches [11].
Process Evaluation: Linking Process Parameters to Quality Attributes
It is important to carefully evaluate the process completely before applying QbD to it. The better knowledge you have of the process, the more effective your QbD will be. Moreover, process characterization is required to specify the proven acceptable ranges (PAR) for critical process parameters (CPPs). In the traditional approach that is implemented in biopharmaceutical production, existing empirical process knowledge is used on a daily basis. However, this approach leads tolaborious and time consuming post approval changes during process adaptation and any new technology implementation that may have become necessary for raising the efficiency of the process. Also, the effects aprocess scale-up can have on the quality of the final product cannot be predicted when using the empirical process development.
This can increase costs and also can cause difficulty in implementing any changes in the set manufacturing process. Thus was born a way to achieve deeper understanding of processes which would lead to greater flexibility and freedom to effect changes. The concept of operation under a pre-defined design space gave this flexibility. Design space is nothing but a concept that is a part of the “Quality by Design” (QbD) paradigm. Now, manufacturers are to follow a science-based process development than their empirical counterpart.
The QbD Concept is Best Explained in this Flowchart Below
Define a Quality Target Product Profile (QTPP) for product performance
⇩
Identify its Critical Quality Attributes (CQAs)
⇩
Create experimental design (DoE)
⇩
Analysis done to understand the impact of Critical Process Parameters (CPP) on CQAs
⇩
Identify and control the sources of variability.
Process characterization sets the ball rolling in any process development, which employs a sound risk assessment rating the various critical process parameters according to their importance [12-14].
Downstream Processing in Biotransformation
Downstream processes of biopharmaceutical industry essentially include the following steps:
a) Harvesting
b) Isolation
c) Purification
Various unit operations that constitute any biopharmaceutical process follow a designed sequence to form an integrated process [15]. Thus, any change in any one of the one-unit operation can affect the functioning of the subsequent unit operations. This is the reason why interaction effects between participating parameters across unit operations should also be taken into account during the process development. Interactions are said to happen when setting of a parameter will show effect on the response of another parameter. Due to this dependence between the parameters, the combined effects of any two parameters hailing from different unit operations cannot be predicted from their individual effects. Regulatory authorities demand inclusion of interactions of parameters within the QbD approach during any process optimization [16]
Example: Downstream processing of 1, 3-propanediol
Process: Fermentation
Fermentation broth that uses flocculation, reactive extraction, and distillation was studied. Flocculation of soluble protein as well as cellular debris that were present in the broth was carried out by using optimal concentrations of chitosan (150 ppm) and polyacrylamide (70 ppm). It was seen that the soluble protein that was present in the broth decreased to 0.06 g L-1. Recovery ratio (supernatant liquor: broth was found to be greater than 99% (Figure 1) [17,18].
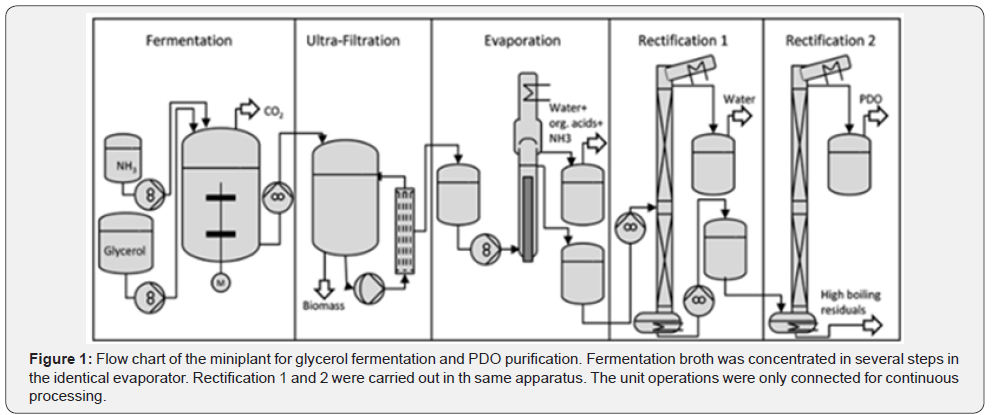
The above flowchart shows a typical fermentation process broken down in steps. Glycerol fermentation process is taken as example for the illustration [19].
Case Study for API
API product development from the very nascent stages require a lot of planning when implementing QbD at every stage. Whether it is two-step process or a multi-step process, each and every operation and parameter needs to be scrutinized before creating a relevant design space. Brainstorming every possible roadblock that might threaten the quality of the final pharma product is what will help design a top-quality process. A futuristic vision is important in the initial steps of QbD planning. The most important part is to pay sufficient attention to detail lest critical aspects might be missed. This is best done by sitting with the entire development team and taking every minor detail into account. Given below is a case study for a API intermediate development process with the help of QbD that highlights the important steps as to how to go about implementing it from the very beginning of your research. QbD is done best, when it is implemented from the very nascent stage of product development.
Quality Target Product Profile
When making your QTPP, make sure you list down everything from your vendor details to target costing. This step basically asks you to think of every aspect of your product and make a comprehensive profile of it. The specification of quality must be highlighted here with all the challenging impurities that might threaten your quality. Everything from stability testing requirements to raw material quality [20] is encompassed in this stage of QbD.
CQA Determination
Given below are some typical CQA parameters that are considered in most of the enzymatic methods of API intermediate preparations.
a) Purity
b) Chiral purity
c) Enzyme residue
d) Assay
e) Appearance
f) Residual Solvent
g) Yield
h) Polymorphic forms
i) Moisture content
j) Melting point (Table 1)

Initial Risk Assessment
The risk assessment can be done in various ways and is the customizable step in QbD. This part calls for a group-discussion or a team meeting where everyone can list down all possible risks related to the project in discussion and grade each one in the list with the amount of risk that it poses. The simplest module suggests you number them 1, 2, 3 with the increasing or decreasing order of the risk threat. A more complicated and detailed risk assessment requires linking of CQAs and CPAs to highlight the risk of their interdependence (Figure 2) [21].
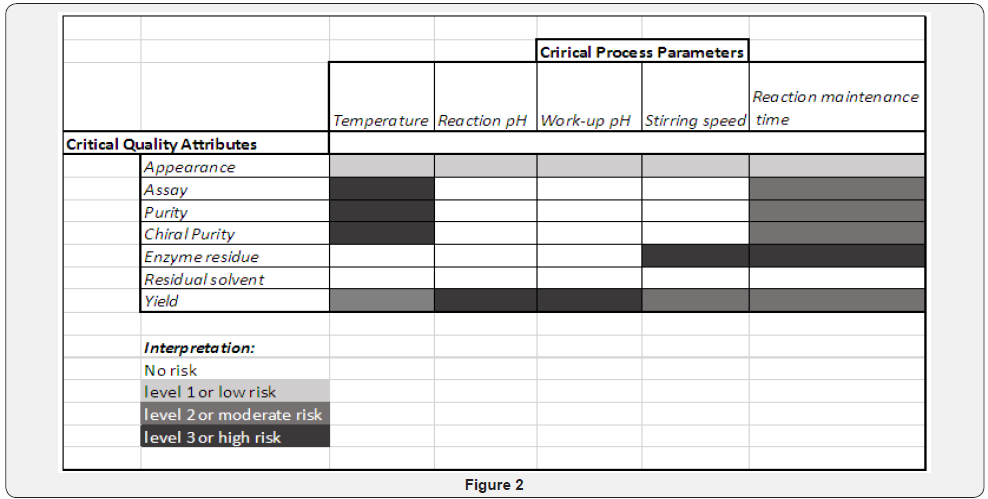
Post risk assessment, comes the control strategies to be followed to tackle the possible risks that are probable. The control strategies are for you to think and execute to achieve your target quality specifications.
Design of Experiment
This is a valuable tool for channelizing your experimental work, to move ahead in a systematic manner. Design of experiments can be of several types: comparative, screening, response surface modeling, and regression modeling [1].
Comparative Experiments: The aim of this study is simple, i.e., picking best out of two options. The selection can be done by the comparison data generated, which is the average of the sample of data.
Screening Experiments: If you want to zero-in on key factors affecting a response, screening experiments would be the best bet. For this, list down concise list of factors that might have critical effects on response that you desire. This model serves as preliminary analysis during development studies.
Response Surface Modeling: Once you have identified the critical factors that affect your desired response, response surface modeling comes handy to identify a target and/or minimize or maximize a response.
Regression Modeling: This is used to estimate the dependence of a response variable on the process inputs.
A step by step guide is given for the DoE step of the QbD process (Figure 3).
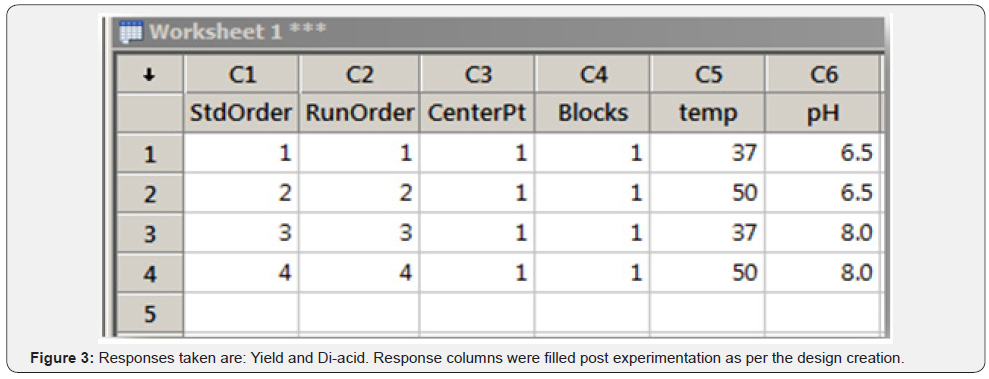
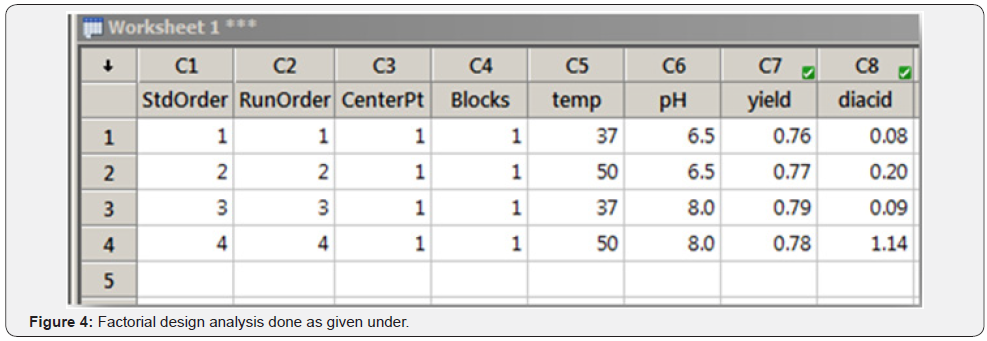
Response columns were filled post experimentation as per the design creation (Figure 4).
Factorial Design Analysis Done as Given Under
Analysis Done First for One of the Responses, “Yield”: (Table 2)
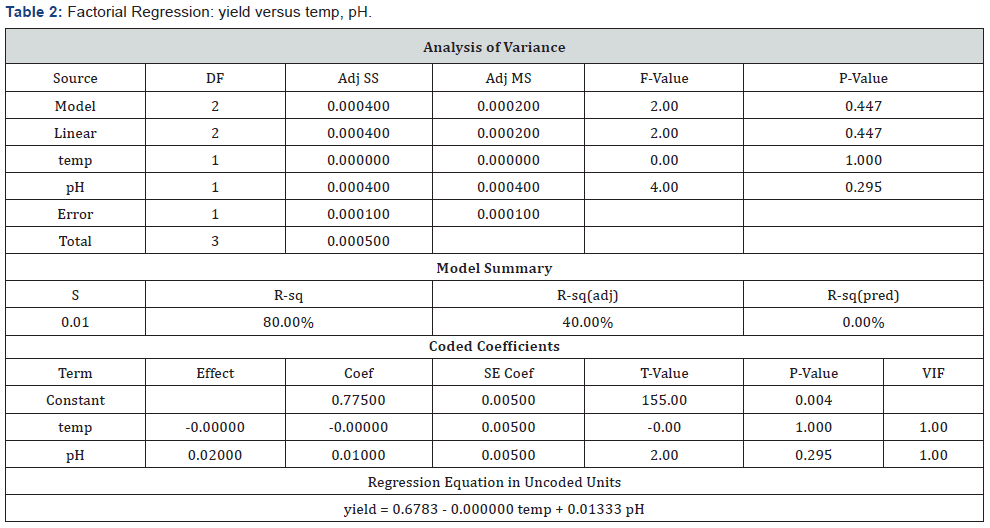
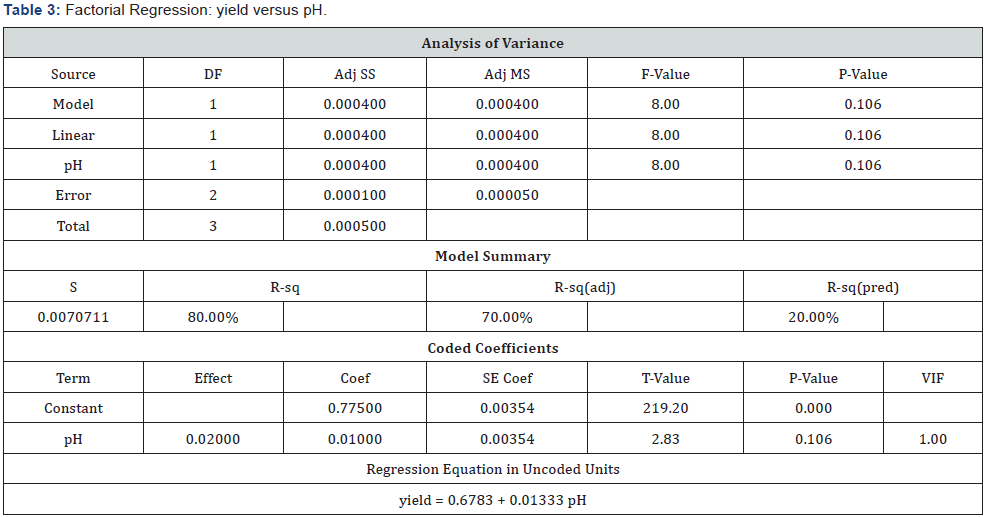
P-Values Were Checked for Significance and Higher P-Value Term Eliminated First to Create a Reduced Model:
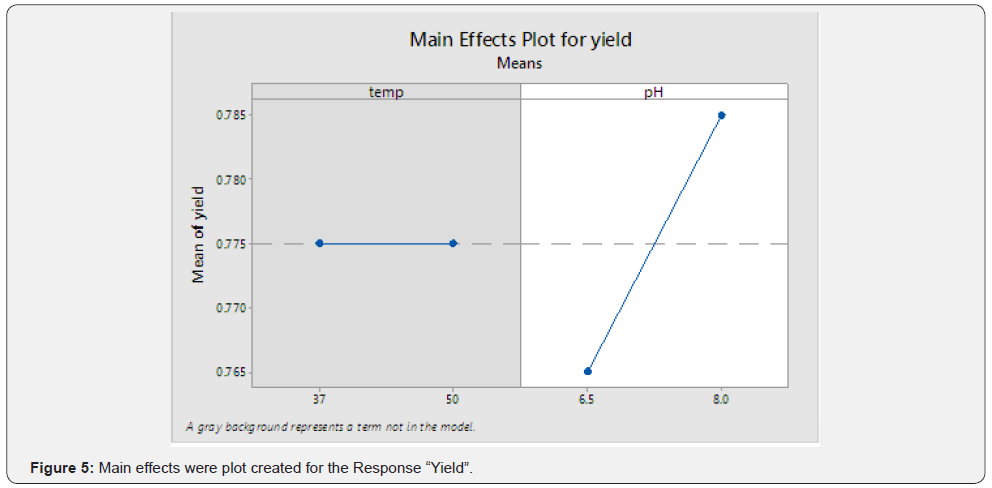
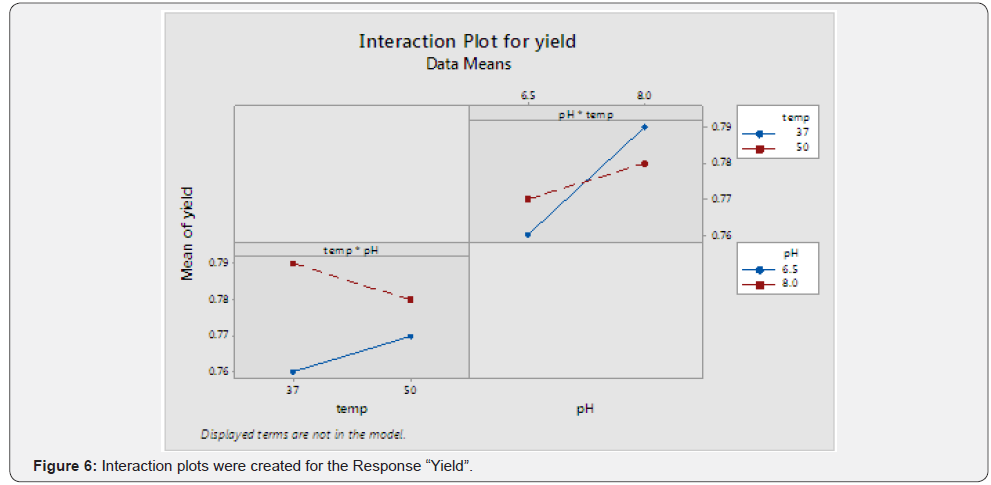
(Table 3) (Figures 5 & 6)
Observation
From the above graph, significant interaction between the two terms can be inferred.
Analysis Done for the Response “Diacid”: (Table 4)

P-values Checked for Significance and Higher P-Value Term Eliminated First to Create a Reduced Model: (Table 5) (Figure 7)
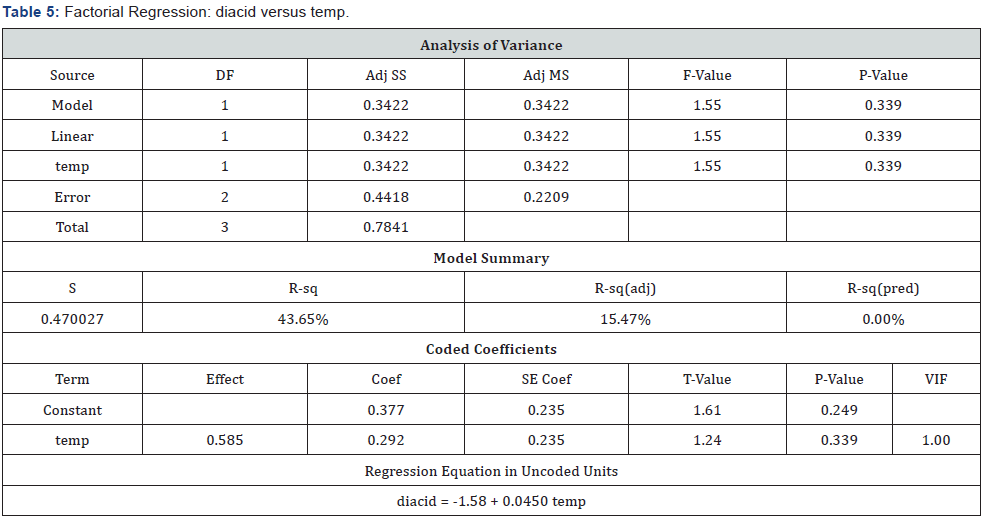
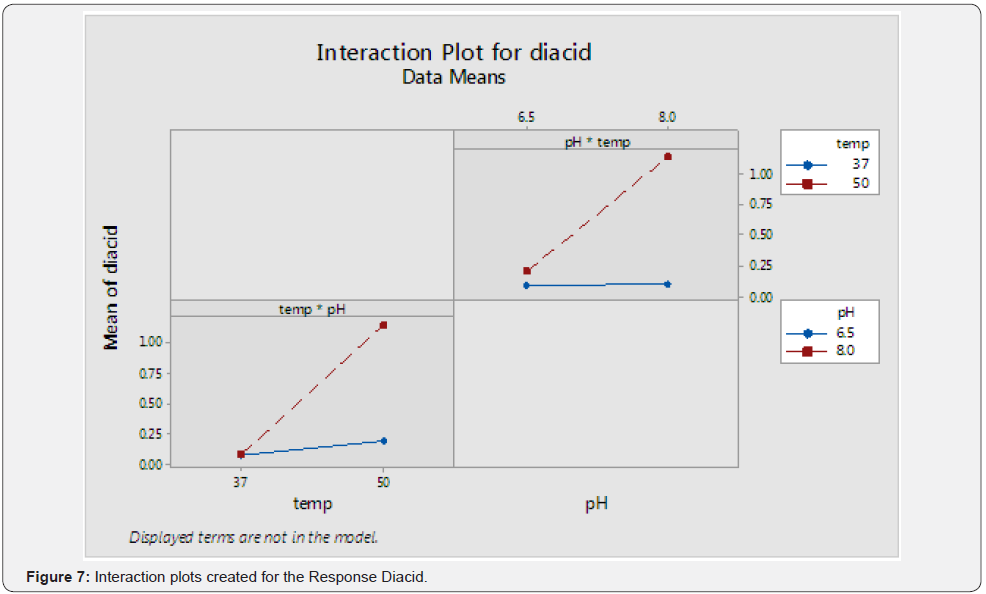
Observation
From the above graph, significant interaction between the two terms can be inferred.
Response Optimizer Was Used to Optimize Both The Terms With Respective to The Given Responses- Yield and Diacid: (Table 6) (Figure 8)
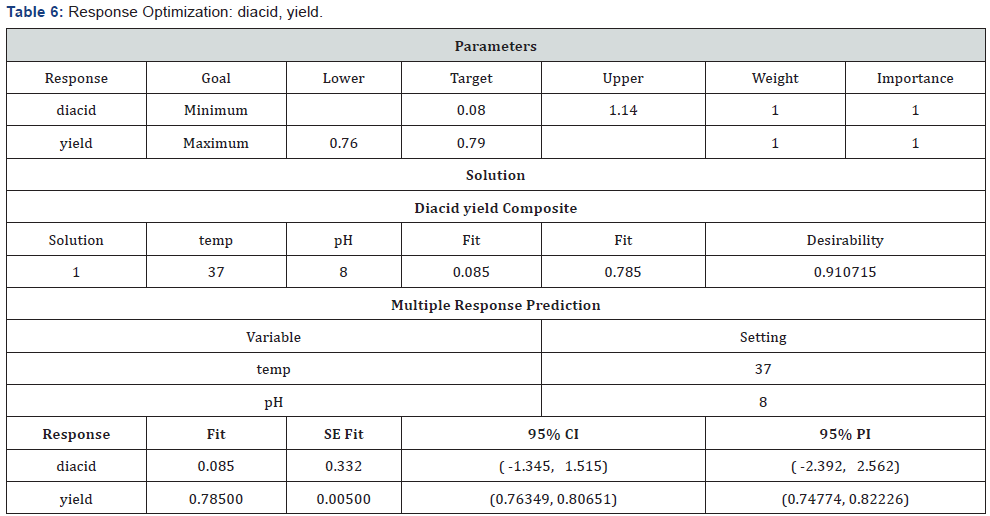
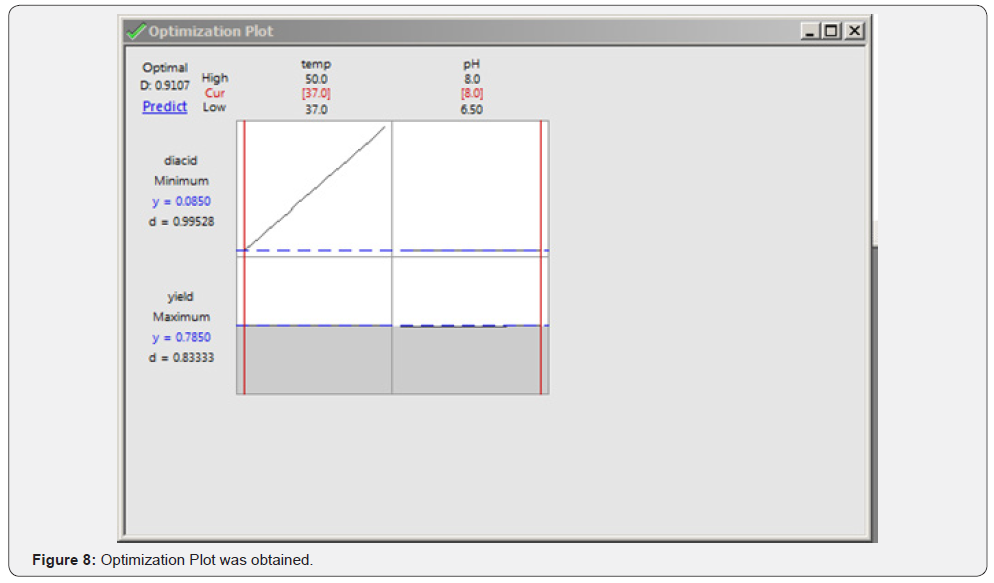
The optimized parameters predicted for maximum yield and minimum impurity (of di-acid) was found to be 8pH and 37C.
Case Study 2
As mentioned before, regression analysis is another important tool that can be used to study existing data. This means that if you have done some experiments (without designing them beforehand), you can quickly run a regression analysis of the collected data to derive a relationship between CPPs and the reaction results.
A lot of times, when one follows the one-factor-at-a-time optimization process, by the time any CPP is optimized, a lot of data stands generated. Instead of just tabulating the data and wasting time manually making sense out of them, regression analysis can come to your rescue. As always, graphical data representation seems much easier to understand and also saves your valuable time.
The effect of pH was studied [22] separately in the preparation of deoxynojirimycin base (stage III). The reaction involved N-formyl amino sorbitol, water, oxygen and whole cells of Gluconobacter oxydans DSM2003. Later involvement of sodium hydroxide and sodium borohydride gave rise to deoxynojirimycin. Further work-up and 2-methoxy ethanol facilitated crystallization yielded Deoxynojirimycin base. In this experiment, pH of the reaction was changed to find out its role during the reaction and a regression analysis was run using Minitab to study this affect.
Observations recorded showed that reaction did not occur at pH2 and at pH8, the reaction did not reach completion. The optimum pH range between 4 to 6 showed certain effect on yield and purity. The significance of pH variation during the reaction was thus established as described below (Graphs 1-3):


When null hypothesis p-test was carried out, no significant effect of pH was to be found on product purity, impurity1 and impurity2, but its significant influence was seen in minimizing impurity3.
Furthermore, large-scale batches conducted were statistically analyzed as well to achieve better understanding of the influence of list of parameters on the output obtained. The following parameters were studied during the stage III reaction described above:
a) pH, RPM and Oxygen cylinders consumed during the course of the reaction.
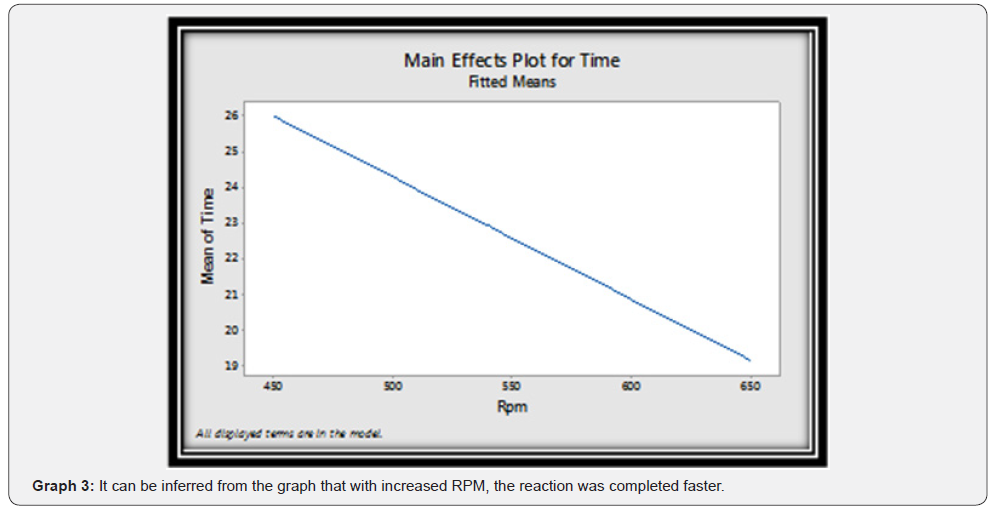
Their effect on the output and reaction completion time was studied. It was seen that only RPM showed statistically significant effect on the reaction completion time and rest of the factors did not contribute to any significant effect on the output or reaction completion time.
During biotransformation process, i.e. during oxidation of N-formyl using Gluconobacter oxydans DSM2003 whole cell, three main unknown impurities peaks were observed in HPLC chromatogram while reaction monitoring. This process is capable of removing these three impurities during down streaming, work up & isolation to the levels mentioned below:
a) Impurity 1 (has defined RRT on HPLC chromatogram) not more than 3%
b) Impurity 2 (any other unknown impurity) not more than 1%
c) Impurity 3 (has defined RRT on HPLC chromatogram) not more than 10 %
Since higher level of impurities affect the yield of the process, efforts were carried out to study the factors which can reduce the formation of process impurities.
Conclusion
The concept of Quality by Design (QbD) is highly reliable when it comes to achieving foolproof quality of your product. This is a modern tool that is going viral in Pharmaceutical industry especially because this industry demands high quality standards and tolerates no compromise when it comes to the quality. Breaking down QbD, it essentially comes down to identifying the critical parameters of the process and assigning a particular design space for every single critical attribute. Thus, QbD can be considered as an intelligent approach to quality that yields robust processes. QbD also ensures that there is continuous improvement in the process during the entire lifecycle of a Pharmaceutical product [23].
Acknowledgement
Our group would like to thank the Department of Scientific and Industrial Research India, Dr. Hari Babu (COO Mylan), Sanjeev Sethi (Chief Scientific Office Mylan Inc); Dr. Abhijit Deshmukh (Head of Global OSD Scientific Affairs); Dr. Yasir Rawjee {Head - Global API}, Dr. Sureshbabu Jayachandra (Head of Chemical Research); Dr. Suryanarayana Mulukutla (Head Analytical Dept MLL API R & D) as well as analytical development team of Mylan Laboratories Limited for their encouragement and support. We would also like to thank Dr. Narahari Ambati (AGC- India IP) & his Intellectual property team for their support.


No comments:
Post a Comment