JOJ Urology & Nephrology Juniper Publishers
Abstract
Background: Analysis of prostatic growth has focused on the whole gland volume. However there are distinct zones which grow at different rates which can be further divided into acini and stroma.
Objective: Measuring the principal sub-zones of the gland and taking into account their intrinsic asymmetry of glandular acina density, one can develop the prostatocrit model, similar to the haematocrit. This generates four new zones which better define the differential growth of the gland. This has implications for benign and malignant glands, response to drugs and need for surgery.
Design, setting, participants: Retrospective data was collected from 409 men undergoing TRUS and biopsy in a district general hospital. Whole gland and zonal volumes were recorded along with IPSS scores. Rates of growth for conventional and prostatocrit volumes were compared using univariate analysis. The relative amount of PSA secretion per zone was estimated using the model. The PSA densities and ratio of zone to whole gland were plotted.
Outcome measurements and statistical analysis: Univariate analysis to measure slopes of rate of growths of zones and relation to PSA. Multivariate analysis was used to find significant predictors of PSA secretion. IPSS scores of whole gland and zones.
Results and limitations: Age (P<0.0001) and the transition zone stromal volume (P=0.0001) were the only significant factors for PSA secretion. None of the conventional volumes were included in the model. Limitations include 1. TRUS estimations are probably inferior to MRI.2. Some negative biopsies will prove to have missed cancer.
Patient summary: This new prostatocrit model is consistent with known gross and microscopic anatomical differences in the gland. It potentially reveals a more logical, intuitive and easily measured account of the zonal and sub-zonal growth patterns.
Keywords: Benign prostatic hyperplasia; PSA; Acini; Stroma
Introduction
The role of prostate volume in diagnosis and aetiology of benign hyperplasia and need for treatment has been fraught with uncertainty and conflicting information. The view that has prevailed was that size was completely unimportant [1]. We propose the converse, that size or volume of the gland and its subdivisions do matter. By noting the asymmetry of acini within the principal zones, peripheral and transitional, we generate four new zones and reveal their differential growth and influence on PSA. We plot the growth of each zone and their relation to PSA. We also document the change in IPSS with whole gland and principal zones.
Size measurement of zones
Previous methods to determine size have used the DRE, transabdominal US, TRUS and MRI. We discuss what we mean by size. There has been an almost universal use to refer to the whole gland volume. The gland is quite complex and composed of several divisions each with varying amounts of secretory acinal cells and fibromuscular non-secretory elements [2]. The peripheral zone stays relatively constant in structure whereas the transition zone varies dramatically with ageing [3].
We can measure the contribution of each element due to the fact that the epithelial components have a secretory product, the PSA. This yields an "acinar density" which we can use to model growth [4]. Conversely we highlight the importance of the transition zone stromal volume which does not secrete PSA.
Zone measurement and acinar asymmetry
The gland can be divided into two distinct zones, the peripheral zone which is composed principally of epithelium and the inner gland which is mainly stroma [2,3]. Using this asymmetry of macroscopic and microscopic differences one can develop a new concept, the "prostatocrit" [4] to model the relative growths of epithelial and stromal components. The peripheral zone will have a higher prostatocrit than the transition zone and this ratio is key to the model. This has proven to be more accurate in prostate cancer diagnosis than traditional methods of PSA densities [4].
Previous studies refer to the entire gland
The growth, proliferation rate of the gland is under the influence of both hormones and ageing. The evidence is conflicting. Regarding Ki67, there was no significant correlation between ageing and proliferation rates in stroma and epithelium. They concluded that a large whole gland volume is not always associated with a high proliferation rate [5]. However, most studies all refer to the global volume of the gland with no discrimination between the subzones. Longitudinal growth rates of the whole gland, not zones, have been assessed [6] using ultrasound. They found an average increase of 1.6%/year. A baseline volume of 29cc showed a general trend to increase with time from 0.3cc/year for younger men and 0.6cc/year for older men. The bigger the baseline volume, the bigger the yearly increase.
Regarding size and symptoms, the Olmsted study [7] described treatment and relation to an enlarged whole gland volume of 30cc. Others have classified BPH as an overall volume of 20g [8]. They did not find a strong correlation (0.22) between volume and symptoms. A weak relation (correlation coefficient 0.185) was found when using a cut-off of 50mls for symptoms and flow rate [9]. Regarding obstruction, it is dependent on three parameters, whole gland volume, maximal flow rate and mean voided volume [10] and this is used to generate a bladder outflow obstruction number.
PSA as a proxy for whole gland volume
The Krimpen study [11] used a similar population of biopsy negative men and found increasing accuracy of PSA for increasing size of gland. They used 30cc as a cut-off for dichotomisation of whole gland volume. This gave as good area under the curve as higher volumes.
Whole gland volume and PSA are significantly correlated (0.54) and increase with age [12]. They found no influence of volume on symptoms. Whole gland volume on its own is not useful to estimate disease severity. Whole gland volume and serum PSA have an age dependent log-linear relation in those without cancer. The relation is stronger with increasing age and there is a greater increase in overall volume per unit of PSA leading to a "dilution" effect in context of the whole gland volume [13].
Nevertheless, 42% of the variance of whole gland volume can be explained by PSA and age [14]. This has implications for pharmacological outcomes when the whole gland volume is a prognostic factor of treatment.
Pharmacological outcomes
Trials such as CombAT [15] have classified glands as being enlarged if over 30cc and concluded that a combination of drugs, Tamsulosin and Dutasteride, are efficacious in treating symptoms. MTOPS [16] examined the effects of Doxazosin to relieve tone and Finasteride to induce epithelial atrophy. The risk of progression increased with increasing baseline PSA and whole gland volume of 40mls. The decrease in volume of 19% in those receiving Finasteride refers to whole gland volume only. The reduction in acute retention and need for surgery was attributed to reduction in overall gland volume. Using the PLESS data it was shown that, by dividing men into differing overall gland volumes, that volume and PSA were predictive of the natural history of symptoms and flow rates [17]. In addition, Finasteride gave a better improvement in bother score than placebo [18] after PSA stratification. PLESS was also used to analyse, by volume and PSA, the risk of acute urinary retention and the need for surgery. The risk was higher in those with high baseline PSA and/or whole gland volume.
MRI measurement
More recently focus has been on zonal volumes using MRI [19]. They used zonal contouring to measure the whole gland and the central and peripheral zones. They found a positive correlation between whole gland and central gland volumes and patient age. No correlation with the peripheral zone. Similarly there was a positive correlation of whole gland and the central gland with PSA and with IPSS. They point out that ellipsoid assumptions in calculating the prostate volume are inaccurate. T2 weighted MRI readily distinguishes between peripheral and central zones. They also document how the peripheral zone is relatively static with ageing. They state that the central gland is the major determinant on BPH and elevation of PSA.
Similar techniques using zonal volumes and adjustment of PSA for whole gland and central gland have improved the diagnostic accuracy and personalised risk of cancer [20]. The level of abnormal PSA is a longstanding problematic issue and leads to over-diagnosis and overtreatment of cancer [21]. The accuracy of early changes in PSA as a predictor of lethal cancer is poor [22].
There is a need to better relate the PSA production to the growth dynamics of the normal and the abnormal gland. We propose that all gland volumes and PSA related phenomena can be better characterised, with better risk stratification, with this new more detailed and intuitive model of the gland.
TRUS measurement
TRUS is quick, simple and safe and not only is useful for volume measurement but also for cancer diagnosis [23]. On the other hand, TRUS has been criticised for being inaccurate [24].
Previous studies all have used the whole gland volume as the entity in question. We propose using the easily measured peripheral zone and the asymmetry in epithelial, acinar, content to generate a prostatocrit (similar to a haematocrit) to better describe prostatic growth.
Methods
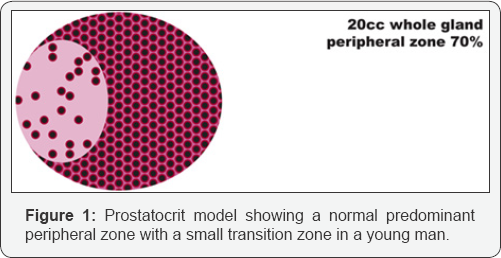
This is a retrospective cross-sectional study. We analysed 409 patients who had negative prostate biopsies who were referred for elevated PSA, abnormal DRE or anxiety of cancer 2006-2013. The patient filled out an IPSS questionnaire. One surgeon performed the biopsies using a BK medical Hawk 2102XD1 machine. The whole gland and the zonal volumes were documented. We ascribed the peripheral zone a density of 80% acini (as it has to be richer in glands than the overall prostate). We then subtracted this from the overall gland density to generate the transition zone density which is much more variable due to nodular hyperplasia. See Figure 1, see formula (4), see Table 1 of densities. To ascertain accuracy of imaging, 547 radical prostatectomy specimens with documented gland volumes from histology were documented. We compared the whole gland volume with MRI measurements to estimate if there were any significant difference.

Statistics were performed using medcalc. We used univariate analysis to monitor trends of each zone and subcomponent and related them to IPSS, PSA, growth, densities and ratio with ageing. We then performed multivariate analysis for prediction of PSA.
Bland-Altman plot of MRI v TRUS in estimating volume (Figure 2). There were 319 TRUS volumes documented pre operatively with 34 MRI volumes documented pre operatively. There was no significant difference in accuracy between the two imaging modalities.

Results (Table 2-9, Figure 3-8)


Discussion
Previous studies all reference the whole gland volume as the important entity. We use a "prostatocrit model (Figure 1) which generates four new zonal entities. The acinal (epithelial) volume of the peripheral zone, the acinal volume of the transition zone, the stromal volume of the peripheral zone and the stromal volume of the transition zone. In our previous study it was shown that none of the traditional zonal densities (whole gland, transitional or peripheral zone) were included in a model to predict high grade cancer or all grades of cancer [4]. However, the prostatocrit peripheral zone acinal volumes were included and so we extend this concept to benign growth of the gland predicting that the transition zone stromal volume will be the most significant element in PSA secretion. We made the growth measurements using TRUS with no significant difference found when comparing MRI measurements for whole gland volumes (Table 1, Figure 2).
Cohort characteristics (Table 2)
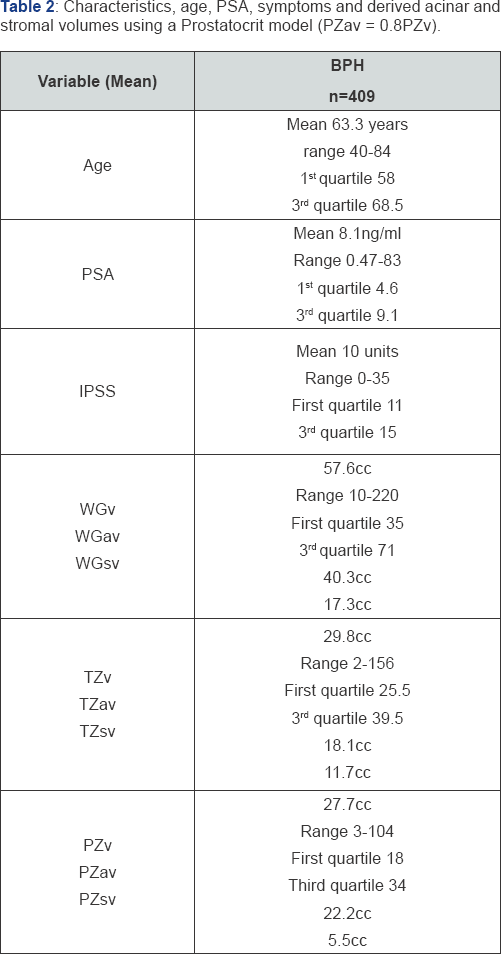
The age range is from 40 to 84 years with the first quartile at 58 and the third at 68.5 years. The PSA ranges from 0.47 to 83 (clearly an outlier given where the third quartile is) with first quartile at 4.6 and third quartile at 9.1. The IPSS ranges from 0 to 35 with first quartile at 11 and the third at 15. The whole gland volumes range from 10cc to 220cc. the transition zone ranges from 2cc to 156cc. the peripheral zone ranges from 3cc to 104cc. Thus we see less range in the peripheral zone compared to the transition zone despite a similar mean volume.
Asymmetry in the principal glandular zones (Table 2)
Using the Prostatocrit model, we can estimate the key indice, the proportion of acini in the peripheral zone (0.8x27.7cc=22.2cc). From this we can deduce that the remaining volume is stroma (27.7cc-22.2cc=5.5cc). We estimate the whole acina mass as 0.7x57.6cc=40.3cc. We deduce the transition zone acinal volume by subtracting the peripheral acina volume from the total acina volume (40.3cc-22.2cc=18.1cc).
There is a greater relative amount of stroma in the transition zone. The peripheral zone has less than half the stroma of the transition zone (5.5cc v 11.7cc) and the two zones have similar acini volume (22.2cc v 18.1cc). Here lies the asymmetry.
PSA (Figure 3a & 3b)
The whole gland volumes and PSA are high (right skewed). There is an increase in PSA of 0.23ng/ml/year.
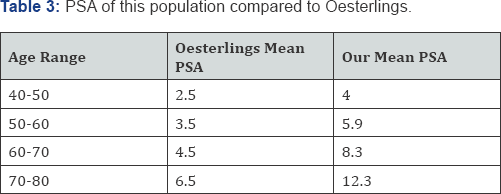
When we compare our PSA values with Oesterlings (Table 3) age groups [25], we see almost twice the level for every age group. Our population appears to be twenty years older. This is a population referred because of elevated PSA.


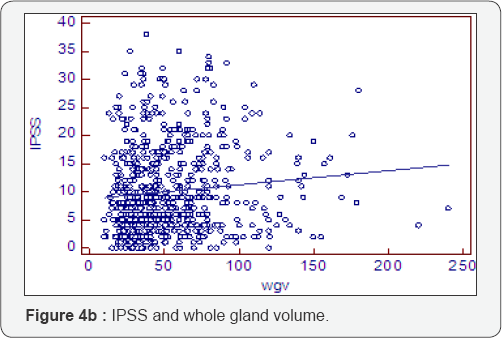
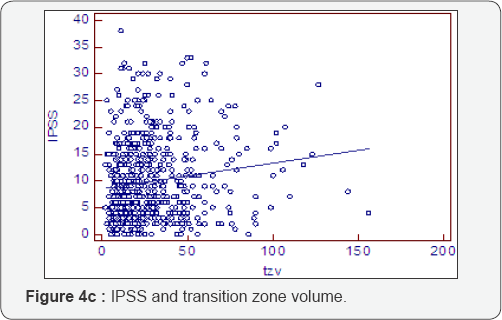
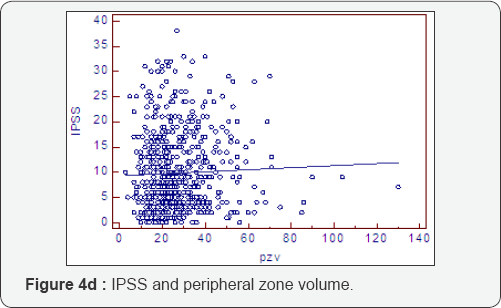
Symptoms and conventional volumes (Table 4, Figure 4a-4d)
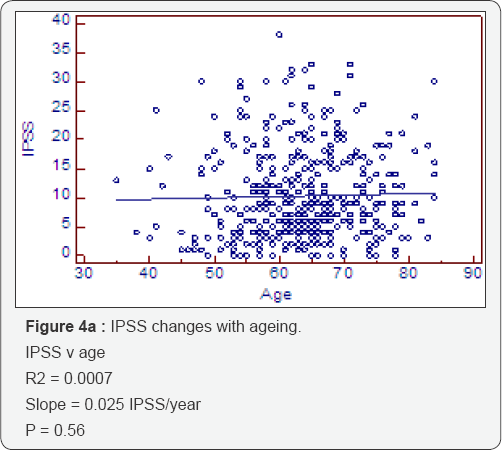
There is no significant increase in the IPSS score with ageing (deterioration of 0.025IPSS units/cc) (P=0.56). However, when we look at the deterioration of IPSS with overall gland volume we do see a significant effect of 0.025IPSS units/cc (P=0.006). This is due to a highly significant transition zone affect of 0. 047IPSS units/cc (P=0.0004) compared to a non significant association with the peripheral zone of 0.02IPSS/cc (P=0.355). The peripheral zone, which is mostly acini, is not associated with a deterioration in symptom score. The transition zone which has a greater amount of stroma is associated with a deterioration of symptom score with increasing size. The slope is twice as steep for the transition zone compared to either whole gland or peripheral zone.
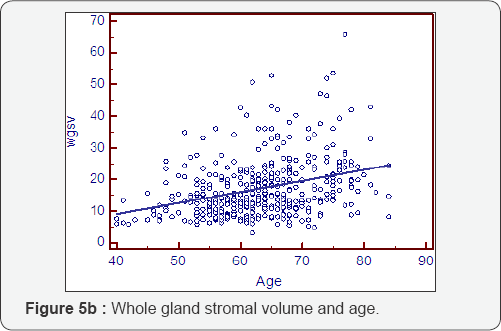
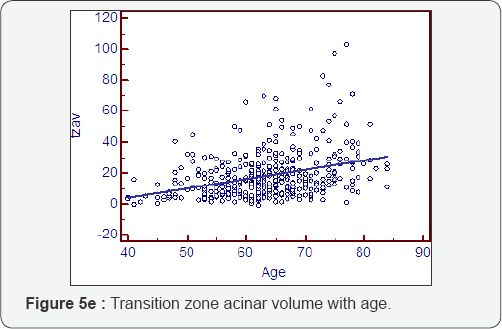
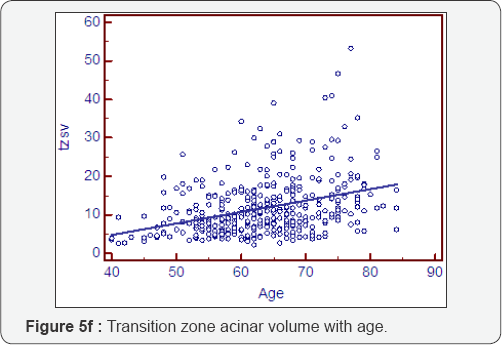
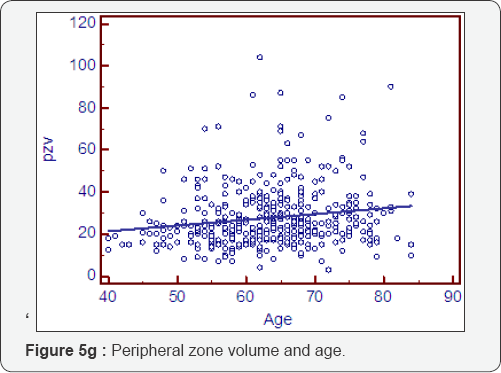
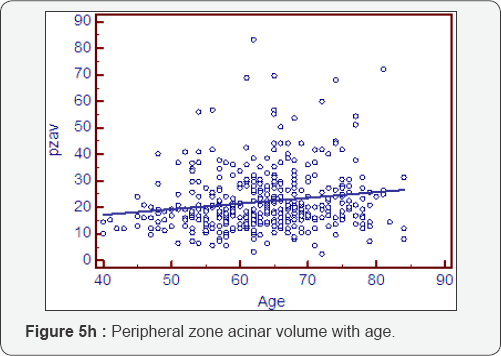
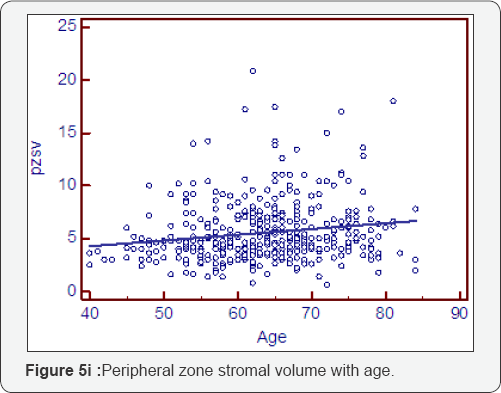
Prostatocrit volumes and ageing (Table 5, Figure 5a- 5i)
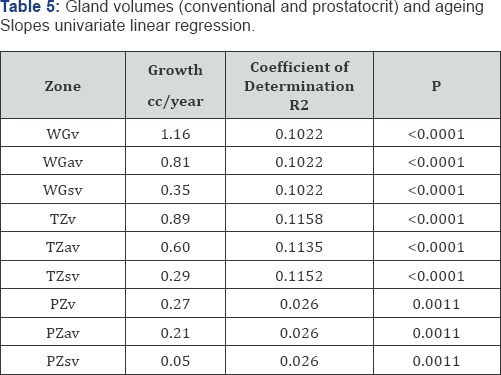
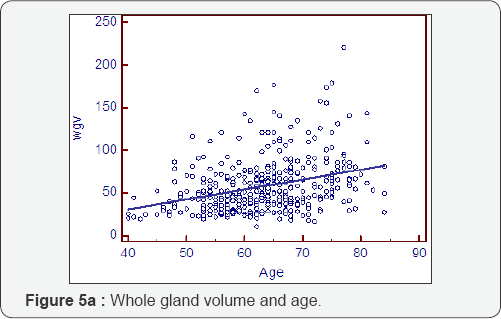
The whole gland grows at 1.16cc/year mostly due to acini (0.81cc/year). The transition zone grows at a greater rate, x3, than the peripheral zone (0.89cc/year cf 0.27cc/year). However, when one look at the relative acinal and stromal growth patterns, we see the transition zone acini growing x3 that of the peripheral zone acini (0.6cc/year cf 0.21cc/year) with an even more pronounced difference in the stromal components. The transition zone stroma grows at x 6 that of the peripheral zone stroma which is almost negligible (0.29cc/year v 0.05cc/year). This prostatocrit insight confirms what would be predicted from clinical and pathological experience.


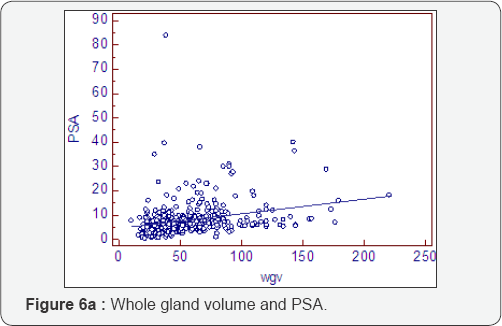
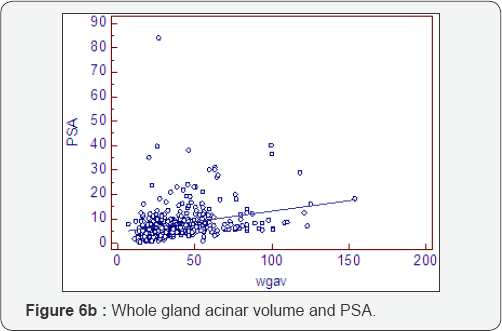
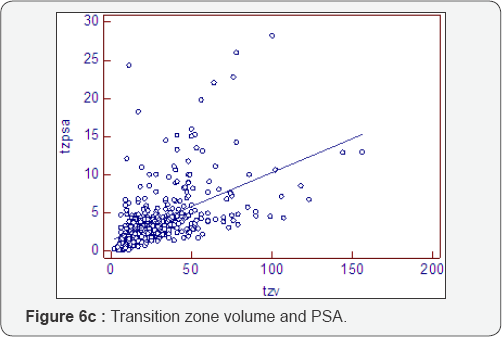
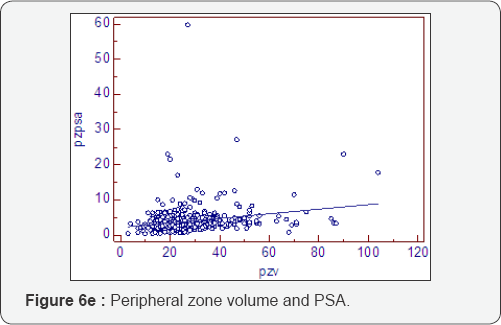
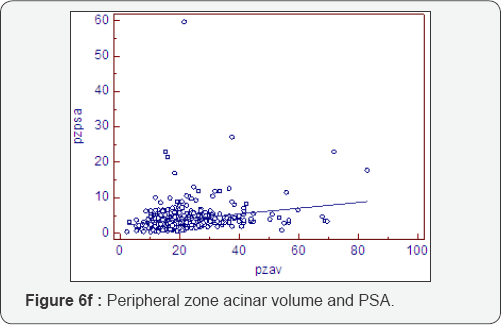
Prostatocrit and PSA secretion (Table 6, Figure 6a-6f)
PSA secretion is greater in the transition zone acini than the peripheral zone acini (0.134 cf 0.081) despite more acini within the peripheral zone. This is well recognised [26,27] and appears to be due to the paracrine growth factor activity of the stoma on the acini. The TZav (Figure 6d) has a coefficient of 0.286 which explains 53% of PSA secretion.

Prostatocrit and PSA density with ageing (Table 7, Figure 7a-7f)
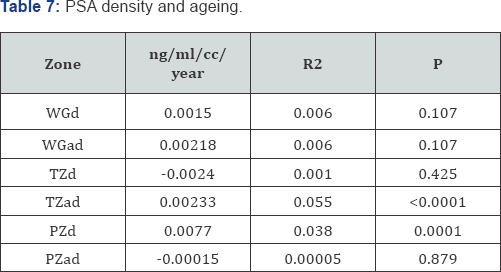
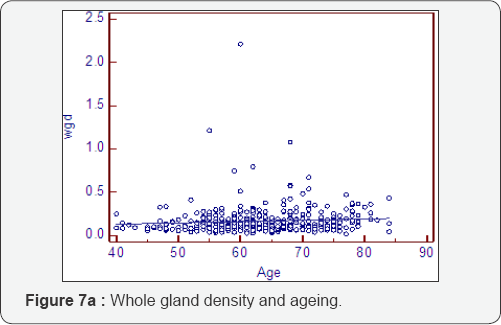
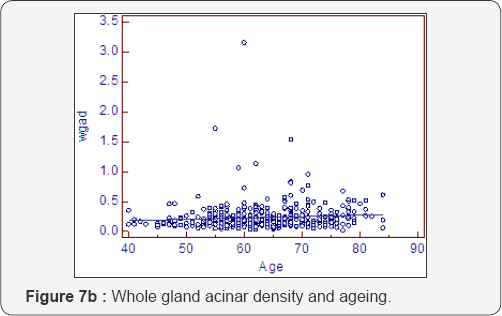
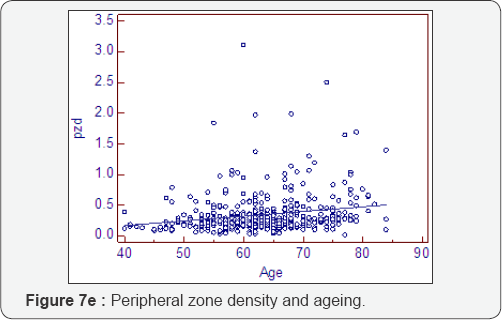
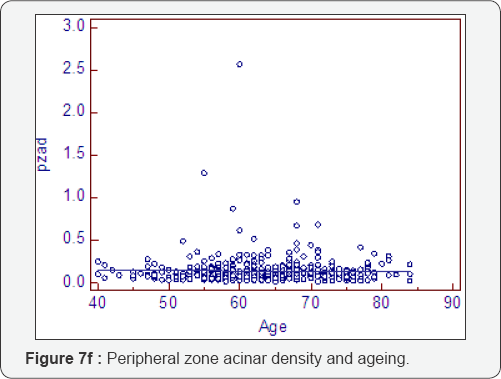
Dividing the PSA into the acinal bulk we get a "true" acinal density. There is a non significant increase in overall density with age whether one considers the entire gland or the acinal bulk itself (P=0.107). Neither does the overall transition zone density increase with time (P=0.425), despite an increase in acini, no doubt due to variable decrements in PSA production. However, when accounting for TZ acinal bulk using the prostatocrit, the PSA density increases significantly (P=0.0001).


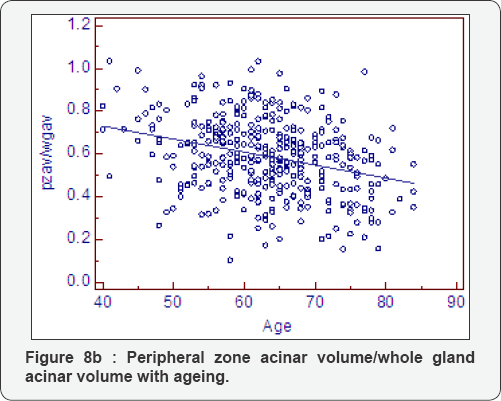
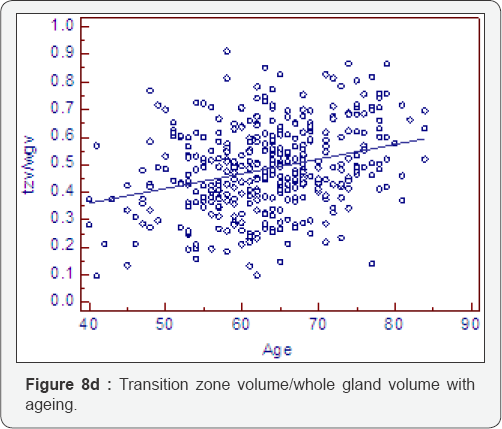
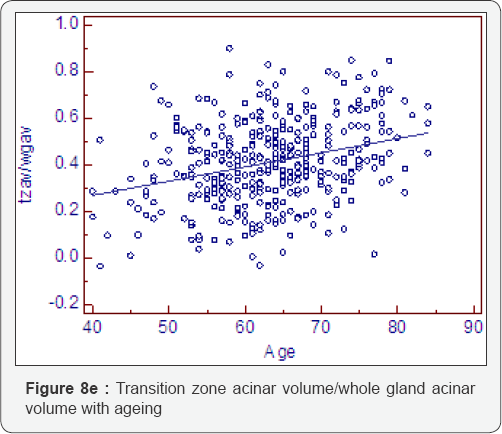
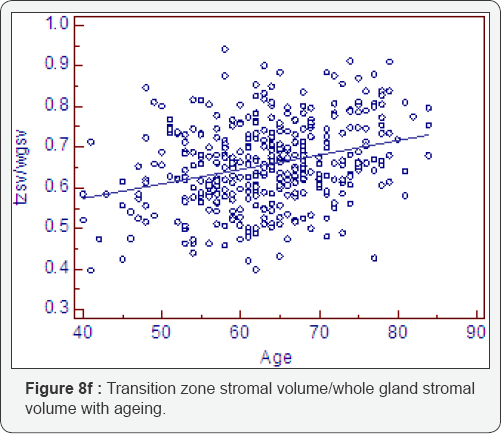
Ratio change with ageing (Table 8, Figure 8a-8f)
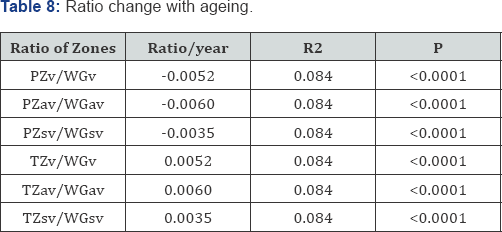
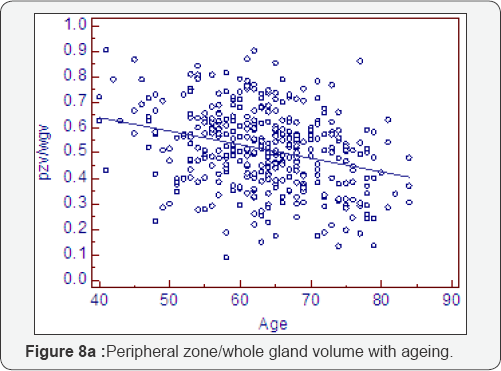
As expected all measurements of relative growth show a consistent and well recognised picture. The rate of peripheral zone, overall, acinal and stromal growth, relative to the whole gland, decreases with time (P<0.0001). The rate of transitional, whole gland, acinal and stromal, increases with time (P<0.0001).

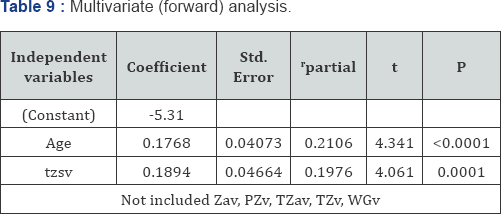
Multivariate analysis and PSA using the prostatocrit (Table 9)
Only age and the stromal component of the transition zone (TZsv) were significant predictors of PSA production. Neither the acini of the transition zone nor the peripheral zone acini/stroma nor whole gland volume were significant. This is consistent with prostatocrit stroma being the chief mediator of BPH and LUTS [26,27].
Conclusion
The prostatocrit model is new and intuitive but supports current theories on the role of the stroma in BPH and lUTS. It has been used to successfully predict the risk of cancer [4] and now we reveal its application to the benign growth of this gland. The transition zone stroma is key to PSA secretion and this was confirmed using the model.
This model is logical and illustrates known attributes and trends in growth of each zone into its acinal and stromal components, and may offer a more intuitive framework to gauge the behaviour of the gland. The decrease in transition zone acinar density and the increase in transition zone stromal/acinal volume are the most likely cause of LUTS.
We would predict stronger relationships for the effects of drugs in trials such as MTOPS, PLESS and COMBAT if this model were adopted. Potentially better stratification of patients i. e., those most likely to respond would be those with large transition zone stromal volumes. We will also be able to compare the different growth dynamics of cancerous glands and we plan to demonstrate this.
Limitations
Many of the negative biopsies will have undetected prostate cancer and finding a cohort without this is problematic. We have not been able to follow up men longitudinally and have had to rely on a cross sectional study. MRI will almost certainly be able to better quantify the zones. Although we have seen no significant difference in MRI and TRUS for whole gland volumes, we do not know that it applies to the zones. The estimation of acini is an approximation based on a standard normal prostate gland in a young man. The amount of acini is not the only factor governing PSA secretion and the relation between epithelium and stroma is difficult to quantify and this is reflected in our low correlation coefficients as well as others [7-9]. This complex relationship lies beyond simple measurement of zonal volumes and acinal asymmetry.
Strengths
The prostatocrit makes logical sense and is based on sound anatomic principles. TRUS can define the zones easily and cheaply and it is readily available although operator dependent. TRUS is a good approximation to the volume even if MRI subsequently outperforms it. Although estimation of acini percentage in the zones is problematic the asymmetry is not.
To
Know More About JOJ
Urology & Nephrology Please Click on:
https://juniperpublishers.com/jojun/index.php
To Know More About Open
Access Journals Publishers Please Click on: Juniper
Publishers


No comments:
Post a Comment