Civil Engineering Research - Juniper Publishers
Abstract
Public transport services face many challenges around the world. Due to the rise in demand for public transport, authorities desperately need to develop the systems, and it provides a service to be the same level for private cars in terms of service reliability measures. This research aims to study the influence of the non-scheduled random public mini bus stops on travel time for a specific mini bus route. These non-scheduled stops became a habitual behavior for Public mini buses, which affects the daily users of this transportation service in Jordan. In this study, a comprehensive plan was designed to collect data regarding the mini bus behavior along a selected bus route, using a transit on- board survey, GPS and questionnaires. The data collection involved locations of non-scheduled stops, number of stops, distance and speed. The data was then used to develop a trip time model. The developed model detects the delay time due to the non- scheduled mini bus stops. The analysis of the data indicated that passengers mainly depend on random mini bus stops because there aren’t scheduled stops, thus a large impact on traffic jam. Furthermore, it was found that the main variables that affect the trip travel time are the total delay time due to stopping randomly to board and alight passengers. The study concluded that eliminating the non-scheduled mini bus stops will reduce the trip time, thus get improve he service reliability.
Keywords: Public transport; Non-scheduled stops; Service reliability; Minibus
Introduction
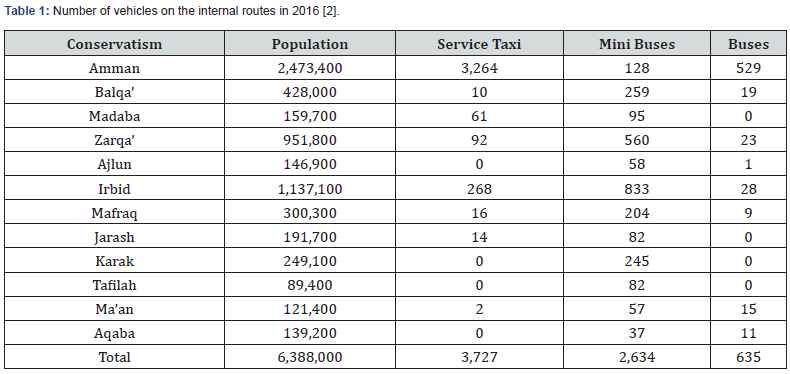
All urban areas, especially the Amman increasing growth in the last years was reflected by the rising numbers of population and expansion of built area. This growth has been accompanied by an increase in the volume of traffic in the city, as is clear in the rising number of vehicles, volumes of traffic and the number of public transport users, which began to adversely affect the ability of citizens to move plus costs and the negative effects of traffic congestion that have become a general phenomenon on the streets of Amman. It is possible to measure the level of demand for mobility by relating two main factors: Population and the number of daily trips per person. for 1000 inhabitants which is nearly two times rates of other Middle East and North Africa (MENA)’s countries such as Morocco, Tunisia and Syria [1]. To improve the public transport need to develop a legislative and institutional framework, staff transport, traffic sector to identify needs, strategies the master plan for transport, traffic and direct the improvement of the public and the development of transport in a modern and effective system of transport services such as Bus Rapid Transit (BRT) Light Rail Transit (LRT), metro, restructure routes and major services. The transportation means for public transportation with population for each governorate in Table 1 which shows the numbers for many transportation means utilized for routes in the many Jordanian provinces in 2016, furthermore shows the population each governorate [2].
Service reliability measures include arriving on time, short travel/run time, and low variance in travel time [3,4]. The random stops affect the travel time of the bus intensely and make it difficult to stick to the original fixed schedule. This leads to unreliable arrival and departure times that were found to be one of the main factors unfavorable people to using public transport [5].
There are several factors affecting the running time and determined as follows:
a. Segment length: distance between two point
b. Bus stops: the number of bus stops
c. Intersection: Number of signalized intersections
d. Road: the road geometry and characteristics
e. Boarding: passengers boarding from the bus
f. Alighting: passengers get off from the bus
g. Weather: weather conditions as snow, etc.
h. Time: period of time.
i. Driver: the driver practice and experience on driving.
j. Stop delay time: Lost time at the bus stop and this depends on the bus itself.
k. Departure delay: Departure time subtract the scheduled time.
l. Period of service: For how long the driver was on service during the duration of the study.
m. Direction: Internal and external service.
n. Nonrecurring events: such as bridge opening, etc. [6]
Elhabib it his research paper study the influence of the positions of non-regular buses in Egypt, Cairo, where she worked this research paper on the collection of data relevant to a specific route by using the global poisoning system(GPS), these data include time, location and speed, which the use of such data to make trip time modal, shows of this model that people do not trust the positions of bus stops and time delays due to unscheduled positions specified timetable [7]. In this study will focus on transit travel time and service reliability which effect on public transport. One of the problems that affect the random stand for buses, the unfavorable influence of the non-scheduled random public minibus stops on trip time for a specific minibus route will be studied in Amman.
Abojaradeh Mohammad it his research paper presents a travel time and delay study on the public transit system inside Amman area in Jordan. Amman–Sweileh line is a busy and vital line connecting major areas inside Amman [8]. The main importance of this study is to convince and attract the public to use the public transit system for travel instead of using their private cars. If that can be achieved, many advantages can be attained. By using the public transit system instead of using private cars, the following advantages can be attained: reducing the congestion on the road network especially during peak hours, reducing the cost of traveling for the public, increasing the efficiency of the road network, increasing safety, reducing the maintenance cost of the roads, improving traffic flow and traffic operations, and reducing air pollution and preserving the environment. It was found that there is a major difference in travel time between using the public transit system and using the private car. Also, it was found that the main variables that affect the trip travel time are: The total delay time due to stopping to pick up and discharge passengers and due to stopping at fixed interruptions, the bus model, and the bus size.
These non-scheduled stops became a habitual behavior for Amman public mini buses, that effects on daily users of this transportation service in Amman. Nonscheduled random stops, are those stops done by the minibus drivers to pick up and drop off passengers at anywhere points on the route rather than the official mini bus stops. In this study, a comprehensive plan was designed to collect data regarding the mini bus behavior along a selected bus route, using a transit on-board survey, GPS. The data collection involved locations of non-scheduled stops, number of stops, distance and speed. The data was then used to develop a trip time model. The developed model detects the delay time due to the non- scheduled mini bus stops.
Material and Methodology
Case Study
The Jordanian public transit systems are managed by the Ministry of Transportation through the of the Amman Governorate with a population of approximately 4,000,000 people and an area of 1,680 square kilometers. Amman has frequent bus connections to other governorate in Jordan, in addition to main cities in neighboring countries also served by service taxis. Internal transport is served by a number of bus routes also by mini bus and service taxis. Amman has been selected as the case study for this research depends on many reasons; these reasons are as follow:
Significant rise in demand because of the increased:
• Population growth and socio-economic factors
• Increase in intensity of land use
As well as expanding urbanization area, road system is formerly overburden badly public transport system as follow:
• Public transport mode share of 14% according to GAM
• Larger number of public transport trips are made by car-based services, either shared taxi
In addition to no rapid transit or high-capacity passenger transportation, on the other hand limited funding partition for transportation projects.
North terminal - Jordan University line was chosen, due to the large number of passengers and the demand on the route as well as a very essential line that connecting to the major rejoin inside Amman, thus it represents most of the lines.
Methodology
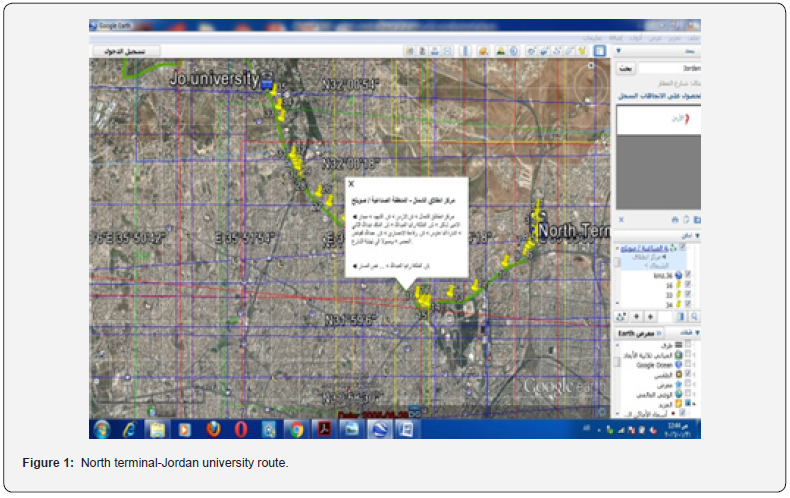
On-board transit survey was conducted to measure the existing conditions of the selected route, where the survey aimed to collect data from routes. The survey includes gathering data about the trip length, numbers of picked and discharged passenger, numbers of randomly stops during the trip, travel time, running time and delay. In order to achieve the thesis purposes that estimate the delay time due to the non-scheduled random stops. Selected north terminal - Jordan university route for the study. This line begins from North terminal and ends at Jordan university terminal. There are 24 buses on this line, the route around 10 km length consist of segments of several road classes with different width and there is no scheduled minibus stop. This line is an interrupted line which consists of two roundabouts, Interior circle and Sport City circle.
Position (longitude and latitude) of non-scheduled stops data had been conducted by Global Positioning System (GPS). Starting in the early morning many runs on the route for on direction from North terminal to Jordan University by public transit system to develop a trip time model. The developed model then uses to assess delay time due to the non-scheduled minibus random stops.
Data Collection
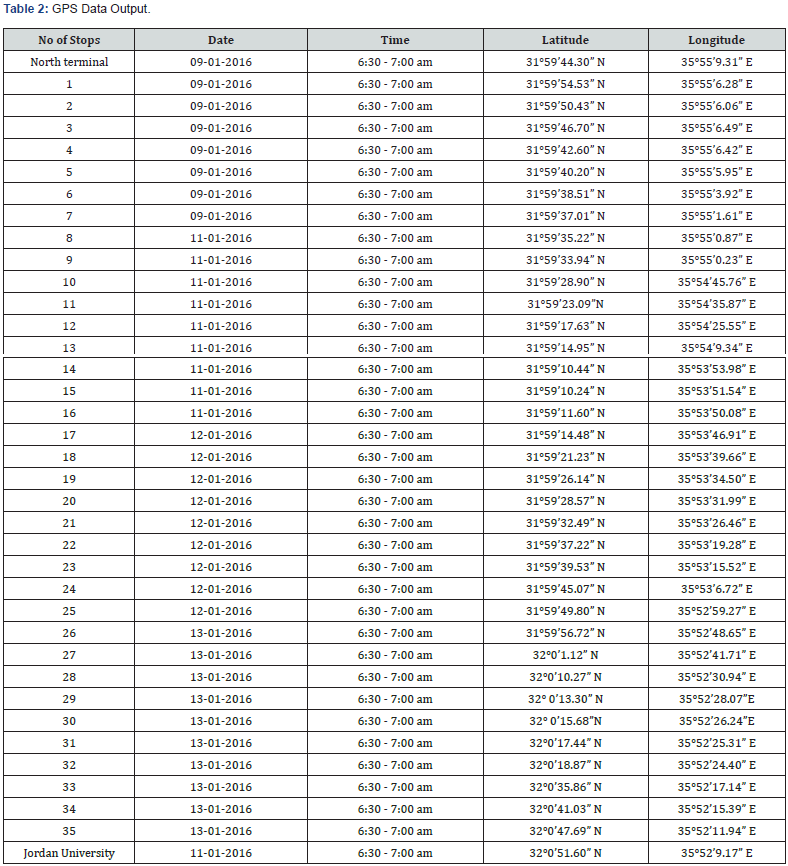
The position of non-scheduled random stops data was collected using a GPS (Global Positioning System) instrument. GPS was used with accuracy of 3-5 m, which is a relevant reliable accuracy for this study. The collected data included position and time of pickup and discharge of passengers. The positions of the non-scheduled stops were logged in as points of interests. Table 2 gives the GPS output data, and their representation on Google Earth in Figure 1.
Twenty runs were undertaken on the specific route starting 6:30-7:00 A.M.; the runs were performed on the same route therefore that the road characteristics variations are constant in all runs. At 6:30 A.M. in the early morning, traffic volume in Amman streets tends to be approximately at free flow condition. The congestion factor does not affect the bus route as well as there is no signalized intersections. Finally, the effective factors used in the thesis are the number of the non-scheduled random stops, in addition to the distance covered by the minibus at an average speed. Data was collected for the line using the public transit system on different days mainly on Saturday as weekend and Monday, Tuesday and Wednesday as weekdays for one trip direction.
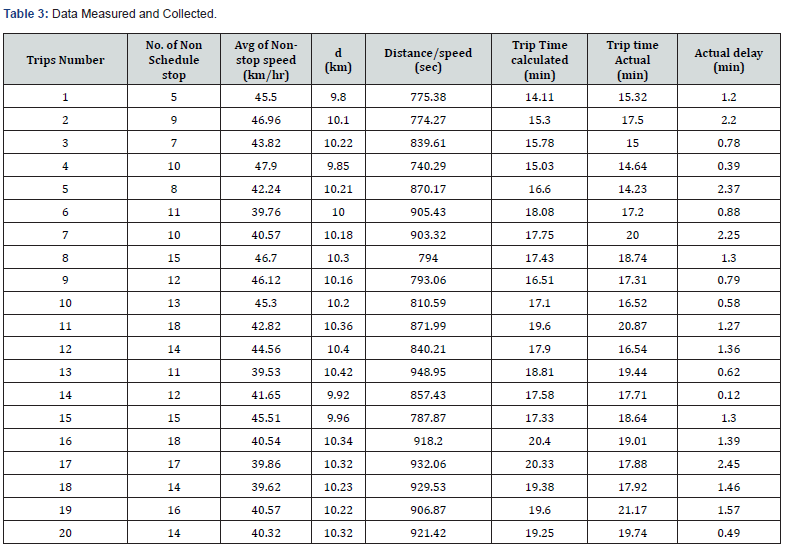
The following data was measured and collected:
i. The travel time
ii. The running time
iii. Total delay time from dwell time, reentering of the traffic and acceleration deceleration time.
iv. The numbers of stopping for boarding and alighting of passengers.
v. Dwell time due to stopping for boarding and alighting of passengers
vi. Average of nonstop speed.
All these data shown in the Table 3.
Data Analysis
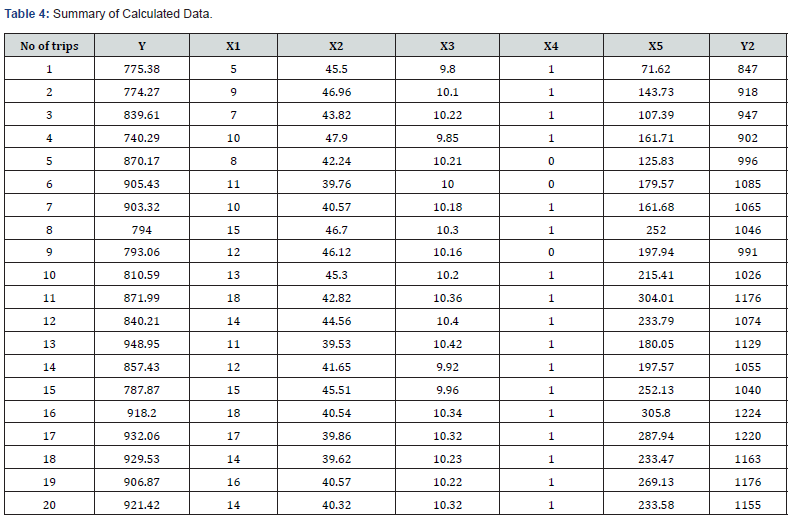
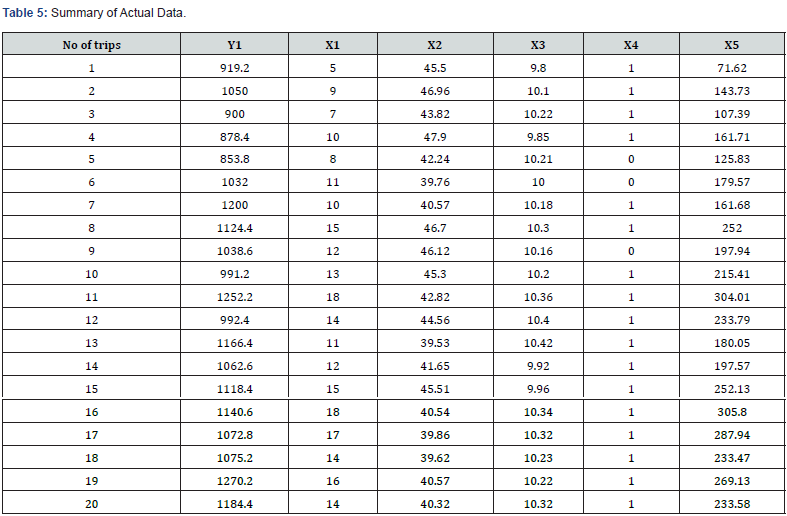
The collected data was analyzed to get the number of nonscheduled stops, route distance and the non-stop average speed. These variables used in developing the trip time model. list for analyzed runs, all these data are summarized and shown in Table 4 & 5 These different variables were labeled as follows:
Y= Running time calculated (sec).
X1= No. of non-schedule stops.
X2= Average nonstop speed (Km/hr).
X3= Distance (Km).
X4= Bus model (1 for new Bus,0 for old)
X5= Delay time computed (sec).
Y1= Trip time Actual (sec).
Y2= Trip time calculated (sec).
To find the relationship between several variables, regression analysis was used. Regression analysis is a statistical technique for modeling as well as investigating the relationship between more than one variables. SPSS (Statistical Package for Social Sciences) software was used in building the Regression Models in this thesis. SPSS is considered one of the most frequently used program for researchers in several fields.
The multiple regression models are as follows: The General Linear procedure in SPSS was done for the following:
Model between running time Y as dependent variable, and independent variables X1, X2, X3, and X4. With R2 = 0.90, R-adjusted =0.88
Y= 0.048X1 -19.68 X2 + 79.73 X3 +1.387 X4+889 (1)
Model between trip time calculated Y2 as dependent variable, and independent variables X1, Y and X3. With R2 = 0.94, R-adjusted = 0.85
Y2 = 1.003Y + 17.968 X1- 0.079 X2 +24.162 (2)
By using the selection of variables in multiple regression to find the best variables to in the model, Stepwise Regression Procedure was used for this objective. The best multiple regression models are as follows:
Y = -21.78 X2 + 1792 (3)
With R2 = 0.905, R-adjusted=0.82
Y= -19.67X2+ 80.76X3+880 (4)
With R2 = 0.90, R-adjusted=0.84
The multiple regression models are as follows:
Y1 = -12.82 X2 +14.91 X3 +68X4 + 0.69 X5+1210 (5)
With R2 = 0.62, R-adjusted =0.56
Y1 = 83.12 X3 + 19.66 X5+17.5 (6)
With R2 = 0.77, R-adjusted= 0.65
The best Stepwise regression models are as follows:
Y1 = 22.39X1+787 (7)
With R2= 0.55, R-adjusted =0.50
Results
Trip Time Model
The trip time model as shown in the following, is a function of number of non-scheduled stops, travel time calculated from distance/nonstop speed as well as the average nonstop speed.Trip Time = F (Nnon.SC×Dt +D/S) (8)
Where D/S= travel time, Dt = delay time, Nnon.SC= Number of Nonscheduled stops, D=distance, S= Average Nonstop Speed.
The delay time in this study involves, deceleration and acceleration time, dwell time as well as reentering traffic delay. Linear Regression analysis was used to develop the following best fit model for this route as shown in the following:
T(s)= 1.003D/S + 17.968 Nnon.SC - 0.079 S +24.162 (9)
With R2 = 0.94.
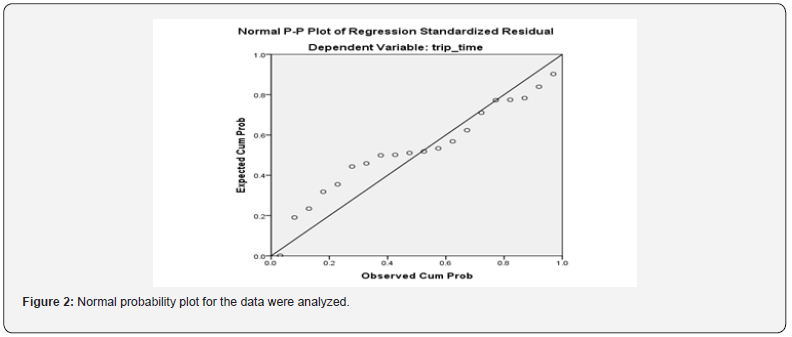
The results represent that for this route, When the bus stops random that will be increase in the delay time, thus increase trip time. The data analysis R2= 0. 94, with 95% significance level for the coefficient. The normal probability plot of the data analyzed is shown in Figure 2.
Model Validation
To compare the results of my study and the accuracy of the data collected also the accuracy of model needed a new line of another study to be few differences, so choose Amman-Sweileh route (Abo jaradeh Mohammad) and illustrated by the following Figure 3.
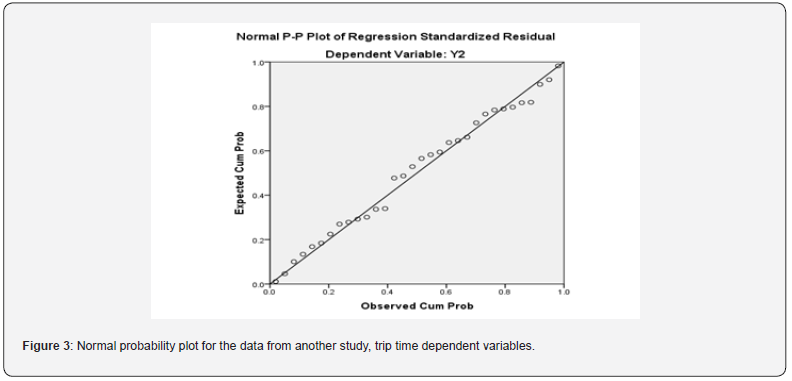
From the calculated trip time model for this study, the value equal 888.5 sec and from another study data equal 998.7 sec, thus the error = 11%.
Conclusion
i. It is clear from the study that the most delay time because of the number of non-scheduled random stops and there are no scheduled stops for mini buses, that means the random stops has a considerable effect on the trip time. Based on the model for this route, where the coefficient of number of non-scheduled stops equal 17.968.
ii. The waiting time for the public transit mini bus for route North Terminal-Jordan university isn’t high value. Where 125 agree that there are relatively long waiting times and many random stops during the bus route from questionnaire survey.
iii. Delay problems happen at any time of the day in Amman, this situation can be solved by making a specific stop for boarding and alighting along the line, also period of time for waiting not exceed to 1 minute.
iv. Obviously the most important reasons for the delay time in Amman that does not have a specific timetable for buses as well as scheduled stops for passengers.
The improvement and development of the public transit system is important to attract people to use it and it has relied upon great. The improvement by the following:
• Make fixed stops in the line.
• Make safe, comfortable and shaded location for passengers Bus stops.
• Make specific time for buses on fixed stop to waiting passenger.
Installing tracking device on the bus(GPS) in order to bus driver commitment to stop only on the scheduled stops with a specific time and specific speed.


No comments:
Post a Comment