Physical Fitness, Medicine & Treatment in Sports - Juniper Publishers
Abstract
The pandemic situation restricted the access to public gyms and physical interactions with the trainers, which has escalated use of the mobile applications (apps) related to fitness and exercise. In this perspective, we conducted a market survey of fitness related apps to probe its strengths and weaknesses. Here, we curated 46 apps from five major categories or app-groups, namely (A) Injury prevention, (B) Fitness and exercise, (C) Diets, (D) Hydration and (E) Mental health. We scored these apps based on three broad criteria to evaluate their entire project cycles, starting from acquiring data to presenting final recommendations. Input customization related questions probed the app’s data acquisition aptitude that essentially governed the app’s degree of precision and power of customization. Method optimization related questions measured the app’s operational flexibility and transparency in data processing. Finally, the output readiness related questions evaluated the comprehensiveness of the apps’ final output. Subsequent multivariate analyses determined the performance metrics of individual app-groups and the market comprised of all 46 apps. Our result showed that this fitness app-market was equipped to cater a large and diverse user-base with acceptable degree of operational ease. However, a holistic app that can fully satisfy the entire psycho-physiological demands remained elusive. Furthermore, our analysis pointed out a potential underrepresentation of the apps, which were dedicated to improving mental fitness and related aspects.
Keywords: Mobile apps, Survey, Fitness, Exercise, Mental health, Injury prevention, Diet, Hydration
Introduction
In this age of digitization to progressively avail data publicly, it has been increasingly easy for the computational models to channelize this vast knowledge to deliver meaningful solutions [1]. Mobile applications (apps) have long been working in the same line to process the available information towards presenting customized recommendations [2]. The health and fitness market are one of the early sectors that began constructing customizable solutions [3,4] and recent developments of wearable devices that can monitor fitness real time [5] have increased the opportunity of these apps manifold. In this context, it was aptly noted “mobile apps can offer a better holistic view of health and fitness data. Data can then be analyzed to offer better and more personalized advice and care [6].” Proliferation of health and fitness related mobile apps is significant and the affinity of these apps to the fitness-dedicated and technology-savvy customers have always been very high [7,8]. Meanwhile, the COVID-19 pandemic situation has shifted the market dynamics, since attending public gyms and consulting trainers in person become increasingly challenging, and outdoor activities becomes restricted. A recent survey revealed that the pandemic decreased U.S. residents’ physical activity levels by nearly 18%, but the use of fitness related apps increased simultaneously and proportionately [9].
This increased traction of fitness related mobile apps motivated us to survey this app market. Our objective was to understand the fitness related app market’s strengths and weaknesses. True to any survey work, we were limited by the number of apps curated for screening and the latitude of success criteria selected to measure the performances. Furthermore, developing a new app and/or presenting an app-based solution was beyond the scope of the present work. Hence, we curated those apps, which were pre-selected as the market leaders by independent studies. We identified five fitness app categories of interest or app-groups related to the injury prevention, fitness and exercise, diets, hydration, and mental health, respectively. A total of forty-six (46) apps were selected from these categories, which were surveyed based on sixteen (16) questions or criteria. Multivariate analysis revealed potential market trends, which were consistent across all five app-groups. In conclusion, we suggested one opportunity for market improvement that stemmed from the market’s potential low appropriation of mental health. This is particularly important in the present pandemic situation, when the rising concerns about mental health has been fueled by social distancing, curtailed physical interaction, and continued lacking public empathy to mental illnesses [10,11].
Methods
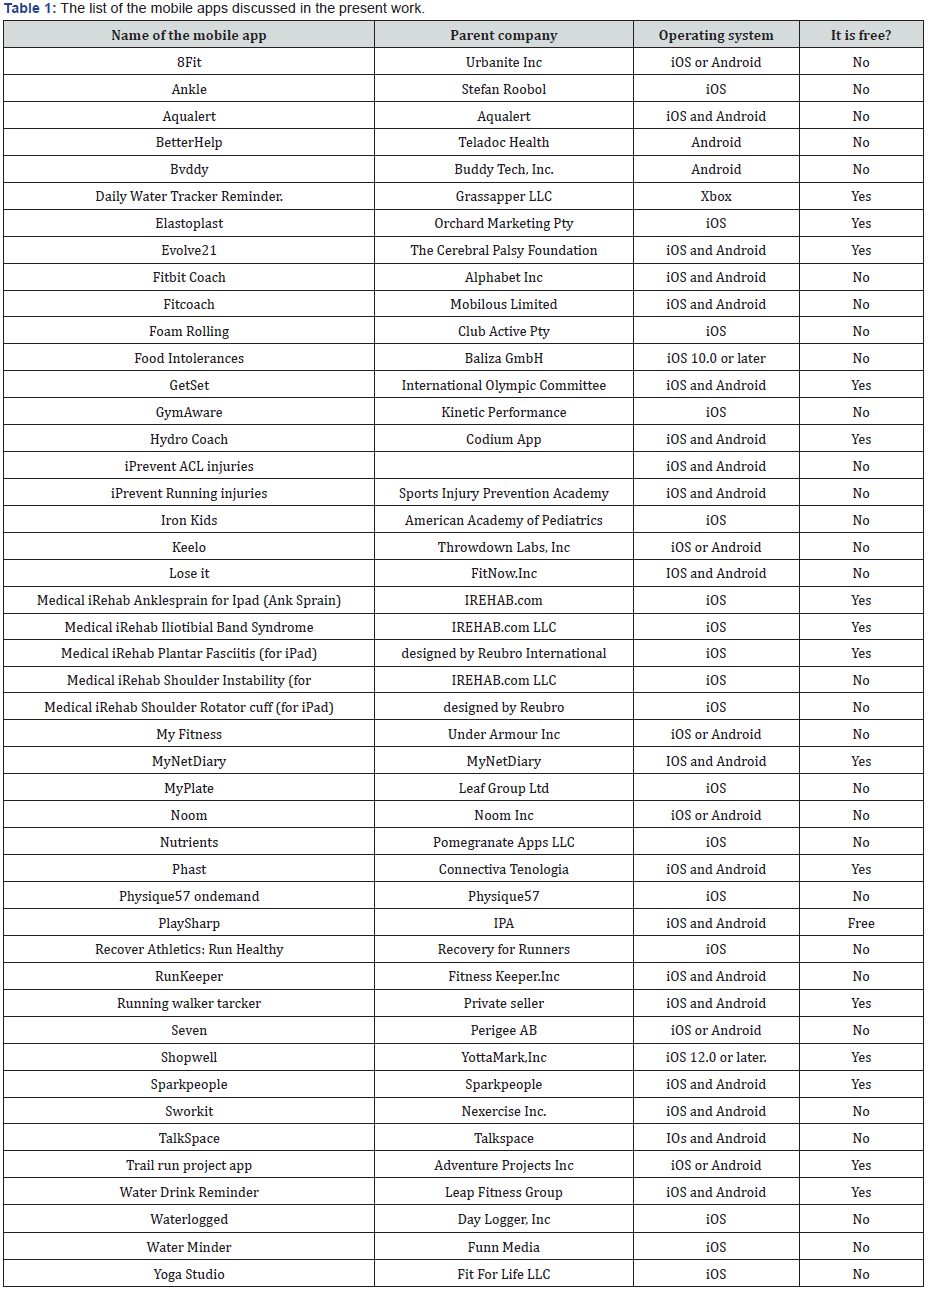
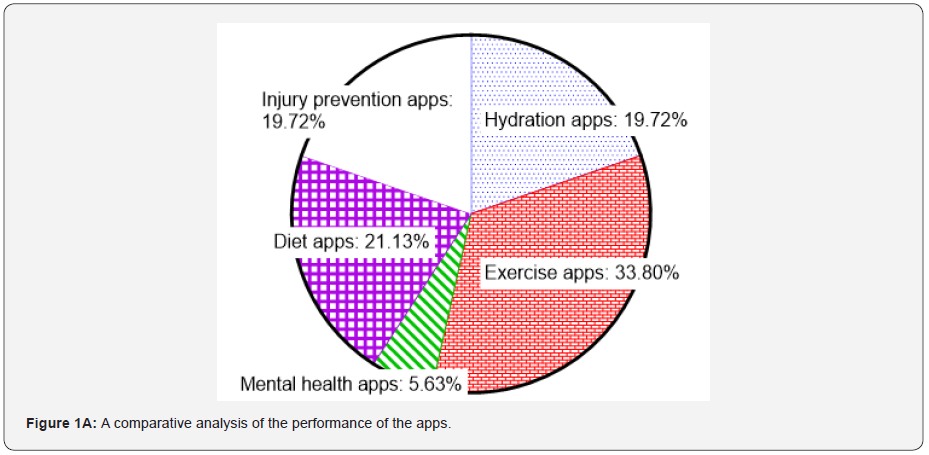
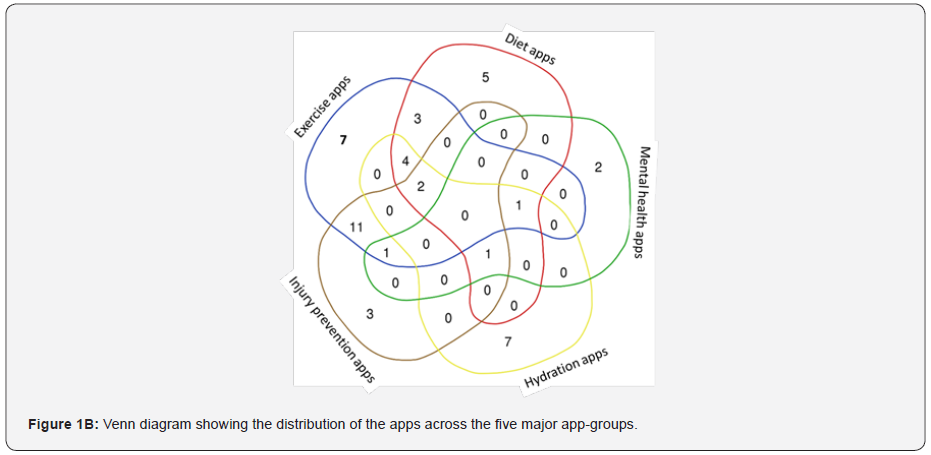
The process of selecting mobile apps for the present study was guided by a single criterion: the app-users should be benefitted in at least one of the following five Paradigms of Interest (PoI) - injury prevention, exercise regime, diet choice, hydration level and/or improvement of mental fitness. We used these five keywords linked to the five PoIs to mine the apps from app stores (Apple App Store and Google Play) and Google based keyword searches12-15. Ultimately, we curated forty-six (46) mobile apps. These apps were available in either or both operating systems, namely Android and iOS operating (Table 1). We segregated these 67 apps in the five relevant app-groups linked to PoIs, namely (1) Injury prevention apps, (2) Fitness and exercise apps, (3) Diet apps, (4) Hydration apps and (5) Mental health apps. Rather expectedly, some of these 46 apps were enlisted in multiple appgroups, since they cater multi-modal information. Figures 1A & 1B display a pie chart and Venn diagram using these app-groups, respectively.
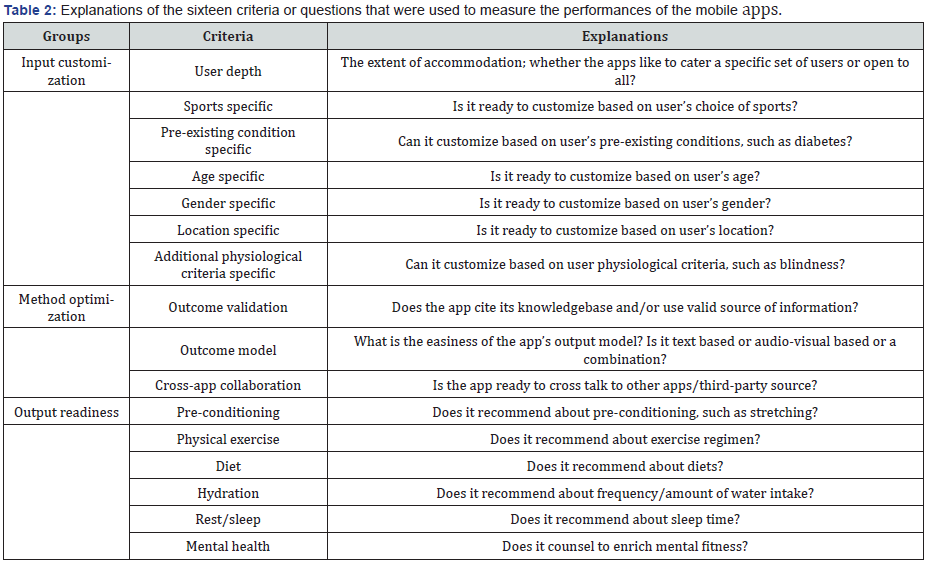
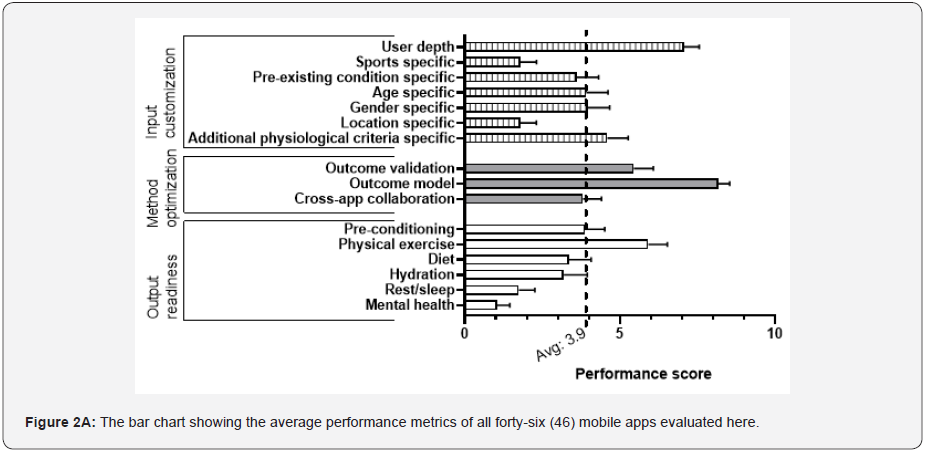
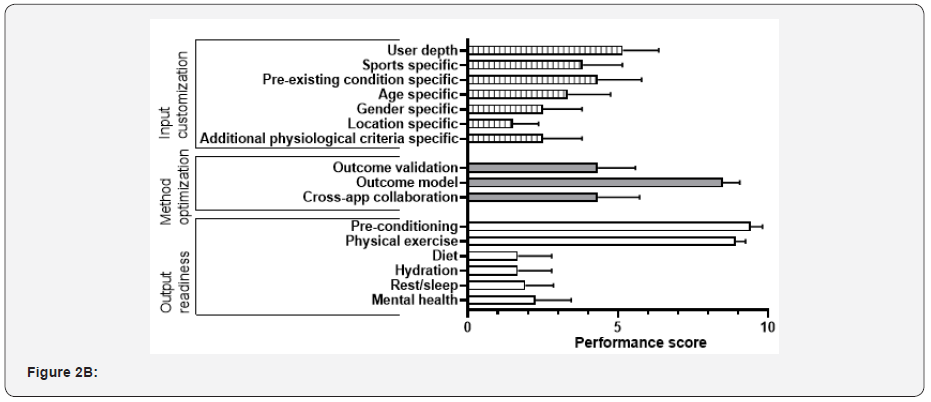
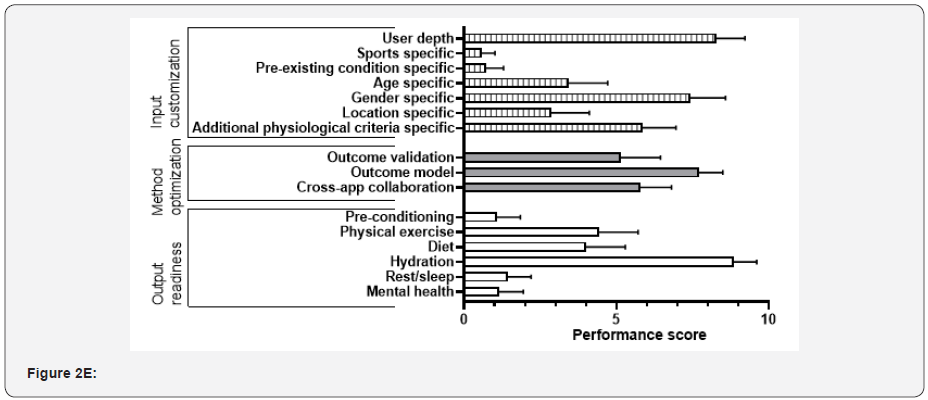
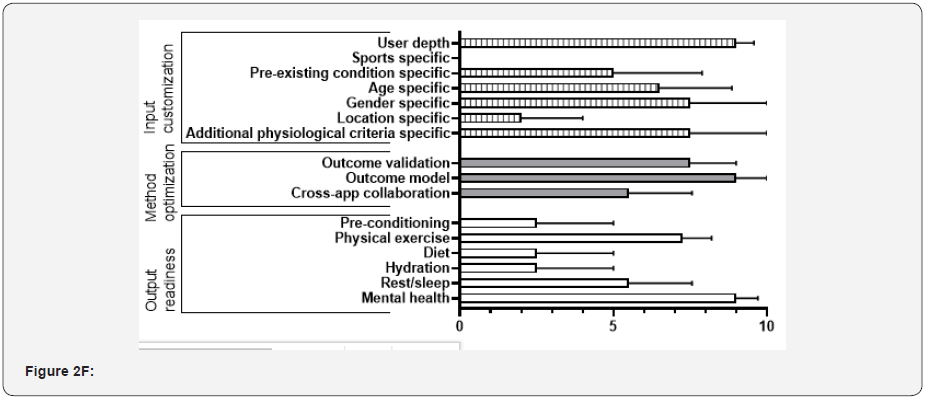
We determined 16 questions or criteria to measure the performances of these 46 apps (Table 2). Essentially, these questions were designed to probe three aspects of an app: the granularity of its inputs, its method of processing the inputs, and the comprehensiveness of its output characters. Each of the questions carried 10 points. Each co-author was assigned to conduct the first tier of scoring of a randomly selected group of apps, which was followed up by a second round of scoring conducted by another co-author. Finally, the senior author determined the final scores and sorted any conflicts. Figure 2A showed a bar chart depicting the 16 questions-based performance of all 46 apps. The result was presented by the average score ±Standard Error of Mean (SEM). Similarly, the 16 questions-based performance of individual 5 app-groups, namely Injury prevention apps, Fitness and exercise apps, Diet apps, Hydration apps and Mental health apps were shown in Figures 2B-F, respectively. Next, for each of the 16 questions, average value of all 46 apps was subtracted from that of the individual app-groups. For instance:
yi=〖Average〗_(i,j)-〖Average of all 46 apps _i
Here, i= Any of the 16 questions, e.g., user depth, sports specific, and so on j= Any of the 5 app-groups, e.g., Injury prevention apps, Fitness and exercise apps, Diet apps, Hydration apps and Mental health apps. Thereby, for each of the 16 questions, we obtained five values depicting their unique distances from the average values of entire 46 apps. These values were plotted in Figure 2G. This graph (Figure 2G) contained 80 data points: 5 app-groups × 16 questions or criteria = 80 data points. The average and standard deviation of 80 data points were computed. The data, which were plotted beyond the twice of standard deviations from the average of these 80 data points, were defined as outliers. All the analysis was computed by Microsoft Excel and GraphPad v8 (Prism, Inc., CA).
Results & Discussion
For the present survey, we evaluated 46 mobile apps. Together these apps were defined as our market. Based on their output character, these apps were categorized into five appgroups, namely Injury prevention apps, Fitness apps, Diet apps, Hydration apps and Mental health apps. Sixteen apps from this list were enlisted by more than one app-groups. A pie chart (Figure 1A) demonstrated the market share as claimed by these five app-groups. Exercise app-group comprised the highest market share (33.80%) whereas mental health app-group comprised the lowest (5.63%) share of this market. This result indicated a potential opportunity in the market to address mental health. The subsequent Venn diagram (Figure 1B) revealed the distribution of these 46 apps among the five app-groups. There were at least 14 apps out of 46, which provided the information associated with exercise and injury prevention simultaneously; and 3 from these 14 apps also considered diets and hydration related information to deliver their outputs. However, our analysis showed the absence of a single mobile app that was enabled to inform the users about all five PoIs. This also emerged as a major opportunity for the next generation app-developers; the available apps appear to lack tools to systematically integrate the entire knowledge base comprising physio-psyco-dietary information. To further probe the market’s characteristics, we formulated 16 questions or criteria to measure the market’s performance. Each criterion was focused on a particular aspect of the performance metrics (Table 2). Overall, these criteria were clustered into three groups, namely input customization, method optimization and output readiness. Thereby, we expected to probe the entire process of the app’s data mining aptitude - from data collection to delivery of recommendations. The average performance of all the apps was 4.0 with a standard deviation 4.5. At a more granular level, the average scores of the three groups of criteria, namely the input customization, method optimization and output readiness were 3.8±4.5, 5.8±4.1 & 4.5±4.5, respectively. Henceforth all the average data were accompanied by ±standard deviations. The outcome model under the method optimization group became the highest ranked criterion that potentially suggested that most of the apps were easy to operate, while equipped to use text, pictures and/ or audio-visual outlets to deliver their recommendations. Another high performing criterion was the user depth that possibly indicated the market’s strong preference to include a wide range of users. These were surely two major market strengths [12-15].
On the other hand, two low scoring criteria were linked to sports specificity and location specificity questions, respectively. A precise recommendation about exercise should depend on the user’s choice of sports, as elaborated by independent studies [16]. Based on these observations [16,17] one can argue that the preconditioning exercise for a swimmer would be different from a tennis player. Likewise, the location (and therefore the weather) of the users could play a major role in determining the final recommendations. For example, a user’s diet choice and hydration frequency should be customized based on the user’s location from sea level and the weather conditions18. Based on the inferences drawn from our analysis (Figure 2A), the present market showed certain limitations in integrating all these different sources of input to make a more robust decision. Within the realm of output readiness, the low performing criteria linked to sleep/rest and mental health further underscored a potential market gap. It seemed that this market was primarily focused on the physical fitness, and more apps linked to mental fitness were warranted [18].

Subsequently, we probed 5 individual app-groups to comprehend their strengths and weaknesses about further details. There were 23 mobile apps linked to physical fitness and exercise, which consumed the largest market share. The average performance of all the Exercise apps was 3.9±4.5. The performance scores of the three groups of criteria, namely input customization, method optimization and output readiness were 3.3±4.4, 6.4±4.1 and 3.3±4.4, respectively. Besides physical exercise, the other top ranked performance was again linked to the outcome model under the method optimization group. Following the overall market trend, the user depth under input customization also emerged as the strong performer. Notably, the high performances displayed by the outcome validation question suggested that most of these apps had consulted the available database to make their decision. On the other hand, low performing criterion linked to location specificity suggested a potential room for improving the level of precision for final recommendations. Another low performing criterion, namely hydration highlighted another potential market gap; since, independent studies identified hydration as a critical component of exercise regimen [19,20]. Apps related to diets shared second largest portion of the market. The average performance of all these 15 diet apps, and that of three groups of criteria including input customization, method optimization and output readiness were 5.1±4.5, 5.0±4.6, 6.4±4.0 and 4.5±4.6, respectively. All three questions associated with the method optimization group scored highly, which potentially highlighted the diet apps’ high aptitude towards integrating available knowledge base and technology workforce. Essentially, this was a major strength of the diet apps. On the other hand, low scoring questions that were specific to sports [21] or preexisting conditions [22] underlined potential rooms for modifications of these apps to customize the deliverables. Apps linked to injury prevention was another major stakeholder that included 14 apps. The average performance of all these 14 apps, and that of three groups of criteria including input customization, method optimization and output readiness were 4.1±4.5, 3.3±4.4, 5.7±4.3 and 4.3±4.6, respectively. Following the overall market trend, the outcome model emerged as one of the major top performers; and mental health and sleep/rest ranked lowest in the performance metrics. Notably, a below-average performance of questions related to diet was possibly a drawback of the injury prevention app-group. The healing process from musculoskeletal injury is a bioenergetics-driven process that intricately depends on the diet [23]. Hence, systematic insights of dietary selection could enhance overall applicability of the injury prevention apps.
Apps related to hydration shared the third largest portion of the market along with those, which were linked to injury prevention. The average performance of all these 14 apps, and that of three groups of criteria were 4.3±4.6, 4.2±4.7, 6.2±4.0 & 6.2±4.5, respectively. Following the overall market trend, the outcome model and user depth emerged as major top performers; and mental health and sleep/rest ranked lowest in the performance metrics. Relationships between the hydration and psychological fitness had been an emerging awareness, which should be integrated in the next generation apps [24,25]. Notably, a below-average performance of the question specific to sports was a possible drawback of hydration apps [20]. The recommended amount of water intake would vary with the choice of sports; for instance, the users interested in water sports might have different hydration needs than the runners [26]. This sort of knowledge integration was amiss in this app-group. Finally, the mental health apps covered the lowest market share. The basic character of these app-groups was reasonably different from the rest. Rather than presenting the input-driven recommendations, most mental health apps were programmed to connect the users to the subject matter experts and/or peers. Because we did not enroll ourselves to any of these apps, our ability to score these apps were limited to evaluate the pertinent web descriptions. Thereby, we tried to score them to the best of our knowledge, based on what information was available without enrolling. The average performance of all these 4 apps, and that of 3 groups of criteria were 5.4±4.4, 5.3±4.8, 7.3±3.2 and 4.9±4.4, respectively. As per our analysis, sport related apps had not fully integrated the mental health related concerns, while physical and psychological performances are critically interconnected [27,28]. This is surely a viable opportunity ready to be addressed by next generation app-developers.
We presented a dot plot to exhibit the market trend and potential opportunities for improvements. Here, we plotted the differences between the performance scores of individual app groups from that of the entire market. Technically, if any appgroup’s performance were like that of the entire market, the relative score plotted in y-axis would be zero. A negative relative score in any of 16 criteria would indicate that the app-group failed to meet the market standard. Contrastingly, a positive relative score in any of 16 criteria would indicate that the app-group performed better than the market average. In other words, the high performing app-group should be the benchmark of entire market. In total, there were 80 dots in this plot and average value of these dots were 0.5 with standard deviation 2.0. Following the independent precedence [29], the maximum and minimum ranges of these values were marked by average ± two times of the standard deviations, respectively. We postulated that those app-groups, which would follow the typical marker trend, should be clustered within the selected area: average ±2x standard deviation, and the outliers would be beyond these maximum and minimum ranges. Encouragingly, we found no app-group lower than average –2x standard deviation. Hence, we might interpret that none of these five app-groups had any major drawbacks. However, we found at least three dots beyond the average +2x standard deviation. The app-groups, namely diet apps, hydration apps and mental health apps emerged as outliers in three criteria under output readiness, namely diet, hydration, and mental health, respectively. Clearly, these app-groups were the market leaders of their respective performance metrics and thereby set the benchmarks for respective criteria. Three additional app-groups were nearly outliers in three different criteria. The mental healthapp groups scored very differently from rest of the market in the sleep/rest question, which further emphasized market’s unmet scope to integrate various aspects of mental health including the sleep/rest aspects.


Our analysis was limited by the sample size. We curated apps from various independent sources and prepared the list in an unbiased manner; nevertheless, it was not an all-comprehensive list. Furthermore, the rate of proliferation of new apps in the market is rather extraordinary, which frequently shifts the market dynamics. To maintain our neutrality, we refrained ourselves to use any of these apps, but trusted the app’s own promotional texts and app-validated public documents. Overall, our objective was to undertake a systematic and unbiased evaluation of this app market. Our analysis showed that the current market presents an opportunity for improvement in the form of a comprehensive mobile app that can simultaneously enrich the psychophysiological health. At present, at least 2-3 apps are needed to get such comprehensive service and an effective replacement of these apps by a single app would be a paradigm shift for this market.
To Know more about Physical Fitness, Medicine & Treatment in Sports
Click here: https://juniperpublishers.com/index.php


No comments:
Post a Comment