Oceanography & Fisheries - Juniper Publishers
Abstract
The concentration of chlorophyll-a (Chl-a) is influenced by the impact of El-Nino southern oscillation in Bay of Bengal sea water. In this study using data, monthly mean chlorophyll data derived from the sea-viewing Wild of view-sensor, the sea surface temperature is derived from the National Oceanic and Atmospheric Administration Advanced Very High-Resolution Radiometer, satellite derived monthly wind data is derived from the using CCMP, satellite altimeter sea surface height anomaly data derived from the TOPEX and the monthly mean mixed layer depth is taken from the Argo gridded data. The study period in this study is 1980-2017 (January-December) were analyzed the provincial nature of the ENSO linked with the above parameters. This satellite derived ocean data was used to identify the variability of the chlorophyll-a in Bay of Bengal associated with the ENSO. The witness of the Bay of Bengal is varied and response of climate modes due to El-Nino southern oscillation. These changing climate models have been impacting and influence the chlorophyll productivity in Bay of Bengal waters. Keeping in this view this study attempts to analyze the chlorophyll activity during the strong El-Nino years (1993, 1988, 1992, 1998, 2010, 2016) and strong La-Nina years (1989, 1999, 2000, 2008) in Bay of Bengal. In this study we must choose six provinces and observed that the variability and response of chlorophyll variability in Bay of Bengal during with peak El-Nino years (2010&2016) and La-Nina years (2008&2011) in Bay of Bengal. The relation between sea surface temperature and Chl-a indicates that, during peak El-Nino years the low Chl-a concentration were observed due to down-welling process. The high Chl-a concentration (0.15mg/m3) were observed during peak La-Nina years in Bay of Bengal. The variability of the chlorophyll concentration is used to understand and improve the climate mode at different provinces in Bay of Bengal during ENSO time.
Keywords: Sea surface temperature; Stability; Sea surface height; Mixed layer; Chlorophyll-a
Introduction
The Bay of Bengal is the northeastern part of the Indian Ocean and it is bounded on the northwest by India at around 220 N. It has a large marine ecosystem and several distinguishing features. Many rivers entering the Bay of Bengal. It is a unique and dynamic area of the study. The strongest south westerly summer monsoon winds occur during June-September. These winds bring more moisture and maritime air mass, weak winter monsoon winds occur from north-east direction during November-February. These weaker winds produce a shallow mixed layer depth owing to poor vertical mixing and bring dry and continental air mass into the Bay of Bengal, as the result this basin is less productivity compared to the Arabian Sea. Large amount of fresh water entering with reversal of the semi-annual monsoon winds and excess precipitation over evaporation strongly influence on the surface circulation and stratification [1-3]. This stratification may resident transport nutrients from deep to surface layer and make a strongly oligotrophic region during summer, fall inter-monsoon, when the surface water is highly stratified. As the result, the mean surface practical salinity scale ranges from 30ppt in north to 34ppt towards the south.
Maximum amount of phytoplankton productivity in the form of plants and animals in coastal shallow waters are attributing to develop the nutrients. The phytoplankton productivity influences the color on the sea. It is well understood that the chlorophyll-a, the photosynthetic pigmentation in phytoplankton, absorbs more blue and red light than green. The back scattered sunlight in the spectrum or color of the ocean water progressively shifts from deep blue to green as increases the concentration of phytoplankton. The result of the upwelling in the Bay of Bengal is confined to regions very close to the coast mostly within about 40km along the south-western boundary during summer [4-15]. The kind of upwelling that is favored during south-westerly wind is the equator ward flow of a freshwater plume, which could overwhelm the offshore Ekman transport.
The primary atmospheric and oceanic variables linked to productivity are chlorophyll, sea surface temperature, sea surface height, wind and so on. These physical factors are influenced directly are indirectly by the Indian ENSO and it is impact on the climate change. This abnormal warming of sea surface waters of the pacific coast of Ecuador and Peru around Christmas time and usually lasts for few weeks to few months. Climatologically, during the period of El-Nino bring and heavy rains to the equatorial coast of the South America, California, Ecuador and Gulf of Mexico, these effects of warmer water had a devastating the marine life, because there is no upwelling. And severe droughts occur in Australia, Indonesia, India, and South Africa. In ENSO time, an upwelling propagates along the coast of Bay of Bengal, it may also influence the chlorophyll concentration on the inter-annual time scale. In this study has made use of sea-wife’s data during the period of 1997-2010, NOAA-AVHRR derived sea surface temperature data, CCMP surface wind vector data and sea surface height anomaly from TOPEX data sets to understand the variability of chlorophyll and water circulation pattern as well as the associated with temporal and spatial variability of phytoplankton covering the entire Bay of Bengal basin. The major goals of this study are 1) to quantify the impact of the chlorophyll concentration on above parameters 2) To investigate the changes in chlorophyll concentration in the Bay of Bengal during ENSO time.
Data and Methodology
Ocean colour
In the process of Bay of Bengal studies used to various data sets to understand the ocean chlorophyll response to ENSO events. In this study, monthly mean, and climatology of Sea-Wifs chlorophyll data covering the period from October 19997 to December 2010 and June 1998 to December 2010 data for 13 individual years have been used http://apdrc.soest.hawaii.edu/. Moderate Resolution Imaging Spectro radiometer play important role in the development of validated, global, interactive earth system models able to predict global change accurately enough to assist policy makers in making sound decisions concerning the protection of our environment and these data improve our understanding of global dynamics and processes occurring on the land, in the oceans and lower atmosphere. The satellite data were selected in such a way that the field sampling period was covered in the monthly mean satellite data. Monthly climatology of MODIES data has been prepared using from July 2002 to 2017 July (http://oceanwatch.pifsc.noaa.gov/thredds/dodsC/aqua/ monthly).
Sea Surface Temperature
The optimum interpolation sea surface temperature (OISST) analysis is produced monthly on a one-degree grid and this simulation is uses in-situ and satellite addition and simulated sea surface temperatures. NOAA OISST data has been using from 1982-2017 (https://www.esrl.noaa.gov). And SST data has taken from COBE 1x1 degree latitude of global grid (360x180). The advantage of these present analyses and understanding the reliability of SST for a specific area and time. The monthly mean SST data taken from COBE sst2 data from 1850 Jan to 2015 Dec. Another model data set is also taken as soda (simple ocean data assimilation) SODA v2.2.4 Monthly means from 1980-2015. And include Argo (Argo 1x1 gridded Monthly mean on Standard Levels) monthly mean data from 2005 Jan-2017 Dec.
Sea surface winds
We also used satellite derived monthly v2 CCMP wind data at 10 meters, these Level-3.5 (L3.5) winds are available as netCDF-4 data files. Each L3.5 monthly data file contains 2 arrays of size 1440 (longitude) by 628 (latitude for range -78.375 to 78.375) by 1 (time centered on the middle of calendar month). The two arrays are the U and V wind components in m/s. Standard wind coordinates apply, meaning of a wind blowing toward the Northeast has a positive U is the right and V components is above the axis. Winds in the CCMP product are of oceanographic convention. The CCMP Version 2.0 (V2) data product described here is a continuation of the highly used original CCMP product (V1.1 available from NASA JPL PO. DAAC and builds on the decades of careful VAM development. The data is taken from 1987 July to 2016 (http://apdrc.soest.hawaii.edu).
Sea surface height
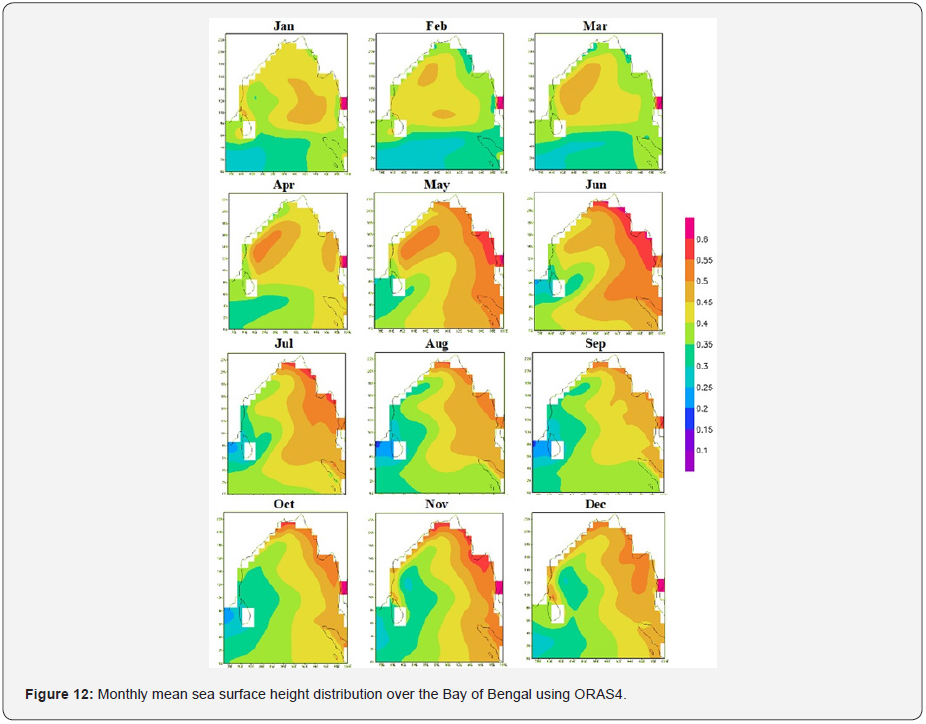
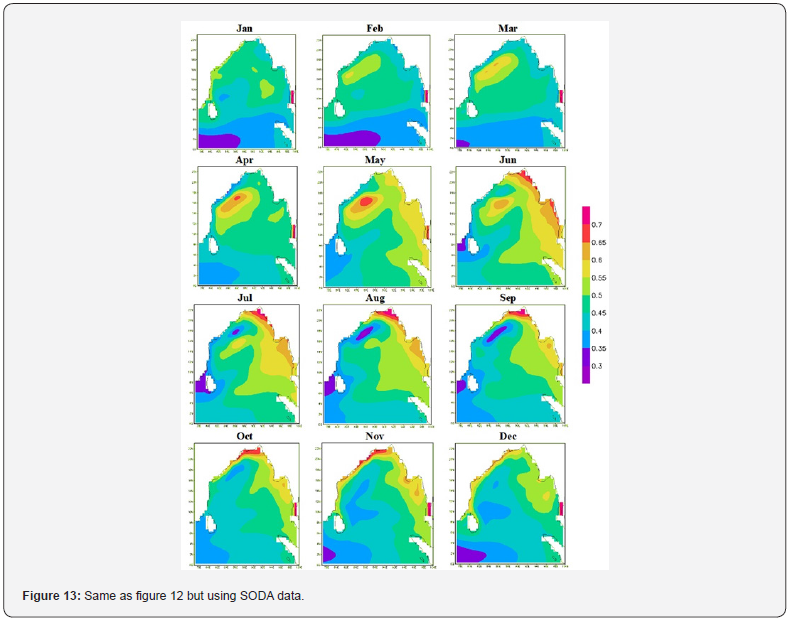
Mapping of Sea Level Height Anomaly became possible after the availability of satellite altimeter data. The SSHA data of the area acquired from TOPEX database were also studied for their relationship with the chlorophyll-a plume. The Spatial-temporal variation of the plume was further studied using sea surface height data from 1993 to 2010. These data received from reanalysis ECMWF ocean reanalysis ORAS4, 1x1-degree from 1958 Jan to 2017 Dec, (http://apdrc.soest.hawaii.edu). And sea level model data id received from SODA v2.2.4 monthly means from 1871 Jan to 2010. (http://apdrc.soest.hawaii.edu).
Argo Profile data
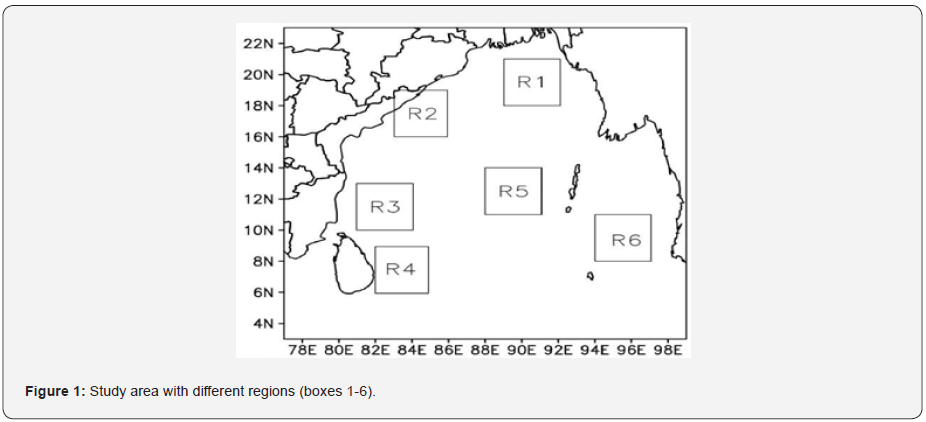
The Argo mixed layer depth is taken from Argo 1x1 gridded Mixed Layer Monthly mean from 2005 to 2017 (http://apdrc. soest.hawaii.edu/). We are also calculated density and static stability using Argo data. We choose six regions in Bay of Bengal (Figure 1). They are 1) Head Bay of Bengal (18°-21°N; 88-91°E), off Chennai (10°-13°N; 81°-84°E), 3) off coastal Andhra Pradesh (16°-19°N; 84°-87°E), 4) off Myanmar (8°-11°N; 94°-97°E), 5) central Bay of Bengal (11°-14°N; 88°-91°E), 6) off Tuticorin (5°- 8°N; longitude 77.2°-79.8°E). The present study is planned to evaluate the current understanding of chl-a, SST and to link with El Niño (warm), La Niña (cool) events. The Oceanic Nino Index is used to define El Nino (+0.5) and La Nina (-0.5).
Results
Sea surface temperature (SST)

The monthly SST (January-December) ranges were estimated during 1982-2017. The monthly mean SST of 35 years indicates the SST values changes and the highest SST value (30.2°C) occurs during May and June months in the Bay of Bengal. The lowest SST value (23°C) occurs during Jan, Feb, March months at head Bay of Bengal. The sea surface temperature is decrease during Jan, Feb, March months. And slowly increases in the month of April and it reaches minimum value during May, June months, normal in Aug, fall at central Bay of Bengal in Sep, Oct months and slowly decreases in the month of December at Bay of Bengal. (Figure 2).
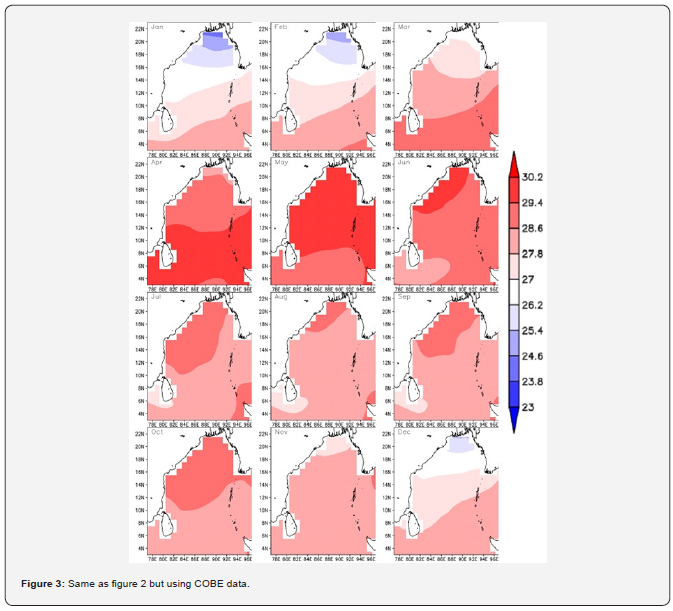
The monthly average sea surface temperature value is taken for 1850-2015 years. The minimum (23°C) values occur during January month at head Bay of Bengal. The maximum value (30.2°C) occurs during April, May months the SST range between (28.6°C-30.2°C) in Bay of Bengal. In Jan, Feb months has lowest(23°C) values, in May, June months the SST is intensifies, the highest SST during May month, and the SST value is slowly decreasing at head bob and along the Chennai coast to Myanmar during July-Oct(27.8°C), finally the value is decreases (23.8°C) during Nov-December months. (Figure 3).
The in-situ monthly average sea surface temperature ranges were estimated during 2005-2017 approximately 12 years. The highest (30.2°C) value during May month in the entire Bay of Bengal. The lowest (25.4°C) value occurs during January and February months at head Bay of Bengal. The SST values are decreases in the months of Jan-Feb the range from (25.4°C-28.6°C) this value is highly intensifying and reach peak point (27°C-30.2°C) during Mar-June months. It is normal (27.8°C) than Mar-June months during July-Oct months. In November-December months the SST value is slowly decreases from south-north in Bay of Bengal. (Figure 4).

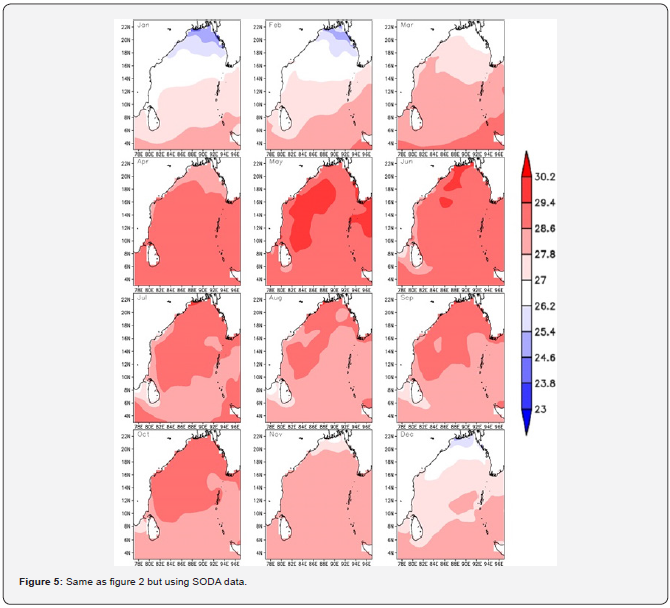
The monthly mean sea surface temperatures were estimated during the years 1871-2010. In these years, the lowest (23.8°C) value occurs during the months January and February months at head Bay of Bengal. It is highest (29.4°C-30.2°C) occurs during in the month of May along the 8°-20°N latitude, decrease during Dec, Jan, Feb months. The SST is slowly increase (27°C-28.6°C) during March, April months. In May month this is very high (30.2°C) along the head bob to Tamilnadu and June month also have high temperature at head bob. (Figure 5).
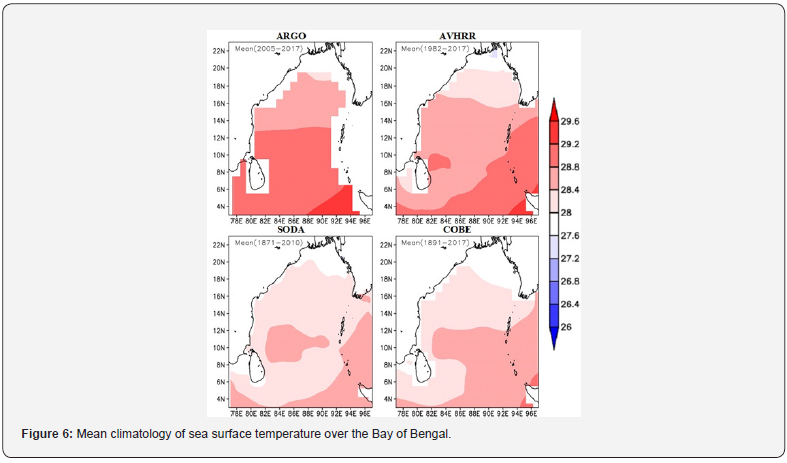
Another remain months July-Oct months the SST value is slowly decrease (28.6°C-27°C) and Nov-Dec months also decreases (27.8°C-25.4°C) along the head Bay of Bengal. This indicates the occurrence of upwelling along the coastal waters and the convection of bottom water to the surface. The coastal upwelling along the western boundary of BoB has been reported during pre-southwest monsoon and southwest monsoon. The mean climatology of sea surface temperature from overall data the SST value is minimum (27.6°C) at north-west part, Dec-Feb months, and maximum value (29.60c) at the south-east part of Bay of Bengal during April, May months. (Figure 6).
Chlorophyll
The monthly mean (Jan-Dec) chlorophyll-blooms were estimated using 2002-2017 years data in Bay of Bengal (Figure 7). The minimum chlorophyll concentration observed during January month along coastal regions. The Chl-a bloom maximum in the months of June-Aug at 80N-800E, head Bay of Bengal and Myanmar coastal regions and it is also intensified during May month in Bay of Bengal, attained bloom peak in most regions of the80N-800E and along the coastal regions during June-Aug months. In September month this concentration is diminished. During October it is increases small peak at head bay and Myanmar regions. After the onset of winter during November- December months gradually fallen at coastal regions along northeastern the Bay of Bengal. During January-February months the chl-a intensity decreases.
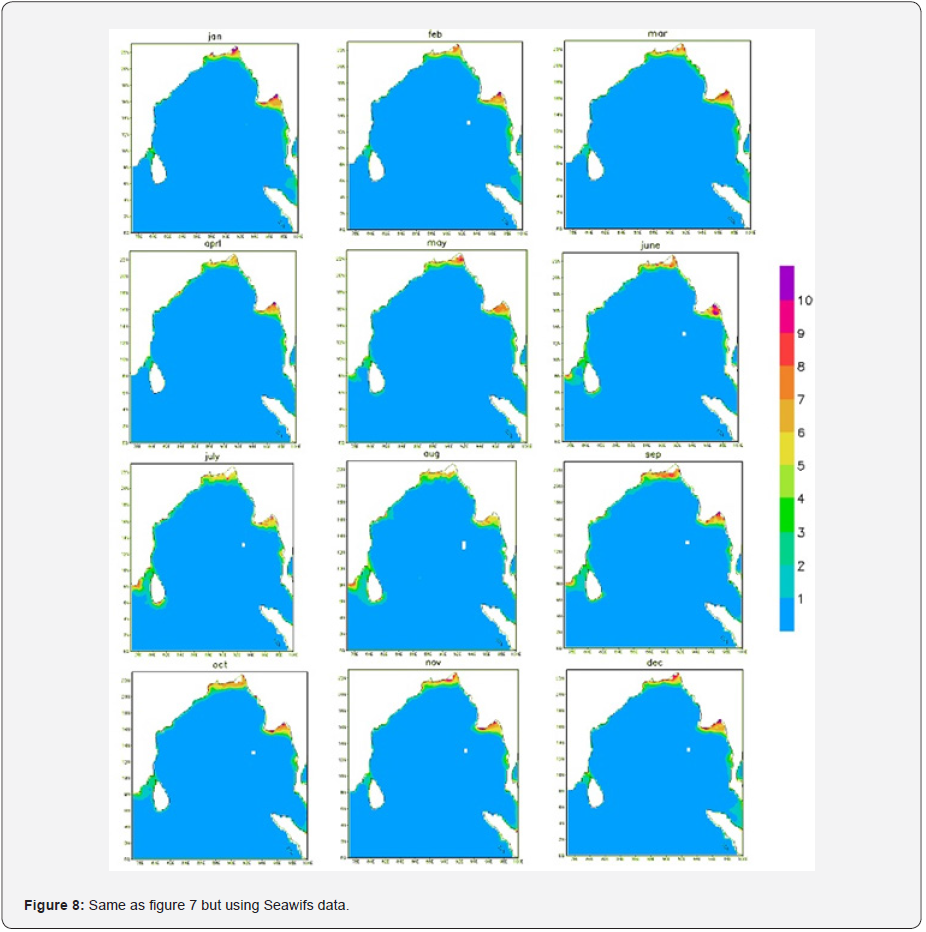
The monthly mean chlorophyll concentration can estimate using 1997-2010 years data, approximately 13 years (Figure 8). Chlorophyll value in the Bay of Bengal is minimum (8 mg/m^3) in the months of April, June and august at coastal regions. The maximum (12 mg/m^3) chlorophyll concentration occur during June, November, and December. In the month of January, February, and March the chl-a concentration is slowly increased and March, similar value (10 mg/m^3) September months. The concentration of chlorophyll was gradually weakened during October month at north- east regions in Bay of Bengal. We can observe high chlorophyll concentration near coastal regions compare to the offshore regions. MODIS and Sea-WiFS chlorophyll-a image show that there is a phytoplankton bloom in the southwestern part of the bay during November–January.
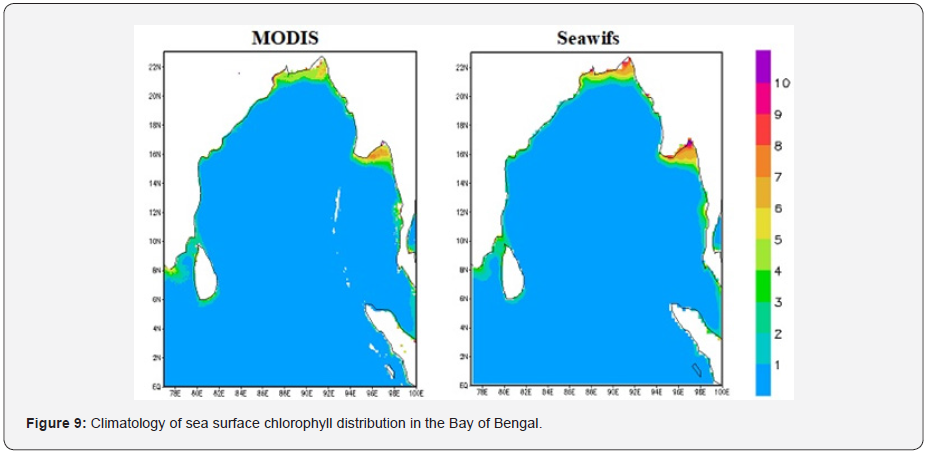
The chlorophyll bloom is varying from year to year. The monthly mean chlorophyll value was estimated from (Figure 9). In year it is peak (7 mg/m^3) at Myanmar coast and at head Bay of Bengal and normally diminished. From Seawifs data suggested that the year average value is peak (9-10 mg/m^3) at head bay and Myanmar coastal regions in Bay of Bengal. Along the coastal regions the chlorophyll concentration is low. The river water enriched with terrestrial sediment in a coastal region, while a bloom is associated with high concentration of chlorophyll associated with phytoplankton biomass. Along the east coast of India, plumes are common during the south-west monsoon from June to September around river mouths, while phytoplankton blooms have been reported in coastal waters during the northeast monsoon; recently, blooms of phytoplankton during the boreal winter have been reported in the north –western Bay of Bengal.
Sea surface wind
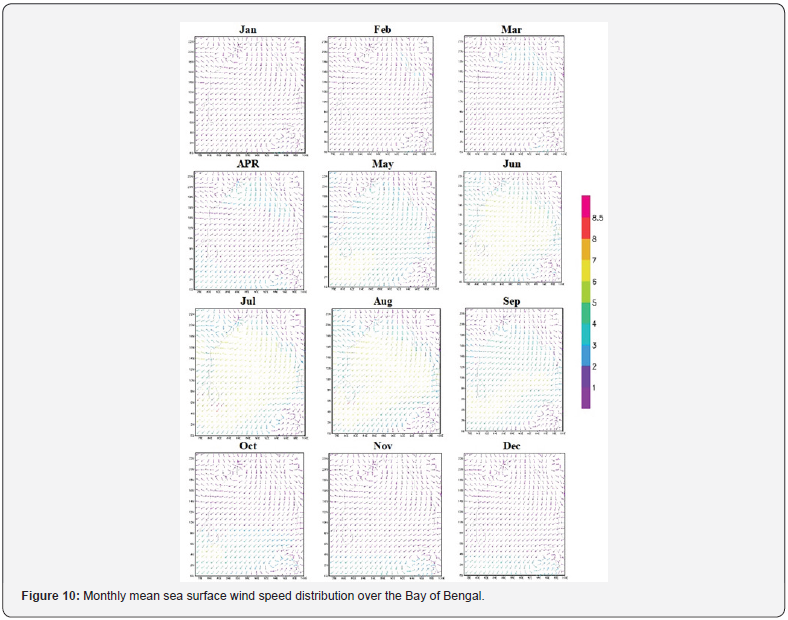
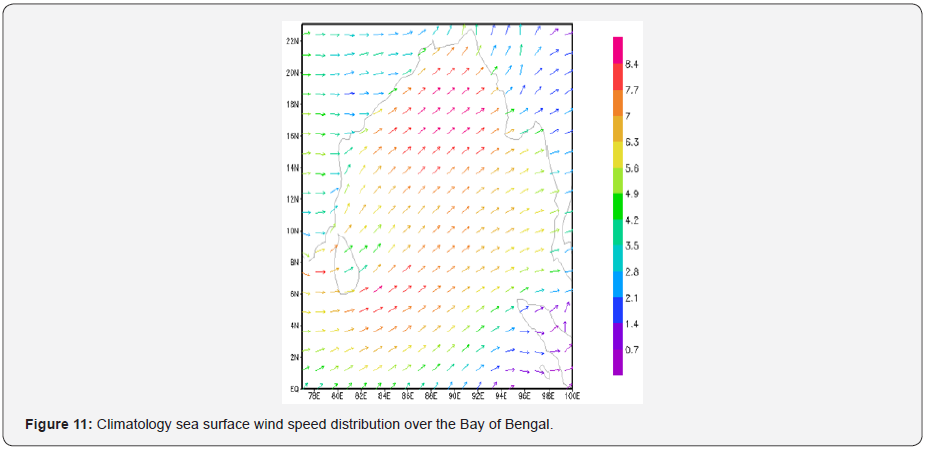
The monthly average zonal and meridional winds are estimated from 1987-2016 years data (Figure 10). The wind is Minimum during January month and it moves north southward in Bay of Bengal. Maximum winds occur in the months of June and July at south part and it is slowly intensified during Feb, Mar, and April months at head bay and bottom at southern part in Bay of Bengal. During May month these winds are more intensified and reaches its highest values during June-Aug months along the 4°- 8°N latitude, because of the south west monsoon is started. Mean climatology shows maximum wind speed is observed between 17 – 20°N latitude (Figure 11).
Sea surface height
The monthly mean sea surface height was taken from during 1958-2017 years in Bay of Bengal (Figure 12). The minimum (0.4m) sea surface height during the month of March and maximum value (0.6m) in June along the head Bay of Bengal to Myanmar coastal region in the Bay of Bengal. In April, it is started increase (0.3-0.5m) the range between at west coastal region of the Bay of Bengal. And it is increases and extended towards north eastern part during May month. It is high in June and July, during Aug-Oct months, this value is gradually decreasing at head bay and Myanmar regions compare to the June-July months. In November, the value is increase at Myanmar coast in BoB.
During Dec-Feb months the SSHA value is decrease along the north-east to central Bay of Bengal. The monthly mean sea level was taken from TO3PEX during the years of 1993-2010 approximately 17 years data in Bay of Bengal (Figure 13). The low value (0.5m) is occurring at central Bay of Bengal during in the month of January. And the high (0.7m) value is form in May at the region is north-west part (off Andhra Pradesh) of the Bay of Bengal. It is slowly increasing during Feb and March months at north-west of bob. And this increment is gradually increase in April and it reaches highest value during May at north-west part and it extends towards north-east part of the Bay of Bengal.

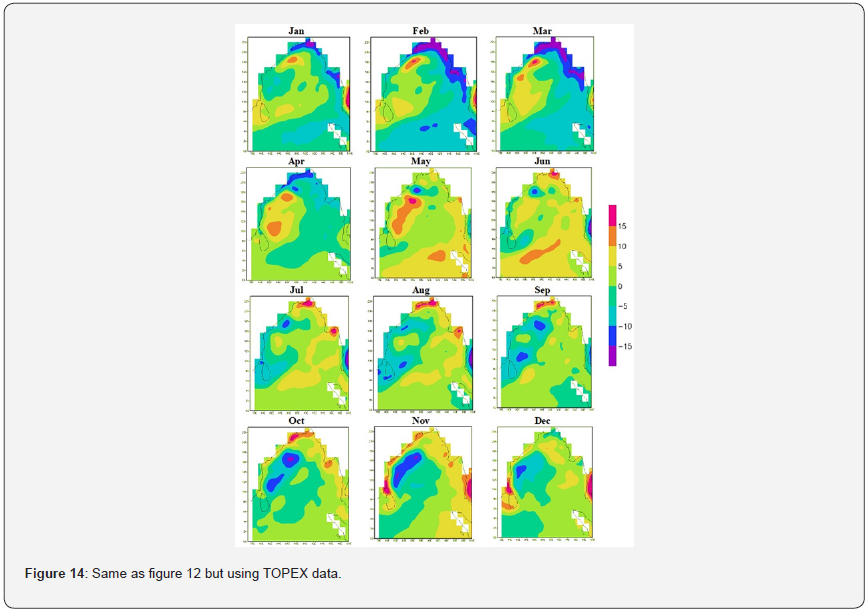
In June-Sep months this value is height at head Bay of Bengal and remain part (north-east) are started decreases; very low value is forms at north-west part. During Oct-Nov months this value is high, and this increment is extending towards westward region, during December the SSHA value is decreases along the coastal regions in Bay of Bengal. The monthly average sea surface height anomaly (cm) was estimated using TOPEX data from 1993-2010 years (Figure 14).
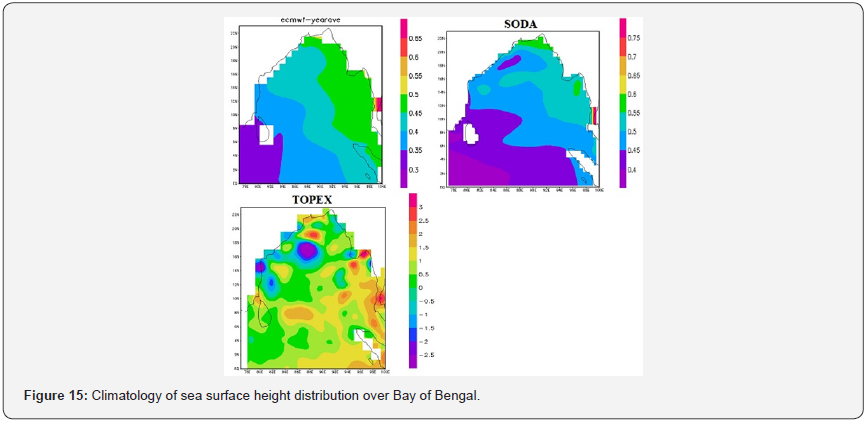
The minimum sea surface height anomaly is founded as during the month January (10cm) at North part of the Bay of Bengal and the maximum (15cm) is found near the regions of head bay and Myanmar coast during the month of July. In February month the value is started to increase, and it is extending towards off Andhra Pradesh coast during the months of March and April in Bay of Bengal. In May month this value is more at off Andhra Pradesh and it is extending to Tamilnadu regions. During June-Aug and Oct months the value is increase at head bay and Myanmar regions in the Bay of Bengal, but in month of sep high only at head Bay of Bengal, in Nov-Dec months it is more at Tamilnadu region in Bay of Bengal. In the mean climatology warm core eddy and cold eddy is observed in the TOPEX data (Figure 15).
Mixed layer depth (MLD)
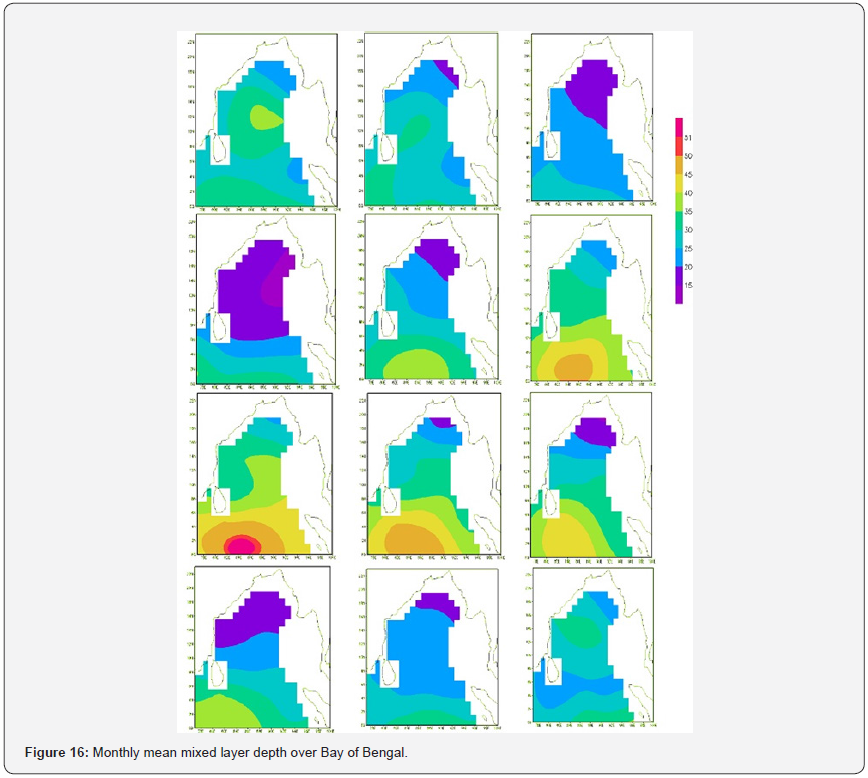
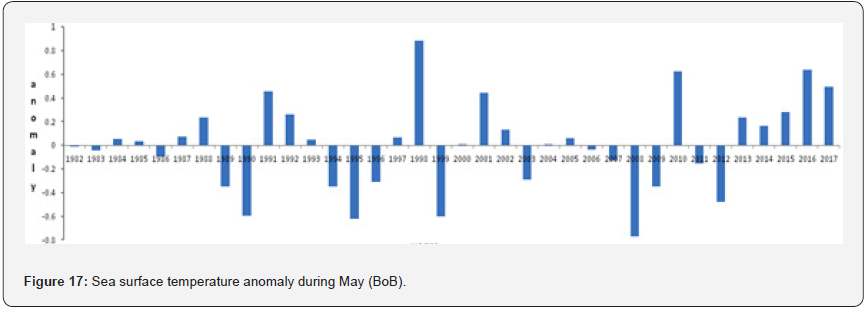
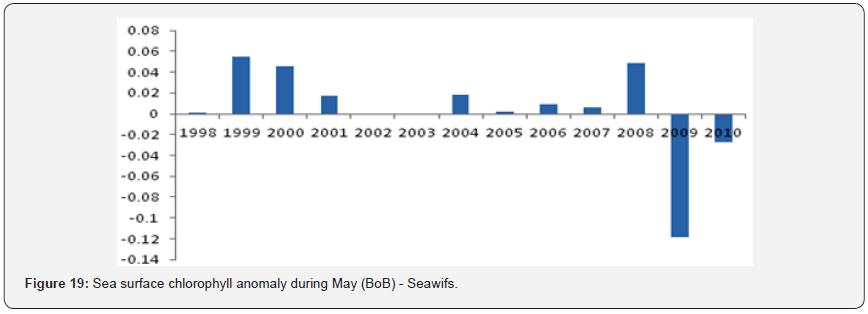
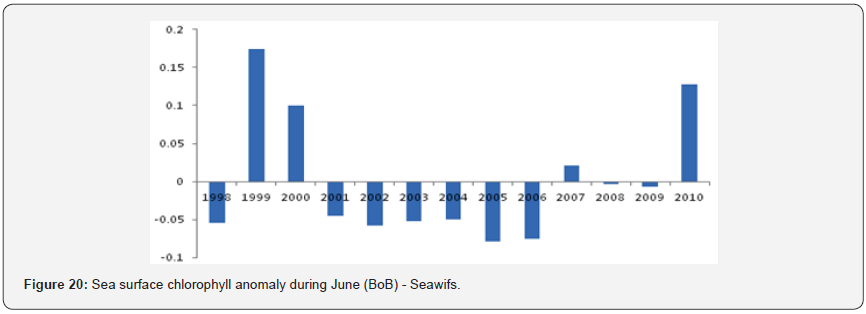
The mixed layer depth can be estimated from using 2005- 2017 years data approximately 12 years from Argo (Figure 16). The minimum depth (15m) occurs during the month of April at the region of central Bay of Bengal (BoB) and the maximum value (51m) occurs during July month at region of southern part and in Aug-Oct months the MLD value is gradually decreases at southern part of the BoB. During Nov month the MLD value is decrease and Dec- Feb months it starts increases. In March this is very less value. The MLD monthly mean is high at southern and this value is slowly decreasing along the northern part of the BoB. During El nino strong years (1993, 1988, 1992, 1998, 2010, 2016) the sea surface temperature anomaly reaches maximum during May 0.9°C and June 0.5°c in 1998 year because of 1998 is strong El nino year. At the same time the chlorophyll anomaly reaches 0.01 mg/m^3 in 1998 due to high sea surface temperature and less mixing (Figure 17,18). As the BoB is highly stratified, the observed response of Chl-a concentration is further understood using the water column static stability (Figure 19 & 20).
During El Nino (2010, 2016) upper 20 m depth the water column showed positive stability value (9 × 10⁻⁵ m-1), in sep month and then more negative (-1× 10⁻⁵ m-1) in June month particularly in 2016. In La-Nina years (1989, 1999, 2000, 2008, 2011) the temperature anomaly during May it reaches minimum -0.7°C, and -0.4°C in June at the same time the chlorophyll anomaly in may reaches positive anomaly (0.05 mg/m^3) in 2008. The SST is always proportional to the chlorophyll concentration. During La Nina time (2008 and 2011) upper 20m depth the water column showed positive value (12 × 10-5 m-1), in the month of Oct and then more negative (-3 × 10⁻⁵ m-1), in sep during 2011. The only difference is that the stability is more in la Nina period compare to the El Niño time in Bay of Bengal. We also analysed the role of horizontal advection of Chl-a by strong stability.
Our analysis showed that vertical advection contributes towards the Chl-a enhancement in both conditions. Stability El Niño and La Niña are among the most powerful phenomena on the Earth and dramatically impact weather patterns worldwide. Hence, there seems to be a lack in studies related to the variability of chl-a concentration, SSH, and the SST, particularly, in the Northern Indian Ocean related to these phenomena. The present study is planned to evaluate the current understanding of above parameters linked with El Niño, La Niña, events and focuses on how these phenomena have been linked and influencing these parameters variability and stability in the BoB.

Stability
El Nino period in Bay of Bengal the static stability is varies from depth during Jan-Dec months. The monthly mean static stability was estimated using 2005-2017 data with depth 0-200m in Bay of Bengal (Figure 21). Particularly we can draw plots for only use El Nino (2010-2016) and la Nina years (2008-2011) data. The stability is related to temperature, salinity, and density. El Nino time in January month the stability is increased 4.9x10⁻⁵ m-1 at a depth of 80m and slowly decreases at 1x10⁻⁵m-1 with 150 meters depth during 2010, the stability is decreases at surface -0.5x10⁻⁵ m-1 at 5 m depth and gradually increases up to 6.3x10⁻⁵ m-1 with 50 m depth, and again decreases with 150 m depth during 2016.
In February month the stability is increase at 4x10⁻⁵ m-1 with 50 m depth, after the stability is stable at 4.5 x10⁻⁵ m-1 with depth 50-75m, and this value is decreases at 1x10⁻⁵ m-1 with 150m depth during 2010. During 2016 the value is increases at 6x x10-5 m-1 with 80 m depth and decreases 1x10⁻⁵ at 150 m depth. In March month the stability value is increases at 5x x10-5 m-1 with 80 m depth, decreases at 1.5x x10-5 m-1 with 150 m. And same values to during 2016. In April month it is increases at 5.3x10⁻⁵ with 20m depth and decreases at 1.5x x10-5 m-1 with 110m depth during 2016, the stability is increases at 4.9x x10-5 m-1 with 80m, decreases at 1.2x10⁻⁵ with 150m depth during 2010. In May month it is increases at 4.7x x10-5 m-1 with 100m depth and decreases at 1.9x x10-5 m-1 at 150 m depth during 2010. During 2016 the stability is increases at 4.9x10⁻⁵ with 30m depth and decreases 1.2x x10-5 m-1 with 150 m depth.
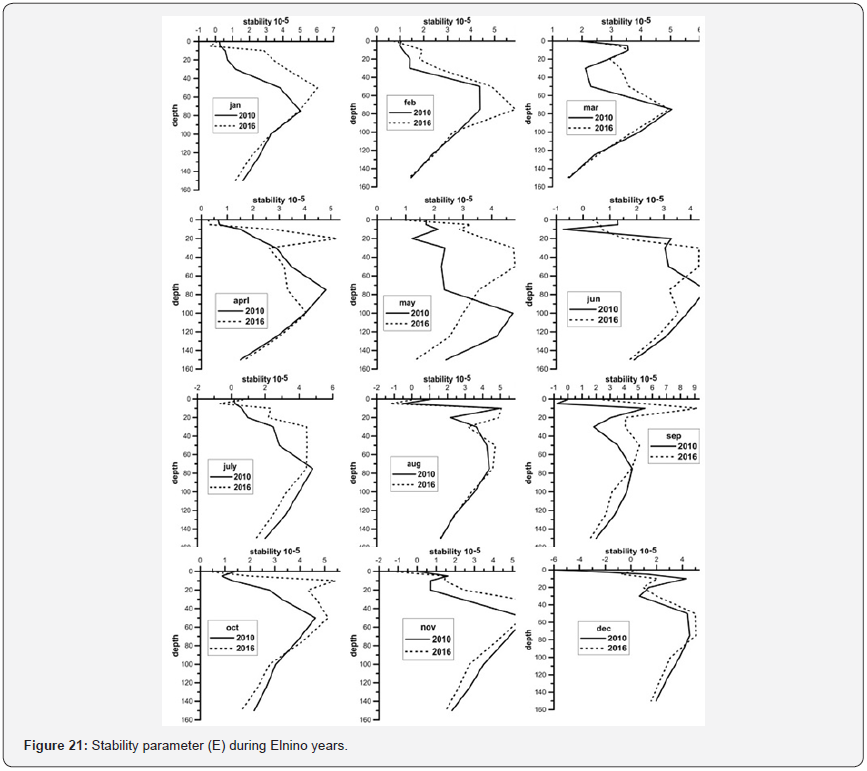
In June month the stability value is increase at 4.5x x10-5 m-1 with 80 m depth and decreases at surface the value is -1.2x x10-5 m-1 with 10m depth, at 150 m depth the stability is decrease 1.5x x10-5 m-1 during 2010, 2016 this value is increase at 4.2x x10-5 m-1 with 30m depth, decreases at 3x x10-5 m-1 with 150 m depth. During 2010 in the months of July-Dec the stability value is more at 5.5x x10-5 m-1 with 50 depths in the Nov month, less at -1.5x x10- 5 m-1 with 5 m depth in Aug month. During 2016 the high stability at 9x x10-5 m-1 with 10m depth in sep month and less -1.5x x10- 5 m-1 with 5 m depth. La-Nina time-In Sep month the stability is very high at 9x10⁻⁵ with 10 m depth in Sep month decreases at 1x x10-5 m-1 with 150m depth in Sep month during 2008; in 2011 this value is high at 12x x10-5 m-1 with 5m depth in Oct month and low at -1x10⁻⁵ with 150 m depth in September month (Figure 22).

Conclusion
The study concludes that the monthly and annual mean chlorophyll, sea surface temperature, sea surface height, winds and mixed layer depth have been observed to the SST value is inversely proportional to the chlorophyll, in El-Nino condition (1983, 1988, 1992, 1998, 2010, 2016) the SST value is high, and the chlorophyll value is low, at the same time the stability is very less at 10m depth in June month during 2010.
In La-Nina condition (1989, 1999, 2000, 2008, 2011) the sst value is low and the chlorophyll value is high particularly in May, June months and stability are positive at 10m depth in 2008. Winds and chlorophyll value are directly proportional. The multiple regression results indicated that ssha was more dependent on SST followed by chl-a during the phenomenon years, as observed from this study.
Hence, a decreasing trend in the chl-a concentration due to warmer SST and high SSHa caused major impacts on the ocean primary productivity and probable consequences on diminishing the marine resources as observed with the time series annual trend. El Niño caused the down-welling process, which leads to the low chl-a concentration (< 1 mg/m3) in the BoB. La Niña caused the upwelling process, which leads to a high chl-a concentration (> 15 mg/m3) in the BoB. Analysis of the other phenomena involved in variation of the SSHA, SST, and low chl-a concentration in the BoB would be required in future studies.
To Know more about Oceanography & Fisheries
Click here: https://juniperpublishers.com/index.php


No comments:
Post a Comment