Engineering Technology Open Access Journal - Juniper Publishers
Abstract
Here, we demonstrate a novel procedure for generating reliability evaluations in device aging tests run very close to operation conditions. Packaged devices are aged in multiple temperature and frequency modes. Device elements that show early degradation are isolated to generate accurate mean failure times. A correlation between ring oscillator (RO) circuit size and β slopes of Weibull failure distributions are used to indicate the confidence level of the data. Via shaping of the distributions, the aging information is successfully separated from the system noise. The technique is proven to be effective for device reliability testing and suitable for device health monitoring.
Keywords: FPGA; RO; FinFET; BTI; Weibull failure distributions
Introduction
The formula for success in microelectronic reliability testing is to deliver precise failure estimations within time-to-market constraints [1]. To obtain results quickly, tests are accelerated by means of stressors such as voltage, current and temperature. In testing methods such as the High-temperature operating life (HTOL) method, the stress levels induced are far beyond operation conditions [2]. Results are received quickly, but the credibility of the results are low because of concern of physical variation of the device due to the stress. Alternatively, low stress tests must be very long to receive results discernible from noise.
In this study, a novel technique for low stress testing is proposed based on the Multi-Temperature Operational Life (MTOL) testing method [3]. The method is implemented with 200 hour device aging tests using variable voltage frequency and temperature stress conditions. Here, stress conditions are chosen that virtually match operation conditions. The objective is to show that sufficient degradation data is received to generate an accurate reliability assessment.
FPGA devices are programmed with multi-sized RO circuits to provide degradation data on a large range of frequencies. The results received allow the separation of failure mechanisms: BTI, EM and HCI as is detailed in previous studies [4,5].
Application of the MTOL method on low stress tests successfully generates lifetime data congruent with data received from tests in extreme stress conditions. Such a procedure is advantageous in reliability testing because it ensures preservation of the physical characteristics of the device. The methodology can also be principle in designing an embedded sensory module because it is effective in regular use conditions.
Experimental Results
A series of tests with variable temperature stresses and a nominal voltage of 0.85 V were run on Ultra96 boards using 16nm FinFET technology [6]. Since the chip was programmed with rings of variable sizes, data was generated over a large range of frequencies. Device failure times were obtained by finding the slope of the degradation using the appropriate time power law and extrapolating to a performance decrease of 10%. The data acquired in variable stress modes and frequencies provided an ideal basis for revealing and separating the dominant failure mechanisms in the chip.
We demonstrated in previous studies that the amount of dispersion of the time-to-failure (TTF) values directly corresponds to number of stages in the ring circuits [7]. When the TTF values are set to a ring frequency plot, the data in low frequencies conserves a tight pattern and fans out in the higher frequency rings (Figure 1). In any case, even the small rings with the most dispersed TTF values retain a high level of determinism. The interaction between the stages in a ring cause the circuit to show characteristics of a parallel failure system. The propagation delay of the stages averages together to generate the frequency of the ring. As the size of the ring increases, the TTF value of the circuit becomes more precise based on the central limit theorem. The Weibull distribution is commonly used for analysing diverse types of aging phenomenon (Eq. 1 below).

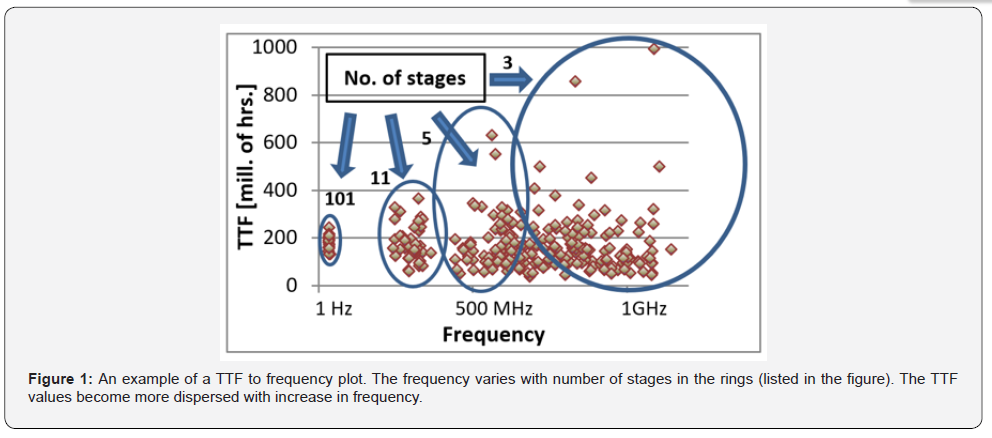
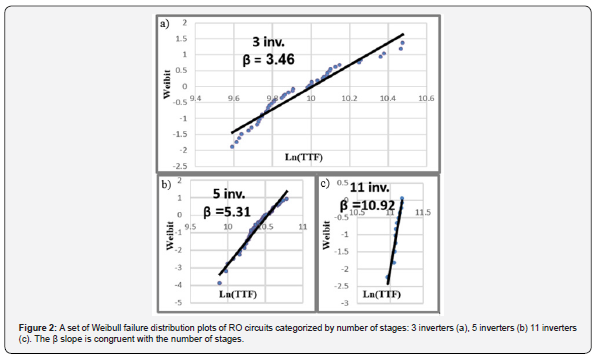
Figure 2 is a collection of Weibull distributions of 3, 5, and 11 rings. Each plot consists of the TTF values of many same-sized RO circuits running in parallel. The gradient of the β slope shows the level of determinism of the of the failure times in a Weibull distribution. A clear one-to-one correlation between the number of stages in the rings to the β slope appears. Comparable results formulate for different stress modes and technologies.
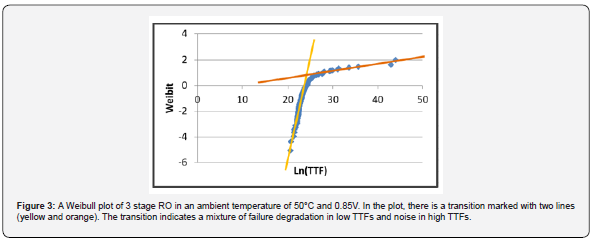
When we analysed the data of the low stress tests, we received unexpected results. Neither did the data fit to a Weibull distribution nor the slope resemble that of other tests. The data also did not fit to a lognormal distribution implying that the data is not random. Figure 3 displays a Weibull distribution of 3 stage rings from a test at an ambient temperature of 50°C. The plot has a distinct transition in the place where two symbolic lines (highlighted in the figure) cross. When the portion of the plot marked by the yellow line is measured separately on a Weibull distribution, a β slope of 3.004 is received. When the data hooking to the right is formulated into a separate Weibull distribution, it has a slope below one (β < 1) suggesting totally random events. Such a distribution would be expected for noise.
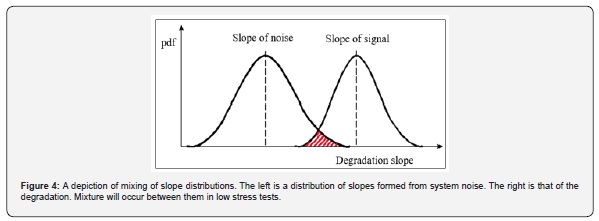
Since the tests are under low stress, the outcome is easily explained. The TTF is figured from the slope of frequency degradation. When the slope is too slight, the degradation signal is indiscernible from the noise of the system. Figure 4 explains the data of the tests. The rate of degradation for each element is random. The early failures produce steeper slopes which will create the right side of the bell “Slope of signal” distribution. As the slopes ease off, they will mix with the “Slope of noise” distribution. Therefore, a process for filtering the data is to calculate the early failure times until the point of transition. The data beyond this point does not contribute information to the failure trend.
We found that the Weibull slopes of the early failure data are comparable to those calculated from high stress tests. This validates that the early failures are an authentic part of the signal. Basing a failure trend from the early failures is acceptable since the Weibull distribution is a weakest-link type distribution. The early failures are a prediction of the later failures [8]. Therefore, it is sufficient to observe the early failures to see the trend of the system. The mean time-to-fail (MTTF) value or θ is the zero point of the Weibull plot. Since we have actual TTF measurements with their Weibull characteristics, each test reveals the reliability distribution function of the device for that specific stress condition.
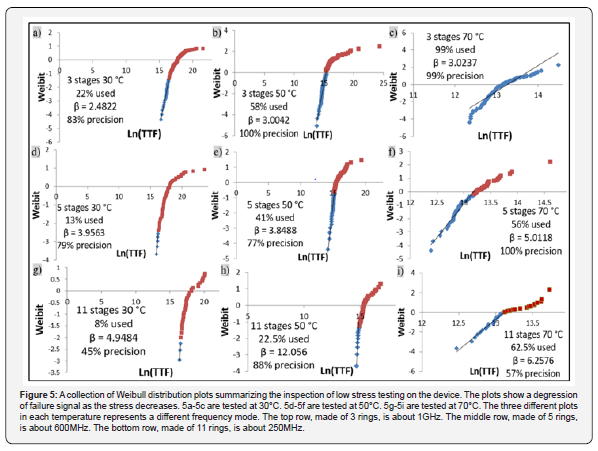
The results of 3 tests in ambient temperatures of 30°C, 50°C, and 70°C are analysed in 3 different frequency ranges, from 250MHz up to 1GHz. The ranges of the frequencies are chosen by number of stages in the circuit: 3, 5, and 11. The results of the analysis are displayed in Figure 5 on the next page. The plots show a distinct transition between higher stress results compared to lower stress results. Highest frequency and highest ambient temperature test is shown in 5c. In this plot, there is a characteristic Weibull distribution for all the data. As the stress diminishes, the left direction for frequency decrease (5a and 5b) and downward for temperature decrease (5f and 5i), there is a consistent increase in distortion to the Weibull slope. This is visible both in the shape of the plot and clear from the β slope which decreases continuously. The percentage of data used to find the β slope is listed in each plot. As the stress decreases, both the percentage used and the precision decreases. This fortifies the premise mentioned earlier that, as the stress of the test is lowered, the noise in the results is more visible in the data. Correction of the data by excluding longer failure times is less effective with the decrease in stress. In any case, the results obtained by filtering out non-fitting parts of the plot show a high level of accuracy. The outcome shows frequency dependence as is seen that the MTTF is shorter in the higher frequencies. The results of the test well within the range of values received in the high temperature voltage and frequency stress tests run in previous studies [5].
Conclusion
We have demonstrated how it is possible to generate failure times from reliability testing that is virtually at operation conditions. We succeeded in producing failure data that, is discernable although there is a non-negligible amount of noise. By use of a novel filtering procedure, we succeeded in filtering the failure data from the noise using Weibull distribution analysis. The results are congruent with testing operated in higher stress. This verifies that the method is effective in these low stress conditions.
To Know more about Engineering Technology Open Access Journal
Click here: https://juniperpublishers.com/index.php


No comments:
Post a Comment