Juniper Online Journal Material Science - Juniper Publishers
Abstract
This study deals with the investigation for preparation of conductive glass / thymol blue TB sensor electrode by spin coating of the thymol blue (TB) indicator on conductive glass formed from F-SnO2, and it’s using as indicator electrode in potentiometric acid-base titration in aqueous solution at 298K. The change of the open circuit potential with pH (E-pH) curve is linear with slope of 0.052V/dec at 298K. The standard potential of the above electrode E0, was determined with respect to the SCE as reference electrode. The recovery percentage for potentiometric acid-base titration using G/TB as indicator electrode was calculated.
Keywords: Potentiometry; Thymol blue; Sensor; Conducting glass; Titration; Indicator electrode
Introduction
Chemical sensors are devices that convert the concentration of target compounds into an analytical signal. The term analytical implies the concept of measurability. Then a chemical sensor converts the information about the presence of target compounds into a measurable quantity [1]. Chemical sensors play a big role in checking the environment we live in, contributing information on industrial production processes, quality management of food stuffs and beverages, detection and analysis of some ions and many other applications [2]. Transparent conducting oxides possess a unique combination of optical transparency and metallic conductivity in a single material. Their properties are widely exploited in a host of energy, optical, and electrical applications [3-5]. SnO2 is a wide band-gap semiconductor with a band gap of 3.6eV and was the first transparent conducting oxides to receive significant commercialization. It exhibits good transparency and can be easily n-type doped. Degenerate carrier densities can be achieved by doping with fluorine [6,7]. Potentiometric titrations are the basic chemistry laboratory technique for the quantitative analysis of substances with unknown concentrations using standard solutions of known concentration. The substance with unknown concentration and the standard solution are termed analyte and titrant respectively [8]. This method widely used in different fields such as the food industry, scientific research, and chemical, clinical and pharmaceutical laboratories. Titrimetric procedures based on a detection of the endpoint, i.e., the point at which volumetric titration is completed, are successfully employed over a wide range of concentrations and are popular because of their simplicity, speed, accuracy and good reproducibility [9]. Recently, many studies developed some types of electrodes in potentiometric acid base titration [10-13]. Thymol blue (thymolsulphonephthalein) is used as a pH indicator. A solution of thymol blue exhibits three form (red color), Neutral form (yellow color) and basic form (blue color) show Figure 1 [14].hone radiation can lead to adverse effects [10-16]. Thus, the public concern is that increasing the frequency of the radiation will also increase the effects of the radiation [14-16].
The aim of this study for preparing a spin coating of thymol blue indicator TB on conducting glass formed from F-SnO2 to prepare a new modified electrode sensor (glass / indicator electrode), for used in potentiometric acid base titration.
Experimental
Chemicals
The chemicals used in potentiometric titrations and preparation the electrode was tetraethyl orthosilicate (TEOS), Thymol blue (TB), hydrochloric acid, ammonia, Acetic acid, phosphoric acid, sodium hydroxide, sulfuric acid, citric acid and disodium phosphate. The chemicals are of analytical pure grade (Merck) Where the F-SnO2 glass from (Sigma Aldrich).
Synthesis of Materials
Preparation of Hydrolyzed TEOS
A mixture of 2. ml of absolute ethanol, 0.86ml of 0.1M of HCl were added to 2.5ml of TEOS under stirring. The obtained solution was kept under stirring at room temperature until a homogeneous clear solution was obtained. The solution was aged at least for 24 hours before used in the coating process. The hydrolyzed TEOS solution was used as a host matrix for the indicators.
Preparation of Indicators
Indicators solution (1×10⁻²M) thymol blue indicator (TB) were prepared using absolute ethanol as solvent.
Stock solution of indicators
The sample solution was prepared by mixing 1ml of blank hydrolyzed TEOS solution and 1ml for each indicator.
Preparation of Silica-immobilized Thin Films
Substrate Cleaning
Glasses were activated by concentrated H2SO4 for 24 hours, then washed with distilled water and ethanol. The surface was finally rubbed with cleaning paper.
Preparation of glass/TB electrodes using Spin coating method
All thin films layers prepared in this work were made by spinning three drops of the solutions onto a clean glass slide. The coating process was performed using the spin coater machine at 900rpm spinning speed for 1 min. period time. To obtain multilayers of thin films a subsequent spin coating method was performed after gradually drying of the previous layer at room temperature for 24 hours, then dried at 80oC for another 48 hours. And repeat the spin coating two or three time. Where the conducting substrate is usually conducting glass, consisting of glass coated with a thin layer of F-doped SnO2.
Sensor design of potentiometric cell
The potential of the indicator electrode relative to that of the reference electrode was measured on a digital multimeter model YDM 302C (China). Potentials were measured to ±5mv. The potential of Thymol blue, sensor indicators electrodes was measured vs. a saturated calomel electrode (SCE). The error in the measurement of the potential due to liquid- junction potentials in these electrolytes is estimated to be about 0.001V.
The solution in a beaker is stirred by means of a magnetic stirrer. The electrodes (indicator and reference) were dipped slowly into aqueous solution (acid or reductant). After the steady state potential was attained, the titration of the acid was carried out by addition of 1ml of the base to the acidic solution, waiting until the steady potential is established and then measured. The potential variation depends on the type of the base, the progress of neutralization process and on the initial concentration of the acid to be titrated. The results were reproducible to satisfactory value of ±5 mV for potential measurements. The process of addition of the titrant was repeated until the equivalence point was reached.
The E-pH relation of Thymol blue electrode:
The E-pH relation of Thymol blue electrode
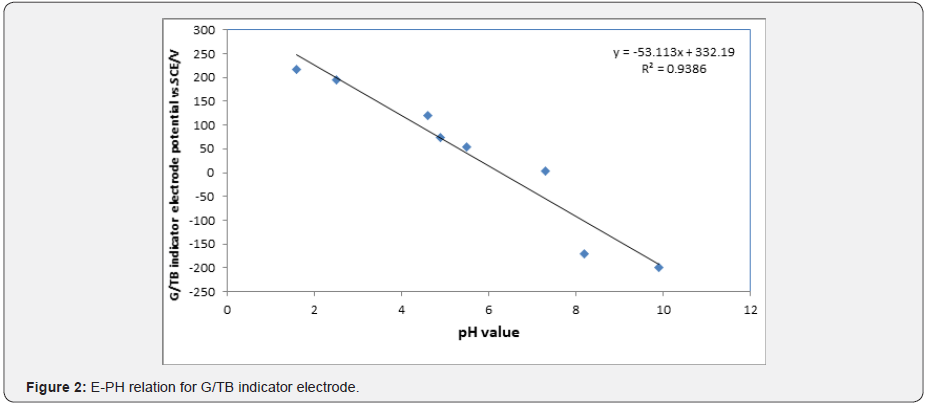
According to Figure 2 the change of the open circuit potential (E) of the G/ TB indicator electrode with pH . The E-pH plot of the G/TB indicator electrode fits straight line with slope of 53.11mV at 298K. This value is close to the magnitude of the term 2.303RT/F at the corresponding temperature (59.1mV at 298 K). This value is close to the magnitude of the term 2.303RT/F (where: R gas constant, T absolute temperature and F Faraday constant) at the corresponding temperature (59.1mV at 288K). From Figure 2 the E0 value of the sensor electrode, i.e., the potential at [H+] = 1, is computed as 279.1mV relative to the saturated calomel electrode and can determination by:
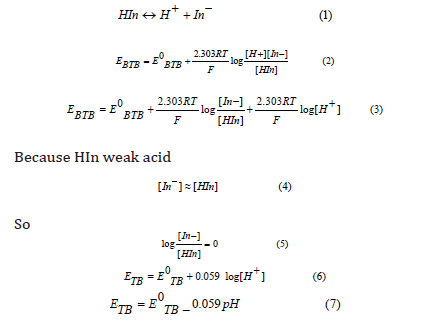
This equation is applicable for the reversible behavior of working electrode. From the developed Nernst equation, we indicate that working electrodes can be used as pH-indicator. At high or low pH, the electrode indicates pH less than true value as pH glass electrode, it may be due to damage in electrode or existence of alkali metal ions in solution too.
The response time of the sensor
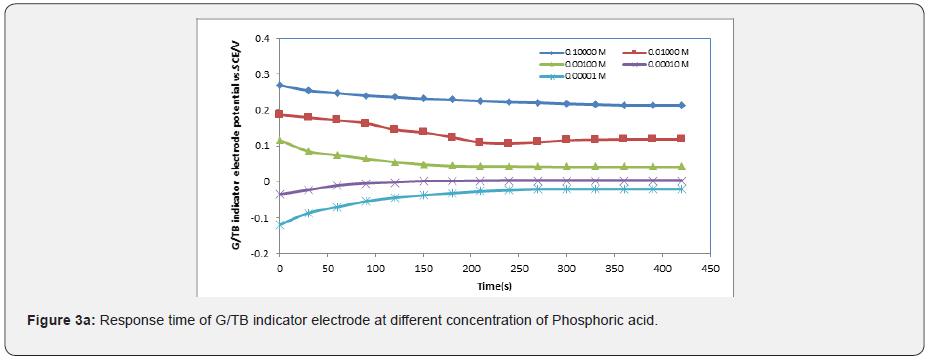
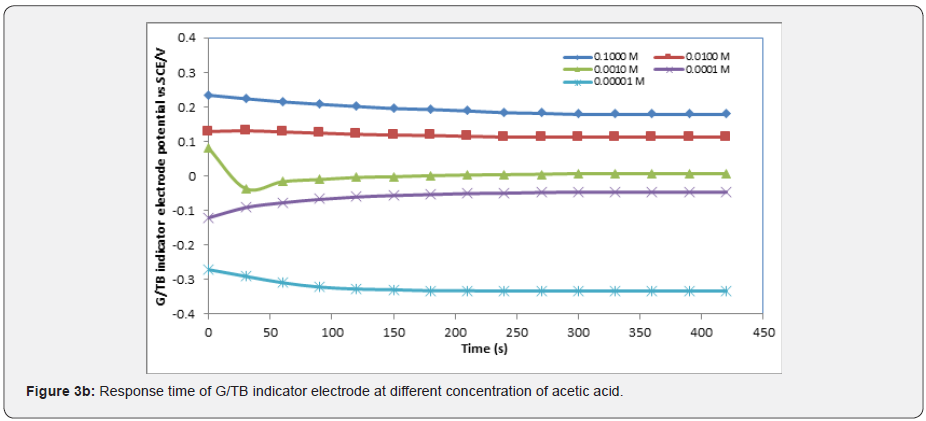
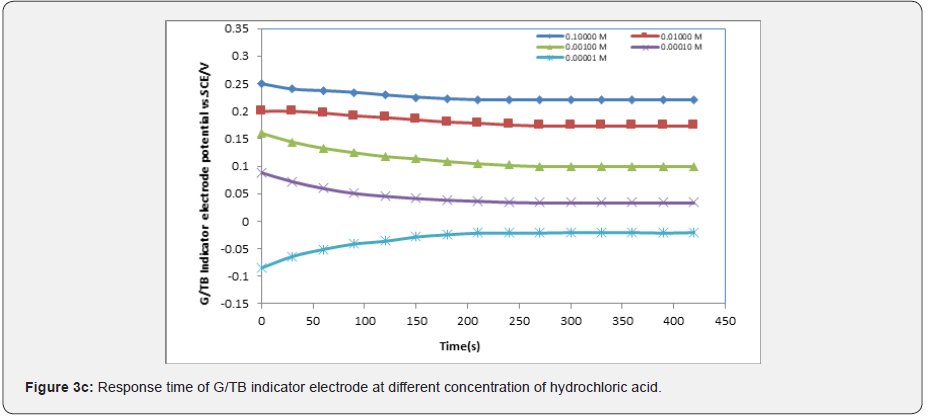
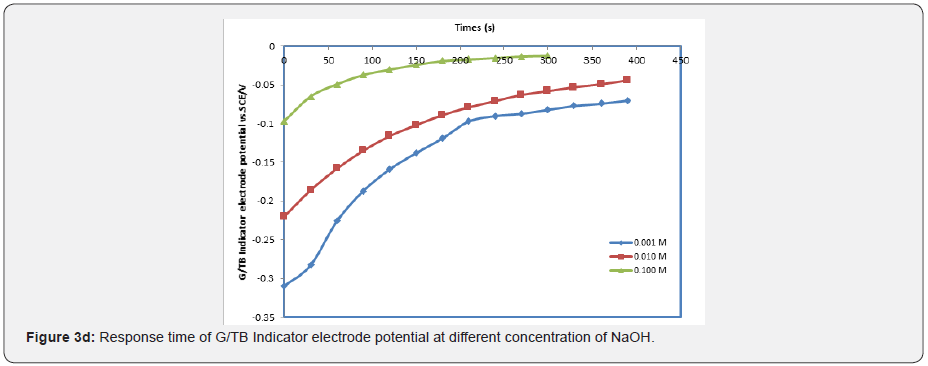
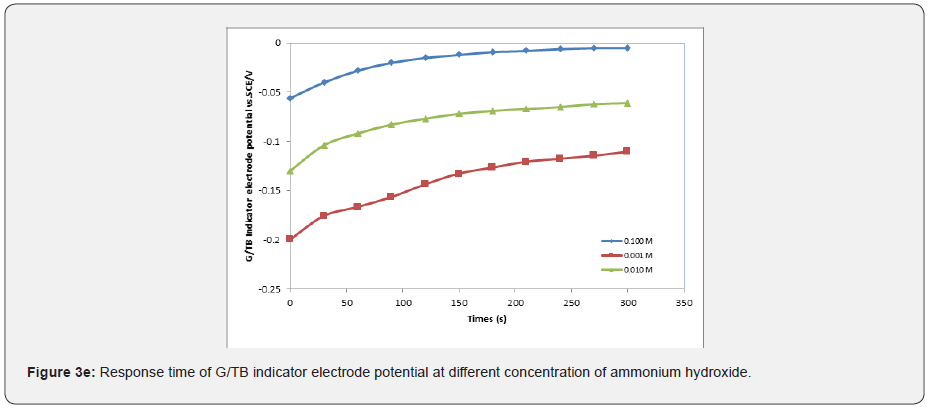
In general, the response time was defined as the time of sensor’s output reach to 90% of the equilibration after the measurement was started, especially to electrochemical sensors [15-17]. Figures 3a-3e show the response time of the G/TB sensor at different concentration of phosphoric acid, acetic acid, Hydrochloric acid, ammonia and NaOH respectively. Response time, in the range of (100-450) seconds was achieved, which rendered the sensor highly practical.

Effect of temperature on the response characteristics:
The importance of temperature measurement when performing pH measurements has already been mentioned in reference to slope correction. Temperature also has an effect of both pH buffers and solutions, as the hydrogen ion activity will increase with increasing pH [18].
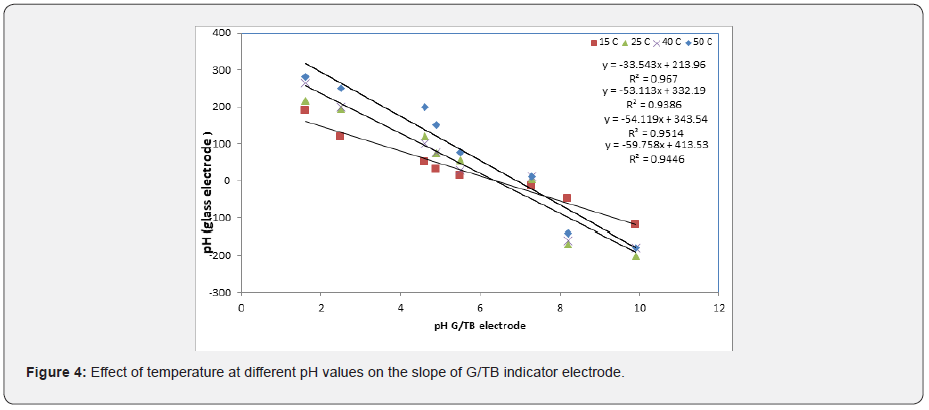
The Thymol blue sensor response was evaluated at different temperatures, Figure 4. At lower temperatures, like 288K, the slope of the sensor was about 33.54mV/decade and the sensor would be used for pH measurements in the range from (2-11). However, when the temperature of the test solutions was adjusted to 298K, the slope significantly increased to 53.11mV/decade. By raising the temperature to 313K and 323 K the slope increased to 54.11mV/ decade and 59.75mV/decade respectively. Figure 4 shows the square of the correlation coefficient (r2) for pH measurements using the solid-state sensor, at different temperatures, as compared to pH values obtained by a conventional pH electrode (Hanna Instruments HI 1131 pH combination electrode) was found to change as the temperature increases where as r2 values for measurements at 283K, 298K, 308K, and 318K were 0.9655, 0.9386, 0.9482, 0.9876, respectively. This indicates that better results could be obtained at 298K due to easy and settable to use without heating.
The relation between conventional glass PH electrode and G/ TB indicator electrode
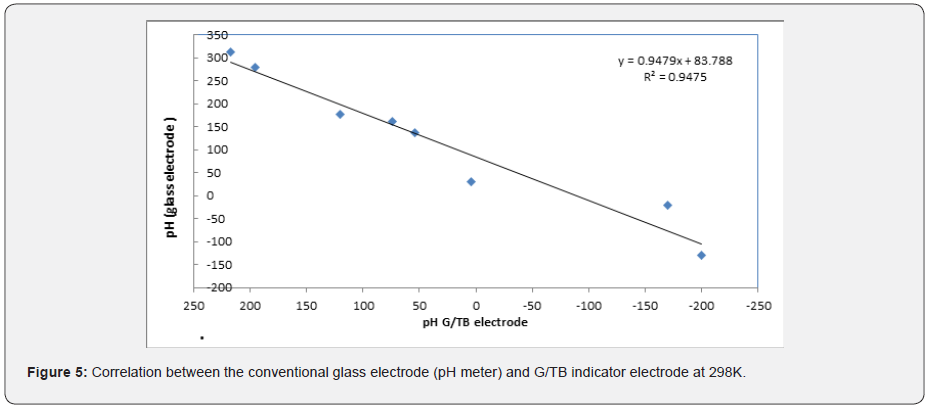
All potential values were converted with respect to the standard hydrogen electrode (SHE). During experiments, pH was also monitored with a commercial glass electrode that was calibrated daily using commercial standard buffer solutions (2-9) [19]. Figure 5 represents the correlation between the conventional glass PH electrode and G/Thymol blue indicator electrode, it can be easily recognized that excellent correlation between the results obtained by the solid-state pH sensor and the conventional glass pH electrode could be achieved. The slope of this relation was 0.947 and the r2 was 0.947. This indicate that G/TB indicator electrode potential values are closed to the values of conventional glass pH electrode.
Potentiometric of weak acids against NaOH
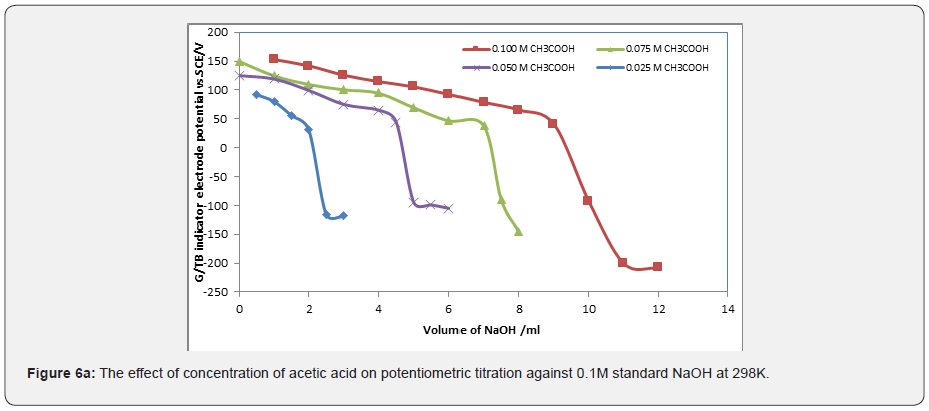
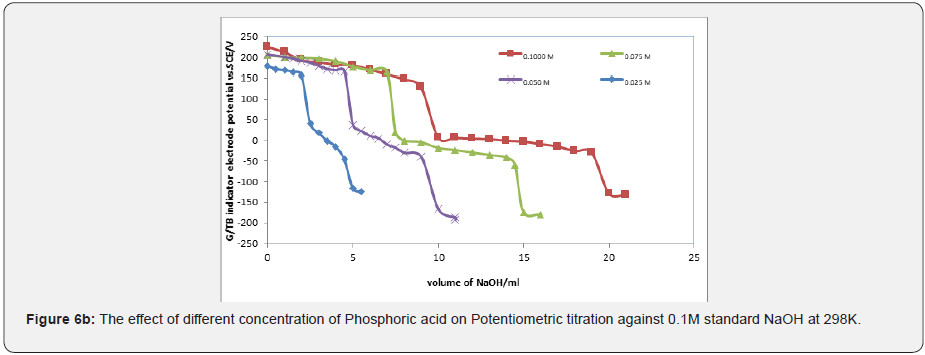
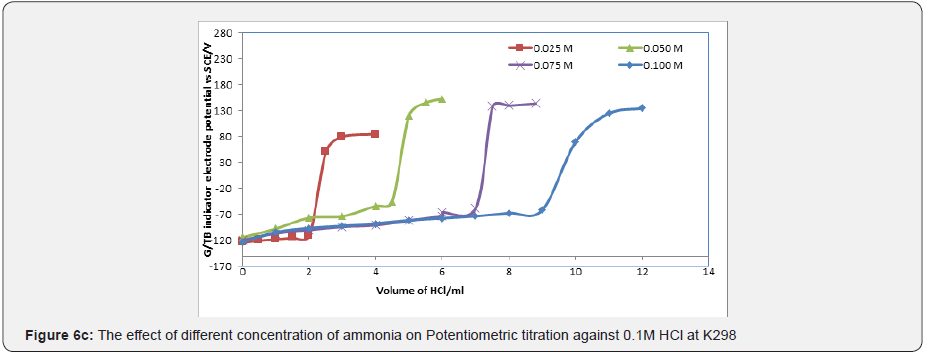
Figures 6a & 6b represent the potentiometric titration of 0.1M NaOH with different concentrations of acetic acids and phosphoric acid. The variation of G/TB electrode potential at 298K with the different volumes of standard 0.1M NaOH followed typical potentiometric titration curves. These curves show slight decrease in potential (to more negative values) with the addition of the titrant. Where Figure 6c show the potentiometric titration between the volume of 0.1M standard HCl against ammonia. The variation of the TB electrode potential at 298K with the different volumes of standard HCl followed typical potentiometric titration curves. These curves show slight increase in potential (to more positive values) with the addition of the titrant.
Location of endpoints
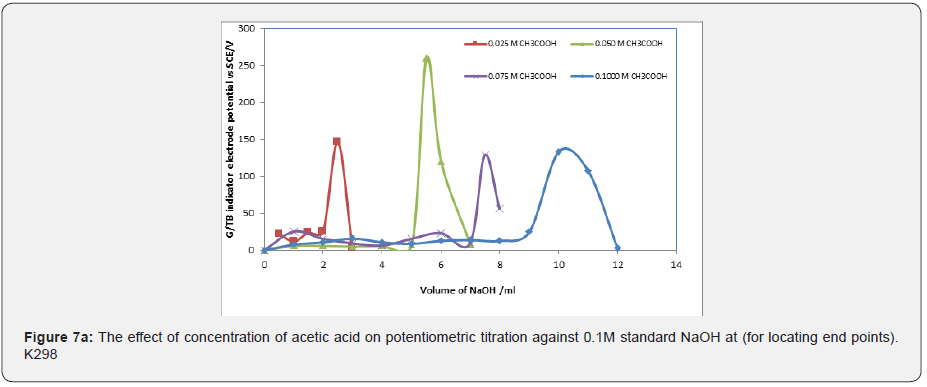
Figure 7a represent ΔE/ΔV against V plot for the potentiometric titrations of CH3COOH and H3PO4 with 0.1 M standard NaOH. From the plots the values of end points were determined. The obtained results and calculated values of (R%) are listed in Tables 1 & 2 for acetic acid and phosphoric acid respectively. The values of pKa for different concentration of acetic acid and phosphoric acid were calculated using the method of half neutralization as shown in Table 3. There are two jumps in the titration of phosphoric acid with NaOH using G/TB sensor. i.e two end points appear by using this electrode. The obtained values of pKa for the investigated bases are close to the previously reported values. Where Figure 7b represent ΔE/ΔV against V for the potentiometric titrations of ammonia and 0.1M standard HCl respectively. From the plots the values of end points are determined.
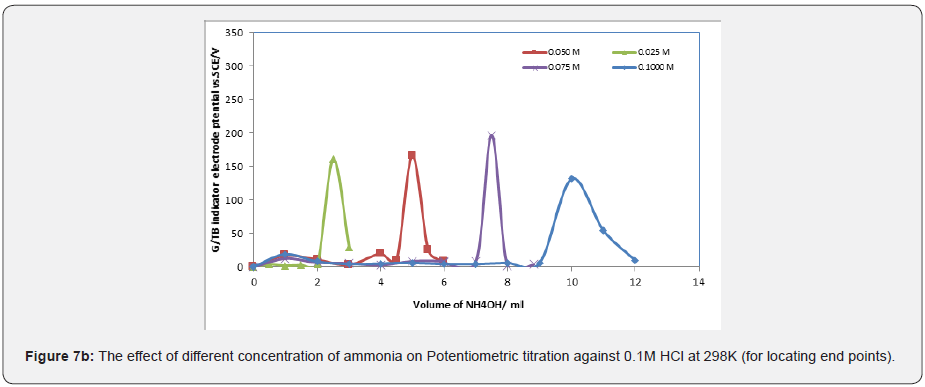


Finally, the values of pKb for different concentration of ammonia can be determined using the method of half neutralization. They are listed in Table 3 for the tested bases. The obtained values of pKb for the investigated bases are close to the previously reported values.

Conclusion
This study investigated the preparation of the modified electrodes of type glass/ thymol blue G/TB and their use as sensor indicator electrodes in the potentiometric acid-base titrations in aqueous solution at 298K. E-pH curve is linear with slope of 0.053.1V/decade for the G/BTB electrode at 298K. This value is close to the theoretical value 2.303RT/F (0.059V at 298K) and the recovery percentage for potentiometric acid-base titration using G/TB as indicator electrode was calculated.
i. On other hand the standard potential of the tested electrode, E0, is computed as 279mV with respect to SCE as reference electrode. Acetic acid, phosphoric acid, hydrochloric acid and ammonia were successfully potentiometric titration with NaOH as titrant in aqueous medium at 298K. Finally, this study is applied in different temperatures like 283K, 298K, 308K, and 318K were the correlation coefficient (r2) 0.9655, 0.9383, 0.9482, 0.9876, respectively.
To Know more about Juniper Online Journal Material Science
Click here: https://juniperpublishers.com/index.php


No comments:
Post a Comment