Fashion Technology & Textile Engineering - Juniper Publishers

Abstract
This study was carried out to analyze the importance of using consumer preferences while stocking footwear by the retailer. Consumer stated preference data was collected in five footwear retail stores. A saturated sampling method was followed. A total of 425 data was collected. The collected consumer preference data was analyzed using conjoint analysis. This resulted in the importance score and utility score for various features of footwear. These scores are useful in estimating the consumer preferences in footwear. The results are estimated using a maximum utility model. The footwear retailers can make use these results in forecasting and stocking decisions for footwear.
Keywords: Fashion product; Footwear; Consumer preferences; Maximum utility model; Forecasting; Stoking decisions
Introduction
Footwear is the outer covering for the feet that gives protection and is in use since the earliest human history. Different cultures have different customs regarding footwear. Retailers and designers, design footwear by analyzing the trend, culture, experiences, intuitions, past sales data Franses & Verhoef [1] expert opinion data Normand, McNeil, Peterson & Palmer [2] consumer preferences data Darby, Batte, Ernst & Roe [3]; Wu, Liao & Chatwuthikrai [4]. While selecting footwear consumers select it based on their preference for a combination of attributes. Consumer preference can be measured in terms of utility that they derive from each attribute which make a product. The Utility can also be defined as the satisfaction that a consumer derives from the consumption of goods. Consumer value for different products is measured in terms of comparing utilities between them. Therefore, consumer preference can be considered as they express major factors such as fit, comfort, price, etc. Consumer preferences can be analysed using many methods like Functional measurement, Trade off analysis, Conjoint analysis etc., Eric P Kroes & Robert J Sheldon [5]. Conjoint analysis was initially originated in mathematical psychology, it is a statistical technique which determines how consumer value different attributes that make up an individual product or service. The objective of the conjoint analysis is to determine what combination of an attribute is more influential on the respondent choice of decision-making Francesco Marangon et al. [6] and was first introduced in marketing research to evaluate consumer preferences Kuzmanovic, Savic, Andric Gusavac, Makajic-Nikolic & Panic [7].
The basic principle underlying conjoint analysis is that a product is composed of attributes (example: comfort) and that each attribute may have two or more levels (example: less, medium, more) Manalo [8]. For example, while purchasing footwear, style and fit is majorly noticed by consumers along with price R Venkata Rao [9]. A combination of these different levels is known as a profile. The profiles can be either hypothetical or realistic. Respondents give their preference for a product in terms of ranking or rating. A profile is the more realistic context of asking respondents to evaluate potential product. They can be either given to respondents as a full profile or trade off method. Full profile is used in conjoint analysis in which the respondents prioritize the full range of the attributes of services J Douglous carroll & Paul E Green [10]. Using an experimental design called orthogonal array a total of a large combinations can be presented in as low as 6-20 combinations Manalo [8]. There are major steps for conjoint analysis as shown in Table 1 Paul E Green & Srinivasan [11].
First step in conjoint analysis is to select hypothetical scenarios for survey, to do this a preference model is selected. From Table 1, any method like vector model or ideal point model etc., can be chosen based on the attributes the product comprises of. The second step is to choose the data collection method. The third step is to use any of the stimulus set construction method and reduce the number of profiles to show to the respondents. Then by selecting a stimulus presentation method, description of the product can be given as pictorial or verbal Holbrook & Moore [12] or pictorial verbal Wu, Liao & Chatwuthikrai [4]. Pictorialverbal representation can be adopted because the information overload is reduced and the respondents take less time and it could be made realistic and interesting Paul E Green, V Srinivasan [13]. Pictorial representations can be used to overcome language barriers. These cards are evaluated by the respondents in the form of ranking or rating them Rada Mihalcea [14]. Ranking is sorting the profiles in terms of preferences from 1 to n. No equal ranks are allowed. It needs more explanations and preparations Jordan J Louviere [15]. Rating is assigning a preference score to each card. It expresses intensity of preferences but without comparison between products Rao [16]. In rating, Likert scale, numeric rating scale, graphic rating scale etc. are used. Likert scale is a scaling method, measuring the positive or negative response of a statement.
It is the most widely used in survey Rohit Verma, Madeline E Pullman [17]. These evaluations are analyzed using part worth, vector model, and ideal point Paul E Green & Srinivasan [11]. Analysis of collected data, results in a utility score, Known as a part worth. Part worth represents attributes utilities by a piece wise linear curve. This curve is formed by a set of straight lines that connect the point estimates of the utilities for the attribute levels Paul E Green, V Srinivasan [13]. These utility scores provide a quantitative measure of the preferences for each factor level and the larger value has the greater preferences. Apart from part worth scores, importance scores can also be estimated. A measure of relative importance of each factor known as an Importance score or value. The importance scores are computed by taking the range of utility score of each factor separately and dividing by the sum of utility ranges of all factors. Importance score also results in profile preferences. Profile preference is done using conjoint simulators. Conjoint simulators transform part worth utility data into a useful and appealing model. Simulators allow research and managers to analyze potential demand in a competitive market context and see how various changes to competing product profiles might impact demand.
This can be used for new product developments Orme B [18]. Conjoint analysis is important in the new product development and understanding preference for non-existing product. Conjoint analysis is used to understand consumer preferences, it has various applications, it is used in new product development of subcompact cars Wu [4] and according to Pentus, Mehine & Kuusik [19] package design can be altered by conjoint analysis as per the consumer’s preference, consumers’ preferences for attributes is demonstrated with the apple as an example Manalo [8] used to evaluate consumer preferences in mobile phones, also in Japanese telecommunication N Takano [20] also to study tourist preferences and in sports apparel because it is more comfort oriented hence it definitely needs the preference of the consumer Fowler [21] young fashion retail buyer’s attribute selection is done using conjoint analysis which helps to redefine or define a new product in fashion Burger [22] etc. Conjoint Analysis is hence proved to be a versatile tool to identify consumer preferences, but there are scarce resources in apparel as well as footwear that uses conjoint analysis in understanding consumer preferences and utilizing results in product designing, stocking decisions etc. Thus, in this study, an attempt is made to use conjoint analysis in understanding consumer preferences in women’s footwear.
Methodology
For understanding important score and utility score, the conjoint analysis was performed by using the following steps. To perform conjoint analysis, the attributes influencing consumer preferences was to be identified [23-25].
Attribute identification
To understand the attributes which influence the consumer preference in footwear, the expert opinion data was collected. Expert opinion data was conducted in 2 rounds. In the first round, the experts gave the important attributes and levels. Then in the second round, a consensus was brought in identifying the important attributes and levels.
Card design
From the expert opinion data, 6 attributes viz. heel, model, comfort, durability, price, material. And their levels are heel – pointed, flat and wedges, model – party wear and casual wear, comfort – less, medium and more, durability – 3 to 6 months, 6 months and 6 months & above, price – 250 to 500, 501 to 1000 and 1001 & above and material – leather, rexin and plastic were identified influencing footwear preferences. A combination of five attributes at three levels and one attribute at two levels (3^5*2^1 =486) resulted in 486 hypothetical profiles. Respondents will not be able to evaluate all the 486 profile, so to reduce the number of profiles, an orthogonal array was performed using SPSS. Here a fractional factorial design was followed to reduce 486 profiles to 20 profiles including 2 holdouts. Based on the orthogonal array, the cards were designed. To make it more interesting and easy way to evaluate, these cards were designed with both verbal and pictorial representation.

Questionnaire preparation
The attributes and various levels of the attributes were explained to the respondents. The evaluations were in the form of rating method. The questionnaire contains 5 - 1 Rating scale in which 5 represent most likely to purchase, 4 – likely to purchase, 3 – may or may not purchase, 2 – less interested and 1 – not at all interested. It also includes 4 open-ended questions about the respondents such as locality, color preferences, age and the brand preferences.
Data collection
The survey was done in Coimbatore, a city in India, for one month. For conducting the survey, a stratified sampling method was used. For this survey, 5 retail stores had been selected which had similar product such as women’s footwear, price such as Rs.250 – Rs.2000, target customers mainly were women, and weekend and week days’ walk-in were also similar in these stores. The retail stores also cater to kids and men’s footwear. The survey was a face– to –face survey.
Utility score
From the data, utility score can also be calculated, using part worth method. These utility scores indicate the perceived value of the variable and how sensitive consumer perceptions and preferences are to changes in product features. The combination of the overall part worth gives the total utility score. According to Kuzmanovic [7] to calculate respondents’ utility, linear additive utility model as in Eq. (1) is used.
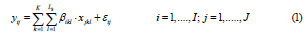
Where j is the number of profiles, K is the number of attributes, Lk is the number of levels of attribute k, and βikl is respondent i’s part-worth utility with respect to level l of the attribute k. Xjkl is such a {0,1} variable that equals 1 if profile j has attribute k at level l, otherwise it equals 0. εij is a stochastic error term.
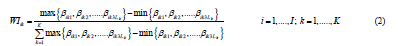
Important score
Attribute selected were price, model, heel, comfort, material and durability. The attributes selected were discrete that means they were individual, separate, distinct, unattached from each other. To understand which attribute the respondents value the most, important score was analyzed using the collected data using the represented in Eq. (2). For this SPSS software version – 17 was used. The importance of an attribute depends on the attribute levels chosen for the study. The importance is calculated based on the range of utility in each attribute.
Preference score
Using the data, the important score and utility score were calculated. The preference scores were also calculated using conjoint simulators. There are various conjoint simulation methods: max utility, Bradley-Terry-Luce (BTL) and logit. Each method has its pro and cons, the share of utility rule suffers from IIA property, and the weight age is based on utility scores. This study aims to give weight age based on preference order and not on the utility score. Maximum utility rule is a simple method and is used for high involvement products to estimate demand for an SKU, the number of respondents for whom this SKU offers highest utility is counted and is divided by a total number of respondents Rao [16]. Maximum utility rule assumes the respondents will buy the product for which he or she has the maximum preference with a probability of 1.
Results and Discussion
Attributes influencing consumer preferences were selected from different sources such as retailers’ interview, journal etc. The final attributes and levels were selected by conducting expert opinion data in two rounds. The selected attributes are heel, material, durability, comfort, ornamentation and price. Experts suggested retaining these six attributes because they felt their customers are more particular about heels, price and material. They also suggested including comfort. Durability because they felt, many customers look for durability, that value for money they pay. They felt customers rarely ask about ornamentation, so that attribute was removed.
Orthogonal array
By doing fractional factorial design twenty hypothetical profiles were derived. This includes two holdouts. This is shown in Table 2.

Design-pictorial/verbal
With the twenty profiles arrived the profile cards were designed. After using fraction factorial method to reduce the profiles from 486 the result came out with 18 cards and 2 holdouts. Hence, we got 20 cards as the final cards. These are pictorial-verbal cards.
Questionnaire design
Respondents evaluated the cards using rating method. The questionnaire contained 5-1 rating scale and questions pertaining to four demographic questions like color preference, age, brand.
Data collection
The survey was done in Coimbatore. This resulted in 425 usable responses. The respondents ensured a good representation of the population based on age. From the collected data, important score is analyzed. The result for important score is given in Table 3. Heel is given highest importance because our respondents were mostly college going girls who gives higher importance only for the heel. Secondly the respondents prefer comfort which gives them free movement. Next to the comfort the customers give more importance to material, price and only minimum importance was given to durability. Finally, model has been chosen as a least attribute as the respondents mostly feel price, durability, material as more important than the model.

Utility score
From the data, the utility score is calculated using part worth method. This utility score indicates the perceived value and the preference of a product. Shown in Figure 1. The results shows, in the attribute “price” lower price i.e. Rs.250 to Rs.500 has gained the highest utility score of 0.40 because the respondents who were visiting these stores are interested to buy the footwear at lower price. The result shows, in the attribute, “model” casual wear has got the highest utility score of 0.17 and party wear has got the lowest utility. The attribute “comfort” has gained the highest utility score of 0.90 than the others. In the attribute” material”, rubber has gained the highest utility score of 0.137.In the attribute “durability” that is 6months & above has gained the highest utility score of 0.083.In the attribute “heel”, flat has gained higher utility.

Simulation
From the utility scores it is noted that the profile which contains Rs.501 to 1000, casual wear, flat, more, comfort rubber and 6 months & above is highly preferred profile among the 27 existing / new profiles and it has gained preference share of 11.6%. Followed by Rs.1001 & above, party wear, pointed, more, leather, 6 months & above gained 10.6% and Rs.250 to 500, casual wear, wedges, less, rubber, 6 months has gained 7.1% and 250 – 500, casual wear, wedges, less, rexin, 3 months has gained 7.0%. From the Table 4 it can be noted that highly preferred SKU’s contains attributes like low price, casual wear, and pointed heel because most of the respondents are under the age of 30 and resides within 10kms from the city.

Reliability
The Pearson correlation coefficient R can take a range of values from +1 to -1. Here the value is greater than 0 i.e. 0.811 indicates a positive association. This value indicates the high linear correlation between the variables. The results show the value of Kendall’s tau is 0.525. This value indicates the moderate relationship between the columns of the rated data. Thus, the maximum utility model is validated in products like footwear. As fashion related products preferences is highly volatile and consumers easily substitute one style for another.
Conclusion
Result of utility score calculation shows, among price, Rs. 250 – 500 is highly preferred and Rs. 1001 & above has low preference. Among Model, casual wear has high preferences and party wear has low preference. Among Heel, pointed heel has high preference and flat has low preference. Among attributes pertaining comfort, more comfort is highly preferred than medium comfort. Among material rubber has high preference than leather. Among Durability attribute- 6 month and above has high preference and whereas, attribute 6 month has low preference. Result of the simulation shows that the combination of attributes which contains 501-1000, casual wear, flat, more comfort, rubber, 6 months & above gained the highest score of 11.6%. Thus, in this study, conjoint analysis is used to find the attributes required for the footwear according to consumer preferences.
To Know more about Fashion Technology & Textile Engineering
Click here: https://juniperpublishers.com/index.php


No comments:
Post a Comment