Oceanography & Fisheries - Juniper Publishers
Abstract
Climate change has brought about significant impacts to the earth, one of which is sea level change. Observation indicates the acceleration of global mean sea level rise since twenty-first century. Sea level rise will trigger series of coastal disasters and affect social and economic development in the offshore area. This paper reviewed the research updates about sea level change, including different sea level observing techniques and their characteristics, the latest research results on the global, regional and coastal scales, sea level change contributors, etc.
Introduction
In the context of global warming, the expansion of seawater, the melting of terrestrial glacier and other factors have led to an increase in seawater quality and volume, causing global sea level rise, which is an important indicator of climate change, as well as a hot spot for climate change research. According to the IPCC Assessment Report [1,2], the sea level rise shows the transition from a relatively low average rate in the past two thousand years very likely that the global average sea level rise continues to accelerate since the early 20th century. In addition, since the early 1970s, 75% of the observed global mean sea level rise can be explained by ocean thermal expansion due to climate warming and loss of glacier ice.
Sea Level Observation
Sea level refers to the relatively stable sea surface after eliminating various fluctuations in the ocean, which is obtained through sea water level observing. At present, two observing techniques are widely used, viz tide gauge station and satellite altimeter. Sea level observations are of vital importance for studying sea level change. Before the advent of satellite altimetry technology, the tide gauges were the main source of data for calculating sea level change [3-5], with the advantages of high precision and long duration, and many shortcomings at the same time, such as uneven station distribution, difficulty in eliminating crustal movement and the rebound effect after regional ice age. The Intergovernmental Oceanographic Commission (IOC) adopted the Global Sea-Level Observing System (GLOSS) inMarch 1987, whose subordinate, the Permanent Service for Mean Sea Level (PSMSL) manages nearly 2,000 tide stations around the world, and its sea level data can be traced back to the early 18th century.
Since 1993, high-precision satellite altimeters have become a common observing measure for sea level change. The global high-resolution sea level observation data can be obtained from the altimeters carried on the artificial satellites, including Jason-3, Sentinel-3A, HY-2A, Saral/AltiKa, Cryosat-2, Jason-2, Jason-1, T/P, ENVISAT, and so on. With the large coverage and high spatial resolution, satellite altimeters have the distinctive super priority and make up the shortcomings of traditional tidal gauges [6-8], which makes the sea level data sequence more complete, continuous and standardized and provides high-quality measured data for global sea level change research. In addition, some scholars have used data fusion techniques to reconstruct the gridded historical global mean sea level time series using long sequence tidal gauge station data and satellite data, which helps to understand and analyze the long-term sea level change and its trend.
Global Sea Level Change
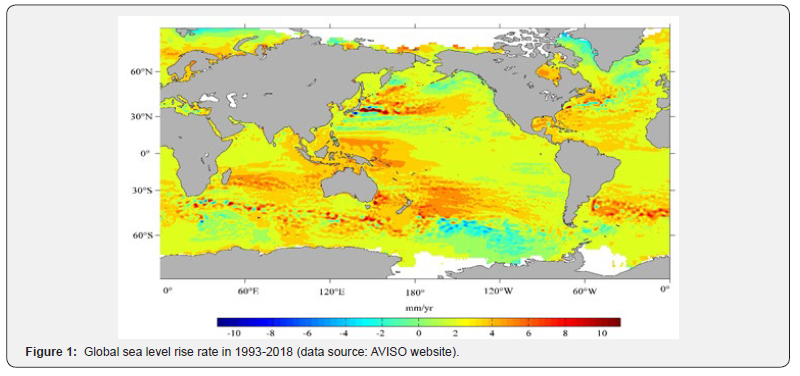
The global sea level fluctuation in the pre-industrial era was about ±8 cm, while the sea level increased by 14 cm in the 20th century, far higher than any century in the past 2800 years [9,10]. The comprehensive analysis of tide gauge data, satellite data and numerical model data shows that the global mean sealevel rise rate was 1.7 mm/yr, 2.0 mm/yr and 3.3 mm/year in 1901-2010, 1971-2010 and 1993-2018, respectively, showing significant acceleration (IPCC, 2013; WMO, 2019). There are obvious regional characteristics of global sea level change. (Figure1) shows the spatial distribution of sea level rise rate of global satellite altimeter from 1993 to 2018 according to the data from AVISO, from which the uneven spatial distribution of global sea level change trend can be identified. The sea level in the midlatitude (20° to 50°N) northern hemisphere rises considerably fast, while the sea level rise in the high latitude (>50°N) area is relatively slow, and the sea level rises at a high rate in the midhigh latitude (20°-60°S) southern hemisphere.

Most areas in the Southern Ocean are experiencing sea level rise, as well as main parts of the Pacific and Indian Oceans, especially the Northwest Pacific and Southeast Asia Archipelago. The sea level rise rates at different latitudes in the western Pacific Ocean are quite different, the rising rates in the sea near the equator are consistent and large, with the sea level rise rate peaking in the sea near the Kuroshio Extension, while sea level in some other areas show a downward trend. The sea level in most areas of the North Pacific Ocean, including the middle and low latitude areas on the west side of the ocean basin, has risen with varying amplitudes, and a few sea areas have a downward trend, such as high latitude area and the middle and low latitude areas on the east coast of the ocean [11]. The sea level rise rate in the tropical western Pacific is about 6-8 mm/yr, and there is a slight downward trend in the tropical eastern Pacific Ocean [12- 14].
Sea Level Change Attribution
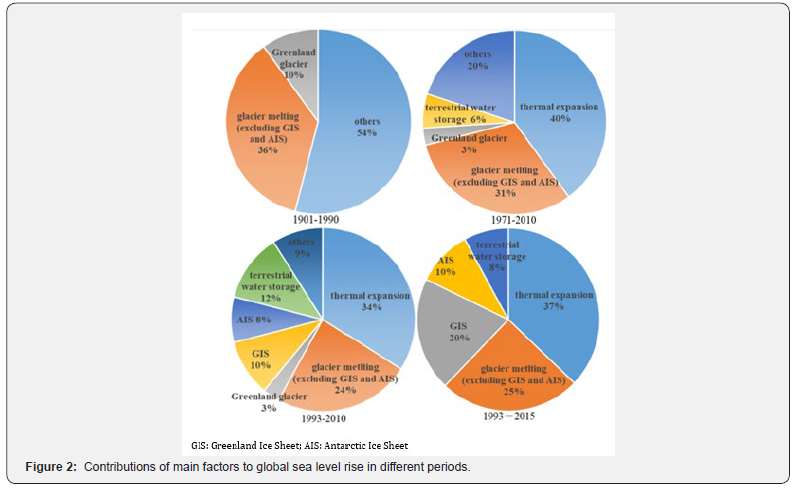
Global sea level rise is mainly attributed to climate change, to be specific, seawater expansion caused by global warming, melting of polar ice caps and terrestrial glacier ice caps, etc. (IPCC, 2013). In addition to the effects of global sea level changes, regional sea level change can also be affected by factors including regional oceanic-atmospheric dynamic processes, seabed movements, seawater mass redistribution, coastal subsidence or ascend, wind fields, freshwater fluxes, and ocean heat content, etc. According to IPCC AR5, during the periodof 1901-1990, the contribution of glacial melting excluding Greenland and Antarctic was 0.54 mm/yr, and that of Greenland glaciers was 0.15 mm/yr, during which the contribution of terrestrial water was -0.11 mm/yr; During the period of 1971- 2010, the contribution of thermal expansion was 0.80 mm/yr, the melting of glaciers excluding Greenland and Antarctic 0.62 mm/yr, the melting of the Greenland glaciers 0.06 mm/yr, and the terrestrial water storage 0.12 mm/yr;
During 1993-2010, the contribution of thermal expansion was 1.1 mm/yr, the glacier melting excluding Greenland and Antarctica 0.76 mm/yr, the Greenland glaciers melted to 0.10 mm/yr, the Greenland Ice Sheet to 0.33 mm/yr, the Antarctic Ice Sheet 0.27 mm/yr, and the terrestrial water storage 0.38 mm/yr. Dieng et al [15] used a statistic method to analyze the contributors from 1993 to 2015, turning out the contribution of the glacier melting was 0.76 mm/yr, the Greenland Ice Sheet 0.61 mm/yr, the Antarctic Ice Sheet c was 0.30 mm/yr, the terrestrial water storage 0.24 mm/yr and thermal expansion 1.13 mm/ yr. As time passing by, the sea level rise caused by each major factor has increased, which is consistent with the conclusion that the rate of sea level rise is accelerating. The contributions of each major factor to global sea level rise are shown in (Figure 2), and the contribution rate of each factor varies with time. The thermosteric sea level proportion, i.e. contribution of sea level change caused by ocean thermal expansion, generally shows a downward trend, from 40% in 1971~2010 to 37% in 1993~2015.

Satellite observations show that the mass loss rate of the Greenland Ice Sheet and the Antarctic Ice Sheet has increased year by year since the satellite era [16], and the contributions of the melting of glaciers, ice sheets and changes in terrestrial water reserves to sea level change increase gradually correspondingly, especially the Greenland Ice Sheet. The total contribution of water injection to global sea level rise during the period 1993- 2014 is about 60%, and about 1.5 times that of the steric sea level. Since 2005, the contribution rate of Greenland Ice Sheet and Antarctic Ice Sheet to global sea level rise has been 21% and 11% respectively [17]. Limited by observing data, there are few studies on halosteric sea level changes. Levitus et al [18] analyzed the halosteric sea level change from 1955 to 1998 utilizing the 2001 World Ocean Database (WOD01) and found out a downward trend. Wang et al [19] used ARGO buoy data to study the global halosteric sea level change from 2005 to 2015, and the result revealed that the halosteric sea level change has a negative contribution to the steric sea level change, accounting for about -5.8%.
Conclusion
Sea level rise is one of the most intuitive manifestations of climate warming, and it is of vital importance to analyze the characteristics and causes of sea level change, and scientifically project future sea level change, which are essential for coping with climate change and mitigating sea level rise impacts. In recent years, it is gratifying to note that great progress has been made in researches on sea level change. Many studies have shown the significant sea level rise worldwide and the accelerating trend in the 20th century. According to some climate models, the global sea level will continue to rise in the 21st century, and due to the acceleration of the ocean warming plus melting of the glacier and ice sheets, the rate of sea level rise may get faster and faster. At present, there are still great uncertainties in the sea level change projections, especially the contribution of the melting of glacier and ice sheet in the Arctic and the Antarctic regions. It is of great significance for predicting sea level rise in the future to perform comprehensive study on the contribution of melting Greenland Ice Sheet and Antarctic Ice Sheet to the increase of seawater mass, and to strengthen the observing and analysis of regional sea level changes.
To Know more about Oceanography & Fisheries
Click here: https://juniperpublishers.com/index.php


No comments:
Post a Comment