Journal of Forensic Sciences & Criminal Investigation
Archaeological site in Iruña-Veleia
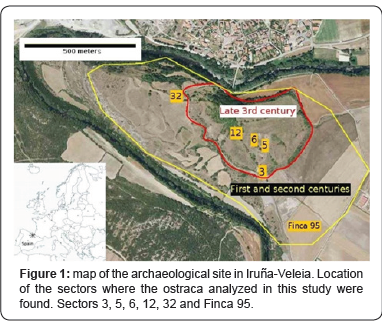
Iruña-Veleia is an archaeological site located in northern Spain, 10 km away from the city of Vitoria- Gasteiz (Figure 1). In the Bronze Age, 800 years B.C., there were already indigenous people. From 40-30 B.C. the Roman Empire took control of Iruña-Veleia and around the first century A.C., they started to build a Roman-style city. From the first to the third century, the city was at its peak. There were between 6000 and 8000 inhabitants and the city was 80 hectares in area. In the third century, the Roman crisis led to a decrease in size; there was a decrease from 80 hectares to 10. In addition, city walls were built around it (Figure 1). In the sixth century A.C., the city was abandoned. In the following centuries (around 1300 years), there were forests and crop fields. These days, 5 per cent of the archaeological site was excavated. In 2005 and 2006, about 400 objects containing graphite sketches were found (called ostraca) during the archaeological excavation led by Eliseo Gil, who had been working at the archaeological site since 1995. Archaeologists found more than 400 archaeological objects which had writing or drawing scratched into them. The technique used to write these texts consisted of doing freehand line grooves on different materials by using tough objects, without using any guide or stencil. The texts found had been written on pottery, clay, Hispanic terra sigillata (HTS), bone, brick and mortar.
Texts were written in Latin, Basque and Greek. They covered a wide range of themes: alphabets, anthroponomy, classical names, the Creed, Christian characters, Egyptian names, sentences in Basque, lists of Basque words, myths, Roman religion and texts in Latin. The ostraca analyzed in this study were found in six different sectors and within a total of nine archaeological strata. All that diversity made the team of archaeologists think of the existence of a school. The chronology assigned to those objects dated from AD 100 to 500. After publishing the photos of some of the ostraca found, experts in various fields casted doubts on the authenticity of the texts up to the point of accusing the leader of the excavation of falsifying those texts and further stated that he had written them himself after unearthing the archaeological objects with the purpose of gaining professional reputation. As a result of those accusations, the excavation team was dismissed. Nowadays, there is a new team of archaeologists working in that archaeological site.
Authenticity of texts
The starting point of this study was the concern about the authenticity or falseness of the texts scratched into the ostraca found at the archaeological site of Iruña-Veleia [1]. in northern Spain from 2005 to 2008 by the team of archaeologists hired. Controversy has broken out over whether those texts were written in the Roman period (if it be so, texts would be authentic) or whether the texts were written after being unearthed by the archaeologists from 2005 to 2007 (being that the case, texts would be false). The materials on which texts were scratched date back to the Roman period, but doubts have arisen over the date those texts were written: either in the first centuries A.C. or in the twenty first century. All the ostraca are in question and opponents of the authenticity of texts claim that all of them are fake; supporters, however, state that every text is authentic. After 10 years of discoveries, thus far there is only one scientific book that defends the authenticity of those texts [2]. There is not any scientific magazine article reviewed by experts that deals with this issue. Pieces have been taken to a laboratory three times in order to carry out a physical-chemical analysis.
The first analysis was rejected, for it did not comply with minimum required requirements, the second analysis was aborted before finishing it and the third analysis was not published even if it had been financed with public funds. The owner of the ostraca and the archaeological site, the local government, does not allow any study on the ostraca nor any exploration of verification at the archaeological site aimed at finding new ostraca. It is surprising that bones have not been analyzed yet; it is easy to scratch fresh bones, but it is difficult to do so on old bones. Dating bones with texts written on them could end this controversy. It is also surprising that dating analyses of bricks with texts written on them have not been carried out before baking the bricks in an oven. In short, materials have not been at the disposal of the scientific community for 10 years. In those 10 years, the only possibility of making scientific progress was studying the photos of the ostraca. In order to understand this difficult situation, it should be noted that texts written on the ostraca have seriously questioned highly established scientific theories on the reconstruction of the Basque language in the Roman period, on the migration of population in the fifth and eighth centuries and on the introduction of Christianity in the Basque region. Here is a small summary, without going in depth, of the arguments for and against the authenticity of texts.
Arguments for the authenticity of texts
a. Some ostraca have letters covered by mineral deposits.
b. On top of the marks of the letters of the texts, there are are crystallizations of calcium carbonate.
c. Incisions on bone are only possible on fresh bone, not on very old bones.
d. There are ostraca scratched on brick before the baking.
e. Team of archaeologists that has great credit worthiness and 10 years of experience.
f. High quality archaeological practice according to Edward Harries, creator of the Harris Matrix method [3].
g. The set of ostraca is coherent with the Roman period.
h. There are parallelisms of drawings and shapes of letters of that period.
i. The shapes of the allographs are from the Roman period.
In general, supporters of the authenticity ask for a laboratory analysis and trial excavations at the archaeological site with the participation of the international scientific community.
Arguments against the authenticity of texts
a. Texts contradict the theoretical reconstruction of the Basque language of the Roman period.
There is not any prior text to the discovery of the ostraca in the eleventh century regarding the Basque language.
b. Texts contradict the established theory about the nonexistence of Basque-speaking population in Iruña-Veleia during the Roman period.
c. Texts contradict the established theory about the introduction of Christianity in the region after the eighth and ninth centuries.
d. Impossibility of NIIPIIRTITI, NIIPIIRTARI y NIIFIIRTITI in the Roman period. It should be read Nepertiti, Nepertari y Nefertiti.
e. Impossibility of reading RIP on a crucifix.
f. Impossibility of very evolved forms from Latin: PLUTON, FEBO, BACO…
g. Impossibility of ANQUISIIS, since in that period only ANCHISIIS was possible.
h. Impossibility of CVORII, which is a very evolved form of Latin.
i. The shape of the M allographs is not from that period.
In general, supporters of the falseness of texts deny the need for a laboratory analysis and trial excavations at the archaeological site, which are claimed to be unnecessary, since the falseness of text has already been proven.
Phases of The Study
Here is the ultimate question to which this study aims to respond: are those texts current falsifications or were they written in the Roman period? The answer to that question is multidisciplinary and beyond reach, but from the forensic science of text analyses, an attempt has to be made to contribute to responding to the general question. And regarding the discipline of forensic analysis of handwritten texts, the questions to respond to are: is there a single author or, on the contrary, do the texts written on the ostraca have several authors? Is the size of the ostraca related to the size of the letters? Are there different groups of writing regarding the various materials, themes, strata or languages? If there are different groups of letters regarding different factors, what scenarios are the most probable to explain it? Figure 2 shows the flow chart of the study.

Part one. Are data heterogeneous?
In the event that there is a single writer, it is expectable for the measurements taken to be homogeneous results. On the contrary, if there were several writers, the results of the study would be heterogeneous. In the first part of this study, an attempt will be made to determine whether the distances measured are heterogeneous or homogeneous. When facing the dilemma about deciding whether the null hypothesis (H0) was the heterogeneity or homogeneity of the distances, it was observed that the objects with texts written on them had been found in five different sectors, in nine strata from different epochs. Moreover, they dealt with 11 themes, they had been written on nine different types of material and in three different languages. Therefore, as a starting null hypothesis, there may be diversity in the measured distances as well. Consequently, the null hypothesis was suggested as follows: [HA0] The characters of the texts are heterogeneous regarding the three distances measured the alternative hypothesis would be the following:
[HA1]The characters of the texts are homogeneous for the three distances measured The statistical task was to try to define the homogeneity or lack of homogeneity of the features extracted from the sample, in order to establish the degree of similarity between the letters from different ostraca. If the writing were homogeneous regarding the different ostraca (HA1), on the one hand, the different distances should show a normal distribution, and they should present dependence of data. And, on the other hand, the associations between the distances and the stratum in which they had been found, the theme and the language of the ostraca should not exist.
Part two. Does the size of the ostraca explain the heterogeneity?
In the second part of this study, in case that the [HA0] could not be rejected, that is to say, if the results pointed to heterogeneity, the source of such heterogeneity would need to be identified. The hypothesis to be tested may be formulated as follows. [HB0] Height and width of ostraca explain the observed variability. [HB1] The size of the ostraca not explain the observed variability. Height and width are dismissed as explanatory variables of the heterogeneity and, therefore, the type of material, the writing instrument and the intent to deceive are left. The aim of this part is to observe whether the ostraca containing big letters are correlated with ostraca which are big in size. And, on the contrary, whether ostraca small in size contain small letters.
Part three. Does material explain heterogeneity?
This third part of the study aims at identifying the source of such heterogeneity, in the event that distances were heterogeneous and [HB0] was rejected. In any group of texts, the source of the variability observed may be due to different hand writers, different surfaces or different writing instruments. Furthermore, in the event that there was only one hand writer, their intent to deceive could modify the variability observed. From the variables pointed out, this study only takes control of the physical surface. Thus, here is the third hypothesis to be tested: [HC0] The physical surface variable explains the observed variability. [HC1] The physical surface variable not explain the observed variability. In other words, the variability observed is due to different hand writers, the writing instrument or the intention of modifying the writing of a single writer. Not rejecting the hypothesis of the variability explained due to the physical surface [HC0] leads us to the existence of a single writer, without getting to prove it (Figure 2). And consequently, it provides evidence of the falseness of the texts of the ostraca. Rejecting the hypothesis of the variability explained due to the physical surface [HC1], without getting to prove it, provides evidence of the existence of several hand writers, the existence of several writing instruments or the existence of a single writer with intent to deceive. The existence of several writers provides evidence of the authenticity of the texts written, without considering it a proof, of course.
Part four. Relationship between other factors and heterogeneity
In this last part, an attempt will be made to describe the variability observed in the following factors: ostraca factor, stratum where they were found factor, theme factor and language factor. Those are factors which cannot be the cause of the variability of the distances measured. An attempt will be made to describe whether the different modalities of the factors present homogeneous or heterogeneous distances. For instance, if texts show heterogeneous distances in different strata, it will not be correct to confirm that it is the stratum what directly affects the distances. Quite the opposite, there is another variable that has not been observed, which makes it possible for the distances of the letters of the texts on different strata to be different.
Part five. Possible scenarios
An attempt will be made to create coherent scenarios that interpret the results obtained. Theoretical framework The studied allographs are: (23 allographs): “A”, “B”, “C”, “D”, “E”, “F”, “G”, “H”, “I”, “J”, “L”, “M”, “N”, “O”, “P”, “Q”, “R”, “S”, “T”, “V”, “X”, “Y” and “Z”. Regarding the ostraca on scale, there are not more allographs, those are the only ones. There is not any lower case character. In this article, the word character is any symbol trying to represent an allograph; any of the above listed, whether it is repeated or not. The following example helps distinguishing an allograph from a character: in the text “NIIV MI TA RIIBA II LABA”, there are 19 characters and 9 allographs (N, I, V, M, T, A, R, B and L). There may be writing on both sides of the ostraca. In this article, ostraca refer to shreds which have writing on them. That is to say, an archaeological object with writing scratched into both sides will be considered as two independent ostraca. According to several authors [4-7], the most important allograph features, to be analyzed by the researcher are as follows: arrangement; class of allograph; connections; design of allographs (alphabets) and their construction; dimensions (vertical and horizontal); slant or slope; spacings, intraword and interword; abbreviations; baseline alignment; initial and terminal strokes; punctuation (presence, style, and location); embellishments; legibility or writing quality; line continuity; line quality; pen control; writing movement (arched, angular, interminable); natural variations or consistency; persistency; lateral expansion; and word proportions.
It is important to point out that the studies carried out by those authors are neither on texts written on ostraca nor on writings obtained through eliminating apart from the surface of the writing. In the study that analyzes two texts written by each of the 21 writers analyzed, Lizeaga [8] establishes that the relative height and width are individual and distinguishing features of at least 19 writers, even 21, depending on the statistical technique applied. This study is far from being considered a writer identification study. Among many studies on the analysis of manuscripts in the case of the ostraca found at Iruña-Veleia, an attempt was made to extract the micro-features described by Srihari [4] and, in addition, the letters written on the ostraca were characterized by the micro-features described by that author. The majority of the micro-features were non-existent in those ostraca, and the variability of the micro-features was extreme. Among those micro-features that were actually found, there were not any homogeneous characteristics with regard to the same ostracon. Therefore, the procedure suggested by Srihari was unsuccessful when analyzing those ostraca. Among the causes for failure in the application of the techniques suggested by Srihari, the fact that letters were written in upper case should be taken into account, along with the writing techniques used, the private character of the texts, which gave the author greater freedom regarding the geometry of allographs.
With regard to historical writings on hard writing surface by grooving, the following studies should be pointed out. On archaeological material and, specifically, on Athenian inscription, Tracy [9-12] established that, currently, it is possible to identify ancient letter-cutter individuals. The author studied hand writers in Greek decrees of 2nd and 1st centuries B.C. Those were text written by chisel and with great skill by a mason. By applying criteria such as careful appraisal, profile of letter and uniformity, the author assigned several inscriptions to one specific author. That technique assumed that stonemasons reveal individual characteristics. Tracy observed that the texts he analyzed were written freehand with the help of some guidelines. In more recent studies, other authors [13-15] suggest techniques for segmenting the images of characters, removing the outline and comparing through various statistical techniques in order to identify writers, regarding texts written on hard surfaces by eliminating substrate.
An attempt was made to use those methods, but there were negative results. The 77 inscriptions haven’t been photographed according to a strict protocol and the owner of the ostraca does not allow to take new photos. Different resolutions, focusing, brightness and contrasts require to use different algorithms to segment the letters of the different ostraca, with non-controlled effects for statistical treatment. Moreover, the texts of the ostraca are private, they were not written by artists, but by people/ person who lacked expertise and had little experience, for the writer did not care about the aesthetics of letters. Those texts are not aimed at being read. What is more, from the statistical point of view, for instance, there is a maximum of 12 characters for the allograph “A” and five characters of the allograph “A” on average. Method of measuring Taking into account that there were not many letters of each allograph along with the specific features of the ostraca, an attempt was made to look for measurable common features for all the allographs and all the texts of each ostracon. These are the three distances measured:
d1) The height of letters. It is the height of the imaginary rectangle that forms the letter.
d2) The distance between letters in the word, or the distance to the following letter. It is the distance between the imaginary rectangles that form two contiguous letters in the same line and word.
d3) The distance between lines of writing, or the distance to the letter above. It is the distance between the imaginary rectangle of a letter in a line and the rectangle of the letter which is right below it in the following vertical line.
At the beginning of the study, in a coordinate system, distances were calculated so that the maximum of a coordinate was deducted from the minimum. It was observed early that it complicated the aims of the study. That is why the rectangle that generates each letter was studied and interpreted. An attempt was made to always interpret the intention of the writer. The measurement of the rectangles that generate letters is subjected to bias. In those type of materials, writing texts by punch, which tears material from the substrate, led to chip the material deeply, what lengthened, narrowed or masked the stroke. A very strict definition, based on pixels, of the distances would lead to biases in the study due to the punch and the undesirable substrate. That is to say, a measurement of the letters by an automatic system may distort the intention of the writer. Let us not forget that those are writings by people who had little expertise and texts were private. At least the biases created owing to the human measurement are smaller than those owing to the nature of the material
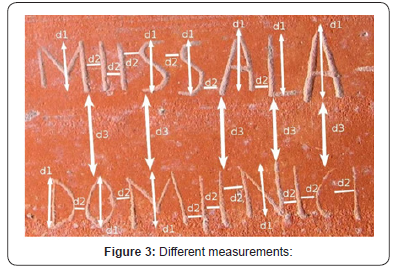
It is important that there was not any change of measurement criteria when the measuring the distances. Criteria were respected throughout the study, for there was only one person who measured all the distances. After all, this study aims at comparing whether there are any groups of very high or very low letters. That is, whether there are groups of very wide or very narrow spaces. And whether there are groups of very wide or very narrow line spacing. Or, on the contrary, whether there is one single group of height of letters, one single group of spacing between letters and one single group of distance between letters. From that point of view, the measurement error introduced by a meter would be equally distributed in the aforementioned groups if there were any. In other fields, such as dendrochronology, in which the growth rings of trees are measured with the purpose of dating historical objects, the width of rings is measured according to the researcher’s criteria and very strict automatic measurements are of no use. Regarding these photos, which have different features, very strict measurements of the distances led to the creation of many undesirable issues and artifacts. This work was based on the photographies of the ostraca (Figure 3).
After selecting the handwriting sample to study, the three distances were measured separately. The three distances of letters were measured using the application On Screen Measurement [16]. This is a software specialized on measuring growth rings of a tree on high-resolution scanned images. The application OSM makes it possible to create tiedown points with the purpose of measuring on straight lines. Besides, it creates reference lines to keep the required perpendicularity. The following link https:// www.youtube.com/watch?v=Mp4egetsPkE shows a video on the procedure for measuring the three distances. An attempt was made to imagine how the writer would have written that character. In order to avoid possible distortions of the study, allographs which overlapped, were not identifiable or lacked proper writing were not measured. There is another free application for similar purposes called ImageJ [17].
Studied material
Nowadays, those ostraca are held by the Deputation of Araba (regional government) and it is not permitted to study that archaeological material. Thus, we were obliged to carry out this study based on scale photographs of the archaeological objects. Those ostraca containing text which were in a well-known scale were selected. 65 ostraca were studied, there being a total of 77 sides containing writing on them, and 1608 heights, 1051 distances between letters and 836 distances between lines in the text were measured. Table 1 shows the amount of letters of each ostracon. The file of measures of all the ostraca are in Zenodo repository [18]. The file of photos of all the ostraca are in Zenodo repository [19]. After selecting the sample to be studied, the height of letters (d1), the distance between the adjacent letters (d2) and the distance between letters in different adjacent lines (d3) were measured. Fig. 3 represents every measurement on an ostracon. In the case of the distance between adjacent letters of the same word, the measurement was conditioned by the character. For instance, the majority of “T” letters were on top of the previous or the following letters.
When the distance between letters was non-existent or doubtful, it was neither measured nor included in this study. With regard to curved allographs or gradient distances, an attempt was made to put oneself in the writer’s place and imagine the space that person would assign. Regarding the distance between letters from different adjacent lines, the procedure used for measuring was the same as the one used for measuring the distance between adjacent letters. The resolution of the images was a non-controlled variable. The rank of the distance d1 varies between 0.17 cm and 3.1 cm. The attributes of the writing surface, language, stratum and theme were given by the archaeologist Idoia Filloy, who was deputy director of the excavation of the archaeological site, and they were consulted on the Internet in the Ostraca base database [1]. The writing surfaces of the ostraca may be: Clay (one ostracon), Amphora (one), Storage Pottery (one), Common Pottery (23), Bone (seven), Brick (13), Common Mortar (three), Cooking pot (one) and Hispanic Terra Sigillata (27).

There are ostraca containing writing in Latin (44), in Basque (30) and in both languages (three). And the range of themes may be the following one: Anthroponym (five), Classic (eight), Creed (three), Christian (17), Egyptian (four), Sentence in Basque (19), Lists in Basque (three), Myths (five), Roman Religion (four), Text in Latin (three) and Non-classified (six). They were found: in sector 12 (stratum 12007) 1 ostracon; in sector 3 (stratum 3001B) one ostracon; in sector 32 15 ostraca (in the stratum 32005A, six ostraca; in the stratum 32005C, nine ostraca); in sector 5 (stratum 51144) 32 ostraca; in sector 6 (in the stratum 6076 21 ostraca, in the stratum 6180 five ostraca, in the stratum 6181 one ostracon) and in sector Finca 95 one ostracon. Statistical analyses Taking into account the different nature of the data, here are the statistical techniques used:
Analysis of autocorrelation between the height of letters
That is to say, the existence of spatial independence, linear autocorrelation, strictly speaking, between the height of adjacent letters. Sometimes, the knowledge of the height of a letter provides one with the information about the height of the following letter. This phenomenon is known as spatial autocorrelation [20]. Among the possible causes for that autocorrelation, one may think that the writer would look at the last letter or the previous letters written to draw the next one. Two types of autocorrelation may be found, a negative autocorrelation in which the height of letters alternates, for the writer corrects the heights. And a positive autocorrelation in which high letters precede high letters and reversed. In that case, interpreting it is more difficult. Therefore, first-, secondand third-order autocorrelation coefficients were calculated by using the “acf” function of the application R [21]. 0.95 confidence bands regarding the value of the coefficient of autocorrelation were estimated in a distance of 2/√N where N was the number of letters on the ostracon. Regarding the ostraca, only the firstorder coefficient was significant.
Correlation Between the Distances and The Size of The Ostraca
Regarding those ostraca without autocorrelation that have a normal distribution, the R² coefficient of determination was calculated regarding the linear model. The response variables were d1, d2 y d3, whereas the width and the height of the ostraca were explanatory variables.
Statistical Normality
The next question to answer was whether the set of all the letters from the ostraca showed a normal distribution regarding different distances. Due to the need for independence of data, ostraca containing autocorrelated letters were not included. The boxplots of the mean of the distances measured in each ostracon were extremely useful tool. Another technique regarding the determination of statistical normality is the goodness-of-fit test called the Shapiro-Wilk test [22]. It is a test in which it is not necessary to specify the parameters of the normal distribution in the null hypothesis of normality. The non-normality of the three distances in the majority of modalities of writing surface, stratum and theme showed that it should be observed whether part of this variability was associated to the levels of the different factors to know: writing surface, language, stratum, theme and ostracon. Thus, the appropriate statistical technique to apply was the analysis of variance.
Analysis of Variance
According to Ugarte [22] the distances would be the variable response, letters would be the experimental units and the ostracon, the writing surface, the language, the stratum and the theme would be the factors. The hypothesis were contrasted, in which the model was as follows:
H 0 :1=...=k in the null hypothesis, it was established that the measurements of the distances of the levels of the factors were equal and the alternative hypothesis was that at least the mean of a level was different to the rest H 1 : ∃μi≠μ j for some i≠ j . The model regarding the null hypothesis was as follows:
yij=μ+ εij In which yij the distance j of the level i . μ was the average of all the differences measured and εij was the error due to randomness of the distance of the level i .The model of the alternative hypothesis was as follows:
yij=μ +α j +ε ij
In this case, α j was the effect of the modality j . As the model did not admit autocorrelated data, 11 ostraca were removed regarding d1 distance, three regarding d2 distance and 10 regarding d3 distance.
Another aspect that was taken into account was the heterocedasticity of the measurements, that is to say, when the expected value of the variance depends on the value of the measurement of the sample. Ostraca containing letters of great mean distances had high variances and in reverse. In order to carry out an analysis of variances, the variances needed to be homogenized. Thus, logarithms of the distances were calculated (20) by which homoscedastic data were obtained.
Analysis of relative height of the different allographs
That is to say, observing whether the relative height of some allographs with regard to others (A, B, C...) was similar in different ostraca [8]. It was questioned whether the information about the height of different allographs could be used. Each handwrite might have had a characteristic distribution of the height of the different allographs. For example, one writer might have written the letter “S” especially high, and the letter “Q” especially low. In that case, the two ostraca analyzed had a similar profile. With the purpose of obtaining a sample of the height of the homogeneous allographs, regarding the mean and the variance, the height of all the letters from all the ostraca was standardized by subtracting the mean of each ostracon and dividing it by the standard deviation (to obtain a normal distribution N(0,1)) of each ostracon. That mean value of each allograph was called the mean ostracon character. Those allographs whose relative height was higher than that of the mean of the allographs from the texts would have a standardized positive value, and those allographs whose mean height was lower than that of all the allographs from the ostraca would have negative indexes.
Afterwards, all the allographs from the ostraca were gathered. That series was called Mean Allograph Vector (MAV) of the ostracon. For instance, if the letter “B” appears five times on an ostracon, the mean of the standardized values of those five “B”s had to be calculated. Subsequently, the set of the mean values of the allographs “A”, “B”, “C”,... was called MAV of that allograph. Then, the MAVs from those ostraca containing more than 10 different allographs were compared. By calculating the correlation between the MAVs from different ostraca, an attempt was made to search for similarities.
Results (Appendix A)
Independence of data or autocorrelation
From a total of 77 objects containing writing, 11 showed autocorrelations with a significance level of 0.95 regarding the height of letters (d1): 11139, 11429, 11530A, 11530B, 13364, 11267, 11425, 13380, 13382B, 15923, 16362B. On the contrary, the remaining ostraca (66), in which there were 15 measurements at least, did not show autocorrelation. That is to say, the following letter did not provide with any information concerning the height of the letter measured. Regarding the distance between letters (d2), just three out of 73 ostraca with sufficient measurements of distance between letters showed autocorrelation: 11423, 13397B, 15912. Principally, they did not show spatial autocorrelation. Regarding the distances between different lines (d3) in the text on 10 ostraca, from a total of 54, significant 0.95 autocorrelation was observed: 11139, 11429, 11530A, 11530B, 13364, 11427, 13368A, 15912, 15921, 163653. On the contrary, the remaining 44 ostraca did not show any autocorrelation. Therefore, the dependence between the data was different with regard to the different ostraca, and, moreover, any association of the autocorrelation could not be established by looking at features such as language, theme, stratum or writing surface. There are five ostraca which show autocorrelation regarding d1 and d3. It is thought that ostraca containing a greater number of letters reveal tendency towards autocorrelation.
Regarding autocorrelation, a diverse reality may be observed.
Correlation between ostraca and distances Correlation between the size of the ostraca and the distances
The coefficients of multiple determination (R²) were: d1~width+height 0.30; d1~ width+height 0.26 and d3~width+height 0.25. The coefficient of determination measures the fraction of the variance of response variable which is explained by linear model. It is observed that the height and width explain more or less 30 per cent of the variability observed. It should be noted that the measuring width and height of the ostraca was not simple owing to the irregularity of the dimensions of the material. In case of doubt, the space available for writing was estimated as the value of that dimension.
Statistical Normality
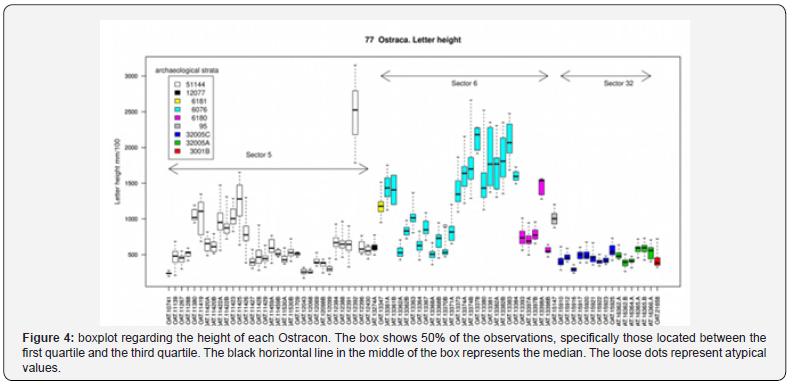
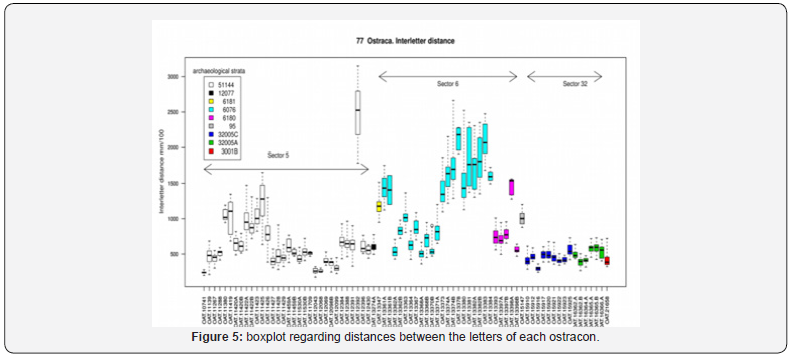
There were several ways of analyzing normality: the first one regarding all the letters measured in all the units was to use the Shapiro-Wilk test of normality. Regarding d1 distance of the set of all the letters from all the ostraca, the result of the test was a p-value equaling 0. As a consequence, the normality hypothesis with regard to the height of letters was rejected regarding the set of letters from all the ostraca together. Regarding the distances d2 and d3, the results of the Shapiro-Wilk test of normality were similar to those of the distance d1. The set of letters regarding the three distances studied did not show a normal distribution. Normality may be analyzed differently regarding the letters of each individual ostracon . Figures 4-6, shows the great heterogeneity of the distances of the ostraca via bloxplot representation. In the boxplot, each box represents a unity of ostracon, it may be easily observed that boxes were grouped together regarding zones in the graphic which corresponded to archaeological sectors and stratigraphic strata. Furthermore, the Shapiro-Wilk test was used to measure the normality of distances of each ostracon separately. The sample would be formed by those ostraca which did not show autocorrelation and those which had more than 10 letters. stratum and theme, and the three distances studied. Modalities of more than 3 ostraca. In brackets, the number of ostraca included in the test.

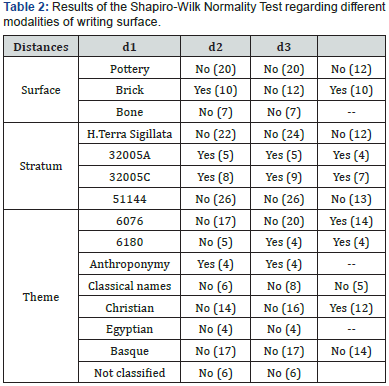
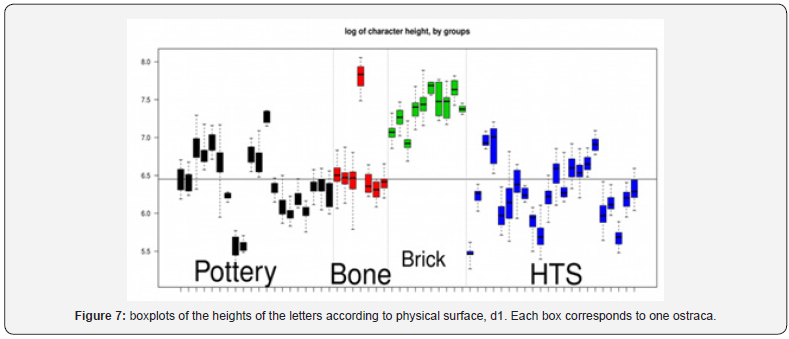
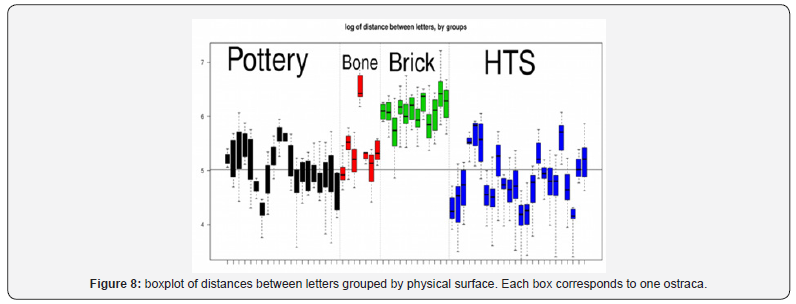
Applying the Shapiro-Wilk normality test with regard to the d1 distance of each individual ostracon resulted in high p-values, and the normality hypothesis could not be rejected regarding each ostracon. There were only three exceptions 13380, 15921 and the ostracon 21658, in which the normality hypothesis could be rejected. The distribution of d2 distance between letters of each ostracon individually was normal. And regarding d3 distance, there were only 2 ostraca that did not present a normal distribution in the distance between lines, ostraca 15921 and 11530A specifically. It was interesting to know whether the different distances showed normality or not in different materials, in the different strata found, and regarding the different themes these ostraca dealt with. As individual ostraca showed normality, just those modalities of more than 3 ostraca were taken into account. Results of the Shapiro-Wilk test were summarized on Table 2. In the hypothesis HC it is contemplated whether the materials containing writings were the cause of the heterogeneity. Boxplots (Figures 7-9). may be helpful to clarify it. In those boxplots, homogeneity was not observed regarding various materials containing writings.
Analysis of Variance (ANOVA)
Results were summarized on Table 3. Regarding the height of letters (d1), when analyzing which one of the factors explained greater amount of variance, the own ostraca stood out with 90 per cent of the total variance. Furthermore, it was found that the theme and the type of writing surface explained approximately 50 per cent of the total variance, respectively. Regarding the type of writing surface, the explained variance (R²) was calculated with regard to modalities, removing each modality successively. Results showed that without the ‘brick’ modality, the coefficient of determination or the explained variance was 22%. The ‘brick’ modality was rather homogeneous, and therefore, special, for it was the one that contributed the most to the rejection of the hypothesis of equal means. With regard to the factor theme, the explained variance was calculated, removing each theme successively, but there was not any level that contributed to the explanation regarding variance.
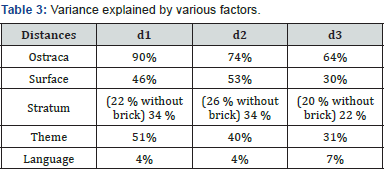
That was due to the high variability found in all the themes. Finally, the different strata explained the low variance observed (34 per cent) and the languages of writing explained an even lower variance (4 per cent). With regard to the distance between letters (d2), when analyzing which one of the factors explained greater amount of variance, the own ostraca stood out with 74 per cent of the total variance. In addition, it was found that the type of writing surface explained 53 per cent of the variance. Regarding the type of writing surface, the explained variance (R²) was calculated, removing each modality successively. Results showed that without including the ‘brick’ modality, the analysis only explained 26 per cent of the total variance. Therefore, the ‘brick’ modality was rather homogeneous, and consequently, special. Both the thematic differences of the ostraca and the different strata of the ostraca found as well as the language were intrinsically heterogeneous, and it was not possible to distinguish any modality, and it explained low variability.
With regard to the distance between line (d3), when analyzing which one of the factors explained greater amount of variance, the own ostraca stood out with 64 per cent of the total variance. Moreover, it was found that each the type of writing surface and the theme explained approximately 30 per cent of the variance. Both the different writing surfaces and the different themes of the ostraca as well as the different strata of the ostraca found, and the language were intrinsically heterogeneous, and it was not possible to distinguish any modality. Regarding the three distances, the ostracon factor was clearly the one that explained most variability, 91per cent. The type of writing surface, stratum and theme were far behind. Attention should be drawn to the great number of data of each modality, for in some cases, there were modalities that could have 442 data. Thus, the ANOVA contrast tended to reject the null hypothesis of equal means.
Relative height of different allographs
With regard to relative height, a diverse and heterogeneous reality was again to be observed between the different MAV of each ostracon. Any pattern could not be found. Many correlations were negative. On the other hand, there were few correlations between positive MAVs, and any coherent set was obtained.
Summary
Summing up the set of results, it may be observed that the analyses of the autocorrelation of the 3 distances showed that there were some ostraca that showed autocorrelation and some others that did not. In addition, the autocorrelated ones could have positive or negative correlation. On the other hand, the analysis of normality established that each ostracon mainly had a normal distribution with regard to the three distances measured, but the whole did not have a normal distribution. The ‘brick’ type of writing surface regarding d1 and d3 showed normality in distances. The stratum “32005A” regarding d1, d2 and d3, the stratum ‘32005C’ regarding the three distances, the stratum ‘6076’ regarding d3, and finally, the stratum ‘6180’ regarding d2 and d3 showed normality. With regard to the theme ‘Anthroponym’ regarding d1 and d2, and the theme ‘Christian’ regarding d3 showed normality. The ANOVA showed that the greater variability was the one explained by the individual ostraca, with regard to the writing surfaces, the ‘brick’ modality was the one explaining greater variability and the rest of modalities were not very important with regard to heterogeneity. Regarding language, the variability of each language was similar. The variability explained by the strata approached 33 per cent. Finally, the different themes did not explain much of the variability observed, between 30 per cent and 50 per cent. The analysis of the relative height of different allographs showed a great diversity once again, without the existence of any pattern.
Discussion and Conclusion
Part one
According to the results obtained and with regard to the null hypothesis of the study:
[HA0] The characters of the texts are heterogeneous regarding the three distances measured
It can be claimed that the results of the four analyses shown did not give signs to reject the null hypothesis of heterogeneous texts with regard to the three distances. Texts were heterogeneous regarding the three distances.
Part two
The analyses of correlation between the distances measured and the size of the ostraca explain 25-30 per cent of the variability observed. Therefore, there is still 70 per cent is to be explained. We may partly affirm that there are enough signs to reject hypotheses HB0.
Part three
According to the results obtained and with regard to the null hypothesis of the study: [HC0] The variability observed is explainable by the physical surface variable. The boxplot (Figure 7) ostracon/surface regarding d1 shows that the ‘brick’ modality, in general, presents letters which are higher than those in other modalities. Moreover, it is rather homogeneous. It is interesting to point out that the brick ostraca were all found in ‘sector 3’. With the exception of one, the ‘bone’ modality is homogeneous regarding average height of similar letters. ‘Pottery’ and ‘HTS’ modalities are heterogeneous and have wide variances. The boxplot (Figure 8) ostracon/surface regarding d2 shows that in the ‘brick’ modality distances are bigger compared to the rest, which present general narrow variance. The ‘bone’ modality is heterogeneous and ‘pottery’ y ‘HTS’ modalities are heterogeneous and have wide variance. The boxplot (Figure 9) regarding d3 ostracon/surface shows high variability in all four modalities.
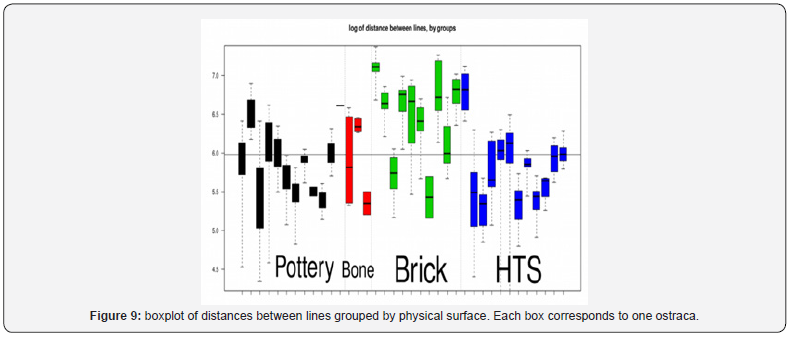
The ‘brick’ modality explains 24 per cent of the variability observed regarding d1, 27 per cent regarding d2 and 10 per cent regarding d3. Then, the variances assigned to the ‘brick’ modality, to the size of the ostraca and to the different modalities of substrate were deducted. After those calculations, there was still 49 per cent of the initial non-assigned variance regarding d1, 48 per cent regarding d2 and 56 per cent regarding d3. For instance, regarding d1, the ‘brick’ modality explains 24 per cent of the variance, and without the ‘brick’ modality, sizes explain 20 per cent of the total variance. All of that together with the analyses of autocorrelation, correlation, variance, normality and the analysis of relative height of letters leads us to reject hypothesis [HC0]. It should be noted that the ‘brick’ modality, which was located in ‘sector 6’, is an internally homogeneous group, which distinguishes from the rest of modalities. The ‘brick’ modality has higher letters and bigger distances between letters in addition to a more variable lead.
Part four
These are the variables which are not the cause of the differences observed in the distances; that is, the variables which correlated with distances.
Sector and Stratum
It was observed that the stratum ‘32005A’ and the stratum ‘32005B’ presented normality. Those two strata were different layers of the same profile. Furthermore, in ‘sector 6’, there were various types of ostracon according to distances. All of the brick ostraca were found in that sector. In ‘sector 5’, 4-5 groups of ostraca could be established according to their size.
Theme
Only the ‘anthrophony’ modality was a homogeneous group. The rest of the modalities were internally heterogeneous.
Language
The variability observed regarding each language led us to create distinguished groups with the language factor.
Part Five
In the analyses carried out, there was still 48 per cent of the variance to be explained regarding d1, 48 per cent regarding d2 and 56 per cent regarding d3. There were four possible scenarios to explain the variance observed, which was not explained by the size of the ostraca or the ‘brick’ modality. It should be noted that part of that variance is residual, that is to say, it is due to randomness and it is not attributable to any factor. It should be noted that this study does not conclude that the suggested scenarios have to be accepted or rejected. Moreover, the possible mixture of the scenarios suggested should be observed. With regard to the non-controlled or unknown variables, this part of the study enumerates the various scenarios that could explain the observations made regarding these 77 ostraca.
Several Handwrites
As the ostraca have the greatest power to predict the variance, it is interpreted that there were different handwrites regarding the various ostraca. Ostraca found in ‘sector 32’ may be associated with the same handwrite. It may be interpreted that in ‘sector 5’ there are 3-5 handwrites. In ‘sector 6’, there are 2-4 handwrites. In ‘sector 6’, the letters of the two strata are different, what leads us to interpret that there are various handwrites regarding those two strata. Within that sector, the ‘brick’ modality may be associated with one handwrite. In ‘sector 32’, the distances of the various strata do not differ. It may also be interpreted that there is one hand writer regarding the theme ‘antrophonym’, whereas there are several handwriters regarding the rest of the themes. This is the most probable. The fact that there were various handwriters may perfectly explain the groups observed.
One Or A Few Handwrites With Intent to Deceive
With regard to this interpretation, all of the ostraca were made by one or two authors with intent to deceive or to hide their guilt. The author who attempted to deceive was very careful not to be revealed by a forensic study on handwriting, so they changed the size of letters on purpose and created a set of random groups at the entire archaeological site. This intent to deceive is what causes 40 per cent of the variability observed.
That scenario is rather improbable and far-fetched to explain everything observed. Up to now, there is not any type of work on the analysis of handwritten letters on ostraca. Therefore, the faker would have to foresee this study was going to be carried out in order to mask their writing. Moreover, although that same author was very careful regarding handwriting, they were not so careful regarding the themes chosen and the grammar of Latin and Basque.
Various Writing Instruments
In this scenario, the cause of the various results obtained is the writing instrument: the punch. Different instruments result in different groups of size of letters, distances between letters and distances between lines. In this scenario, it was predicted that different tools had been used to write on ostraca of different substrates and on ostraca of different strata, which were found in different sectors. The thickness of the point of the instrument may have varied the size of the writing. In that scenario, there would be 4-6 writing instruments at least, which were used in different groups of ostraca: one instrument regarding bricks in ‘sector 6’, another instrument regarding objects which are not made of brick in ‘sector 6’, another instrument in ‘sector 3’ and several instruments in ‘sector 5’.It is difficult to get to the bottom of the reason why using various writing instruments results in different writing sizes on these ostraca. That scenario leads us to think that various handwrites might have used different instruments in different times (strata), what points to Occam’s razor. The alternative is a faker in the team of archaeologists, who works with different instruments on different strata and materials of different times. That is a possible explanation, yet it is very unnatural.
Unresolved Issues
In this study, only 77 ostraca could be analyzed out of approximately 450 with texts written on them. Future studies should include the rest of the ostraca up to 400. A method to measure the distances analyzed more strictly should be studied. In order to achieve a strict and effective definition of the distances, texts should be written on the same material (bones, HTS, brick, pottery), without any value, by using various writing instruments and writing a great number of letters; perhaps up to thousands of them. Defining distances in various ways and then studying the definitions of the distances is essential to minimize biases and errors. That is, determining the effect of different definitions of the distances defined in this study in an experimental way. Furthermore, experiments should be carried out with material of different sizes and with different substrates, writing tools and people. Consequently, the effects of each factor on the size of letters should be studied as well. It should be noted that the quantification of the residual variance which could not be assigned to any factor is an unresolved issue.
The study does not establish whether the substrate is an eliciting variable or a correlated variable with regard to the size of letters and its relationship with the handwrites. What is more, it was not established in which way ‘brick’ may affect the size of letters, if it were an eliciting factor of the large size of letters, taking into account that some bricks had been written on before being baked. The ostraca with the greater amount of letters seem to be more likely to autocorrelated. Nevertheless, it should be studied further. In addition, the individuality of writing on handwritten ostraca was not established with scientific rigor. These days, the hypothesis of individuality of the distances studied must be experimented, structured, tested and peer reviewed. It is necessary to take high resolution photographs under controlled conditions to all texts.
The author of the article appeals to the owner of the ostraca to carry out neutral laboratory analyses of the bones and bricks. That is, carrying out the analysis of letters and various ostraca which hide letters. After 10 years, those analyses have not been carried out yet.
To Know More About Journal of Forensic Sciences & Criminal Investigation Please click on: https://juniperpublishers.com/jfsci/


No comments:
Post a Comment