International Journal of Environmental Sciences & Natural Resources Juniper Publishers
Authored by Antensay Mekoya*
Abstract
Evaporation is major component of global water cycle and water balance of a small/large irrigation area, reservoir or lake, and a catchment. In this study, evaporation from Class-A pan (Ep) for the years from 2004 to 2013 at Tharandt, Germany is calculated and analyzed using daily and ten-minute Class-A pan water level data from automatic measuring pressure sensor instrument.
Daily Ep is first calculated at two different times; at 7 a.m. and at midnight. Because daily Ep calculated at 7 a.m. had shown less errors as it had fewer negative values (n = 43 out of a total of 2145 values) than Ep calculated at midnight (n = 84 out of a total of 1971 values); Ep calculated at 7a.m. is selected for the calculation of Ep. The correlation between Ep calculated at midnight and Ep calculated at 7a.m. was ‘very good’ (R2 = 0.87, MSE = 0.32mm d-1). Therefore, Ep calculated at midnight is used for filling as well as for correcting Ep calculated at 7 a.m. values. Accordingly, missing values of daily Ep at 7a.m. are filled using 0.908 × daily Ep at midnight values + 0.385 (Eq. 7). In Eq. 7, the cause for non-zero offset (0.385) could be instrument error. Assuming no instrument error, out of 1836 days, Epd which is the difference between 7a.m. and midnight Ep (see Figure 1) was larger than zero for 1184 days (64.5% of the days). This means out of 1836 days, for 64.5% of the days next day ‘night time’ Ep was greater than its previous day ‘night time’ Ep. Also, for at least 54 days |Epd| ≤ 1.5mm d-1 which means that the ‘night time’ daily Ep had to be ≥ 1.0mm d-1.
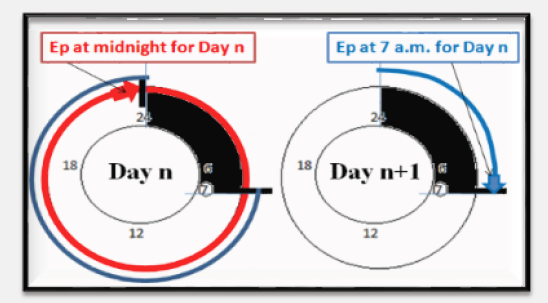
Figure 1: Understanding Epd which is daily Ep at 7 a.m. (‘blue’) minus daily Ep at midnight (‘red’) for day n.
Finally, 2098 daily values of Ep are calculated from March to November for the available data; however, only the summer half year (April to September, n=1702) values of Ep are mainly used for most of the analysis.
Generally, the accuracy of the self-recording ten-minute and daily water level measurements from Class-A pan at Tharandt from 2004 to 2013 can be considered as very good. However, the measurement should be carefully checked as it might have sensitivity to other than pressure or water depth difference in the pan. Hence, the sensitivity of the pressure sensor instrument at 7a.m. and at midnight for same pressure (depth of pan water) might have slight difference.
Keywords: Tharandt; Class-A pan Evaporation (Ep); Ep at 7 a.m. and at midnight, Epd
Abbrevations: Ep: Class-A Pan Evaporation (Ep); Epd: Ep at 7a.m. minus Ep at midnight; ET: Evapotranspiration; V: Water Level at 7 a.m.; P: Precipitation at 7a.m.; V’: Water Level at Midnight; RF: Precipitation at Midnight; NSE: Nash-Sutcliffe Efficiency; MAE: Mean Absolute Error; RMSE: Root Mean Square Error; RSR: RMSE-Observations Standard Deviation Ratio; MPE: Mean Percent of Error; ‘night time’: The Time between Midnight and 7 a.m.
Introduction
Measured and estimated evaporation data has been in use by agricultural, hydrological, hydro meteorological, irrigation and soil and water conservation applications. Evaporation or evapotranspiration (ET) which is a major component of the global water cycle and the hydrologic budget or water balance of small or large irrigation area, reservoir or lake and a catchment is important consumer of energy. On average, across all continents about 70% of precipitation reaching the land surface evaporates; in dry regions (e.g., Australia) this ratio is higher and can reach up to 90% and in Europe to approximately 60% of the annual rainfall (Nova´k 2012 & Baumgarter and Reichel, 1975) [1,2].
Measured and estimated evaporation data has been in use by agricultural, hydrological, hydro meteorological, irrigation and soil and water conservation applications. Evaporation or evapotranspiration (ET) which is a major component of the global water cycle and the hydrologic budget or water balance of small or large irrigation area, reservoir or lake and a catchment is important consumer of energy. On average, across all continents about 70% of precipitation reaching the land surface evaporates; in dry regions (e.g., Australia) this ratio is higher and can reach up to 90% and in Europe to approximately 60% of the annual rainfall (Nova´k 2012 & Baumgarter and Reichel, 1975) [1,2].
Materials and Methods
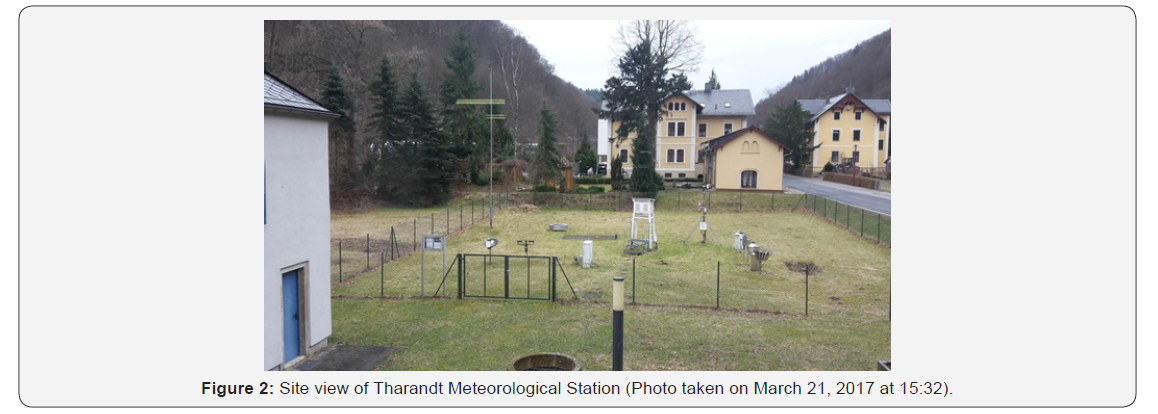
The station is situated in-flat and grass covered area and fulfils the WMO standard for meteorological measurements. This station has special characteristics because it is situated at the bottom of a V-shaped valley and close to an asphalt road, buildings and the Weißeritz River (see Figure 2 & 3). Therefore, it has a reduced sky view factor and consequently sunshine may comparatively reaches the area late in the morning and leaves earlier in the evening resulting in lower sunshine hours. Due to high shelter effects at low level, it is expected that the wind speed at 2m (which was derived from the wind speeds at 3m and at 10m) would have been higher than real values (if actual measurement had been conducted at 2m height).

The pan used for measurement of pan evaporation is a standard Class-A pan evaporimeter (see Figure 3). The readings of the water level in the pan for every 10-minute interval (V’) as well as for daily basis (V) are recorded automatically by a pressure sensor device.
Daily Class-A pan Evaporation at 7 a.m. and at midnight
Using Eq. 4 and using daily water level (V) and the corresponding precipitation at 7 a.m. (P) daily pan evaporation from Class-A pan (Ep) is calculated at 7 a.m. Similarly, Ep at midnight is calculated using 10-minute water level (V’) and daily precipitation at midnight (RF).
The change in water level for a day say d (ΔV’d) at midnight is calculated by subtracting the water level at day d at 23:59:00 hour (V’d) from the water level at previous day (day d-1) at 23:59:00 hour (V’d-1); i.e., images/IJESNR.MS.ID.555778.I001.png Δ can also be calculated by taking the sum of 144 ten-minute water level differences for each day. Both will give same result if V’ has no missing values. Similarly, The change in water level for a day say d (ΔVd) at 7 a.m. is calculated by subtracting the next day (day d+1) water level at 7 a.m. (Vd+1) from the water level at day d at 7 a.m. (V’d); i.e., images/IJESNR.MS.ID.555778.I002.png . Note that those days with missing V or V’ data are excluded in the calculation of ΔV and ΔV’.
Class-A pan Evaporation (Ep) estimation
According to Dingman [3], pan evaporation is calculated using eq. 1 below:

Where,
E pan evaporation (in mm)
P precipitation (in mm) during Δt,
V1 & V2 the storages (in mm) at the beginning and end of Δt, respectively.
According to (WMO 1994 Sec. 9.2), the amount of evaporation that has occurred between two observations of water level in the pan (E) is calculated using Eq. 2 below:

Where,
P the depth of precipitation during the period between the two measurements,
P the depth of precipitation during the period between the two measurements,
Combining Eq. 1 and Eq. 2, we get:

Modifying Eq. 3 and replacing E with Epan or Ep, we have:

Where, Ep is daily evaporation computed as the difference in Class-A pan water level on successive days, corrected for any precipitation and Δd during the period. P, Δd, V1 and V2 are as defined above. For the calculation of daily Ep, Eq. 4 is used throughout this article with Δd = 0 (because of missing Δd values). However, 41 days have information for ‘special features’ (‘Besonderheiten_Daten’) like emptying or drawing out (pumping off) some water, cleaning (e.g. using Anti-Algae chemicals) and refilling of pan (including information about confirmation of no precipitation during the refilling time); removal (fishing out) of grass, seeds, coarse dirt or suspended matter (solids) from the pan; and so forth which are excluded from the calculation of E
Note that the maximum possible value of daily Epan in mm d-1 can be set to be equal to the upper estimate of daily PET in mm d-1 (PETmax) (see Eq. 6). PETmax is estimated to be the extreme maximum value of the ratio of daily net radiation (in MJ m-2 d-1) calculated using Eq. 19 and (daily) latent heat of vaporization (in MJ kg-1) calculated using Eq. 5. It is calculated with the assumption that all the available energy provided by radiation is consumed (used for vaporization).

Where,
λ latent heat of vaporization (in MJ kg-1)
T air temperature (in °C)

Where, Ep_max is the maximum possible upper limit of Ep (in mm d-1), PETmax is the maximum possible upper limit of PET (in mm d-1), λ latent heat of vaporization (in MJ kg-1) and Rn net radiation (in MJ m-2 d-1). For the calculation of Rn refer Appendix A.
Note, however, that the estimated net radiation used in this paper is based on measurements above grass level and that the Class-A pan will have a different radiation balance. Therefore, Eq. 6 can be a suited check for PET estimations according to Haude, Wendling, and Penman and ETo but only a rough check for Ep. Ep_max resulted 7.198 ( 7.2) mm d-1.

Monthly Ep is calculated by aggregation of daily Ep values for months from April to October of each year. Note however that few days at the beginning of April and at the end of October had considerable missing daily Ep values. Hence, the average values of daily Ep for the available ten years (from 2004 to 2013) is used for filling missing daily Ep values of each year (see Table 1).
Results and Discussion
Comparing Class-A pan evaporation at 7 a.m. and at midnight
Daily values of pan evaporation from Class-A pan (Ep) were calculated at 7 a.m. and at midnight using Eq. 4. The calculation was performed for n = 2145 and 1971 days {from daily P and RF data and their corresponding fully available daily (V) and tenminutes (V’) water level data, respectively}.
Generally daily Ep at 7 a.m. resulted in greater values than daily Ep at midnight. It also resulted in less (121) negative values whereas daily Ep at midnight resulted in more (213) negative values (see Table 2). Thus, comparatively Ep at 7 a.m. has the advantage of having a greater number of values with a smaller number of negative values which made it preferable to Ep at midnight. Therefore, Ep calculated at 7 a.m. is selected in this article. Its missing values are filled using Ep at midnight values following the description in section 3.2.
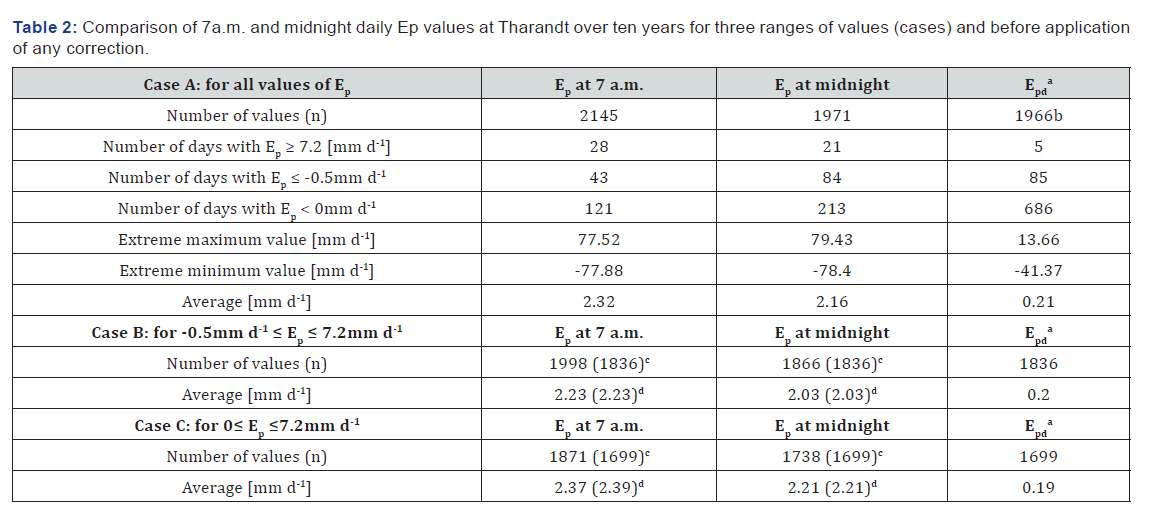
aEpd is used to denote daily Ep at 7 a.m. minus daily Ep at midnight
bout of the 1966 days for two days both Ep at 7 a.m. and Ep at midnight had equal values
cthe number in parenthesis is the number of days where both Ep at 7 a.m. and Ep at midnight had values;
dthe corresponding average value.
To evaluate the error among case A, case B, and case C of Table 2, the methods for comparison and evaluation of models which are discussed in Appendix B are applied by considering the daily Ep at midnight as observation values (i.e., x or Oi) and daily Ep at 7 a.m. as model (estimated) values (i.e., y or Pi).

For all the three cases, the p-value was 0.05 (not shown). It indicated that existence of statistically significant difference between daily Ep at 7 a.m. and daily Ep at midnight values at 5% significance level could not be concluded. In all cases, the MPE was around 7.1%; which means that Ep at 7 a.m. values were relatively larger by 7.1% as compared to Ep at midnight values (see Table 3).
For case A, three ‘goodness-of-fit’ measures (R2, NSE, and RSR) showed ‘very good’ relationship between daily Ep values at midnight and at 7 a.m. (see Table 3). However, the RMSE was comparatively the biggest. Moreover, in case A (see Table 2) daily Ep at 7 a.m. and at midnight resulted in 43 and 84 days with Ep ≤ -0.5mm d-1 and in 28 and 21 days with Ep ≥ 7.2mm d-1, respectively. Thus, comparatively, using case B or case C was better than using case A. Overall, it can be concluded that case B was the best because it had the advantage of using more values with better NSE and RSR as compared to case C.
Note that in this article the minimum possible Ep from Class-A pan for the climate condition of Germany is limited to ≥ -0.5mm d-1 in an assumption that there could be a maximum condensation of up to 0.5mm d-1. Similarly, the maximum possible Ep, as calculated using Eq. 6, is limited to ≤ 7.2mm d-1 [5-12].
Filling missing values of Ep at 7 a.m.
Case B resulted in a regression equation (see Eq. 7and Figure 4) which is used for filling the missing values of daily Ep at 7 a.m. by using daily Ep at midnight values as given below:

In Eq. 7 a zero offset was expected; however, an offset of 0.385 had resulted. The cause for non-zero offset might be instrument error; the sensitivity of the pressure sensor instrument for same pressure (depth of pan water) at 7 a.m. and at midnight might have slight difference. Assuming no instrument error, for example for case B, out of 1836 days, Ep at 7 a.m. was larger than Ep at midnight for 1184 days (64.5% of the days). Note also that R2 = 0.87 in Eq. 7 indicates that daily Ep at 7 a.m. explains 87 % of the variability in the observed data (daily Ep at midnight values).
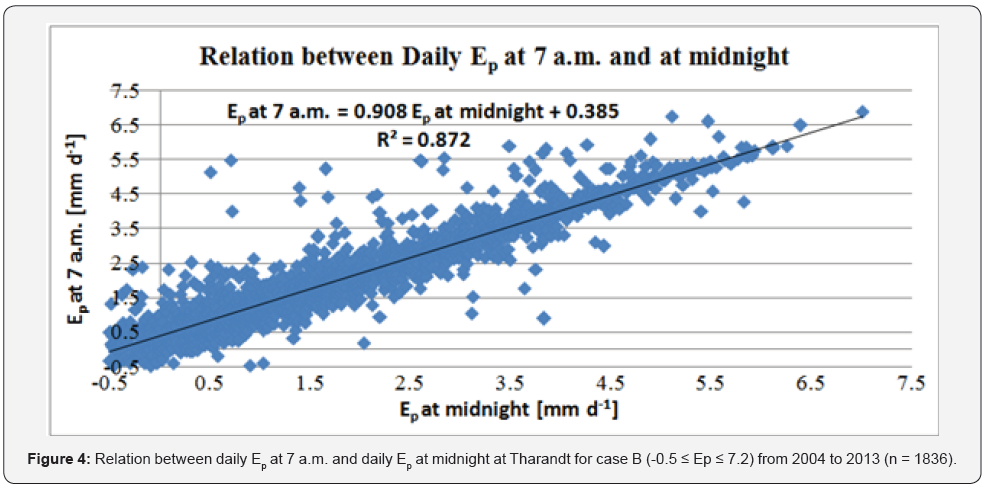
Therefore, out of 2145 daily values of Ep at 7 a.m. the values which are missing and were not in the range between -0.5 and 7.2mm d-1 are corrected using 1971 Ep at midnight values (Table 2). Accordingly, 24 values of Ep at 7 a.m. are filled or replaced using Eq. 7 while other 47 values are omitted and 2098 (2145 minus 47) values of Ep at 7 a.m. are used for next analyses.
Estimated class-A pan evaporation (Ep)
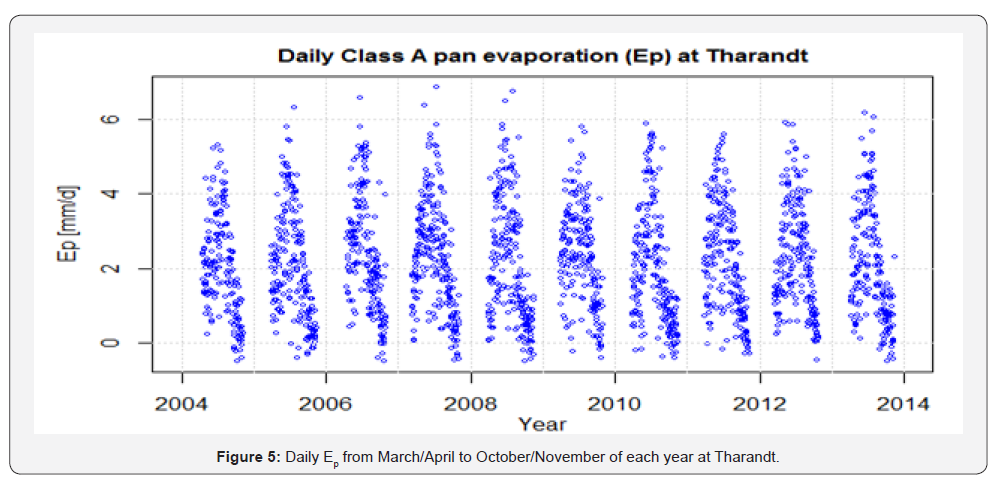
As discussed in the above sections, daily Class-A pan evaporation (Ep) is calculated using daily Ep at 7 a.m. values for n = 2098 days from March/April to October/November. Accordingly, the daily Ep resulted in average, extreme maximum and extreme minimum values of approximately 2.16, 6.87 and -0.50mm d-1, respectively. Throughout the 2004 to 2013 period, it was above 6mm d-1 for only 8 days (see Figure 5).
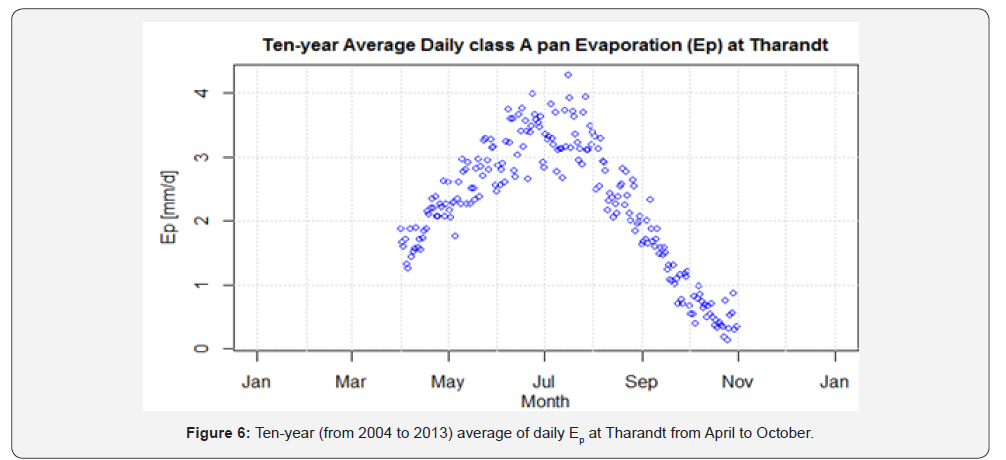
The ten-year daily average Ep calculated from April to October (see Figure 6) was approximately between 3 and 4mm d-1 from mid of May to mid of August except for one day in July where it was around 4.28mm d-1. In the rest of the months it was between 3 and 1mm d-1 except from mid of September to October where it declined to between 1 & 0.14mm d-1.
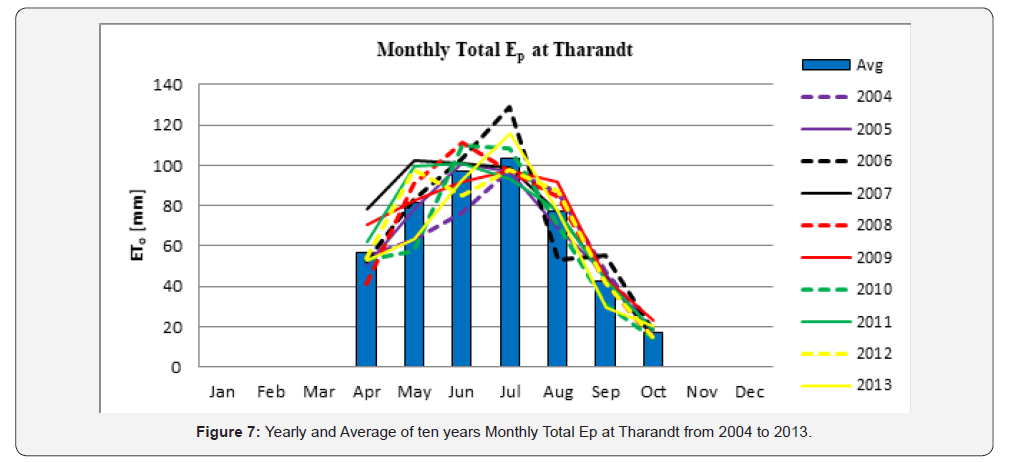
As shown below in Figure 7, the monthly total Ep calculated from April to October had the highest value in July (103.2mm) followed by June (97.3mm), May (81.8mm) and August (77.4mm). The least value of Ep was in October (17.3mm) followed by September (42.4mm) and April (57.0mm). Figure 7 also shows that the peak value was in July for five years, in June for four years and in May for one year.
Understanding Epd (for case B)
Epd (daily Ep at 7 a.m. minus daily Ep at midnight) means a next day (Day n+1) ‘night time’ Ep minus a previous day (Day n) ‘night time’ Ep (see Figure 1). Note that ‘night time’ is used in this thesis to represent the time from midnight to 7 a.m.
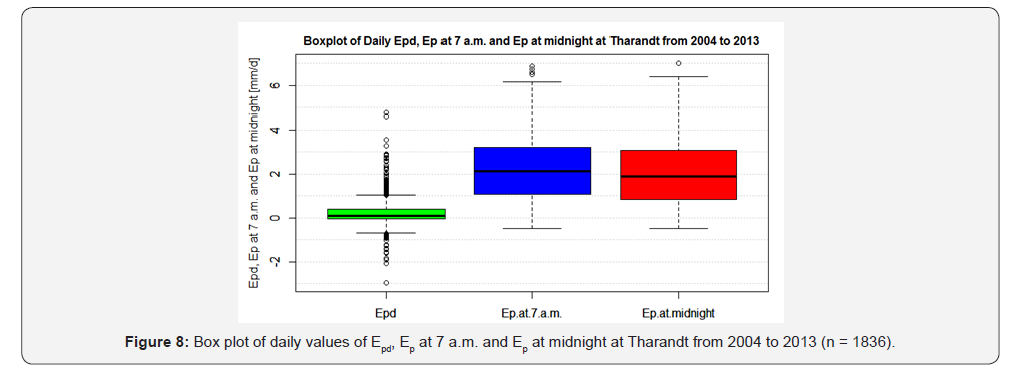
Like Table 3, Figure 8 & 9 graphically show that there was a general ‘good’ relationship between Ep at 7 a.m. and Ep at midnight; Epd was between ±1 mm d-1 for majority of the days. Daily Epd was > 1 and < -1mm d-1 for 107 and 14 days, respectively.

In Figure 10 the regression line shows only a slight increment in Epd. The increase was very small; from about 0.1mm to 0.4mm. That means an increase of around 0.3mm per 10 years. Moreover, R2 was too low. Thus, the trend (existence of a systematic increase or decrease) of Epd can be neglected.

If all other conditions are constant or if instrument and calculation errors are negligible, Epd shows the ‘night time’ difference of Ep (in mm d-1) between two consecutive days. Also, because:
1. there was no a systematic significant trend, shift or lag (Figure 9 and Figure 10);
2. daily Ep at 7 a.m. and at midnight have good correlation (R2 = 0.87); and
3. Epd > 1.5mm d-1 for 48 days and < -1.5mm d-1 for 6 days; it can be concluded that the ‘night time’ daily Ep had to be greater than 1.0mm d-1 for 54 days.
Conclusion
The accuracy of the self-recording ten-minute and daily water level measurements from Class-A pan at Tharandt from 2004 to 2013 could be considered as very good. However, the accuracy of the pressure sensor instrument which is used to automatically measure Class-A pan water level shall be carefully checked for the available daily and ten-minute measurements; it might have sensitivity to other than pressure or water depth difference in the pan. Hence, the sensitivity of the pressure sensor instrument at 7 a.m. and at midnight for same pressure (depth of pan water) might have slight difference.
Missing values of daily Ep at 7 a.m. can be filled using 0.908 × daily Ep at midnight values + 0.385 (Eq. 7). In Eq. 7, the cause for non-zero offset (0.385) could be instrument error. Assuming no instrument error, at Tharandt from 2004 to 2013, out of 1836 days, Epd was larger than zero for 1184 days (64.5% of the days). It is also concluded that the ‘night time’ daily Ep had to be ≥ 1.0mm d-1 for 54 days. The existence of ‘night time’ Ep might have made the comparison of Ep at 7 a.m. and Ep at midnight a bit complicated.
The sensitivity of the automatic Class-A pan water level measuring instrument to other than pressure (water depth difference in the pan) must be checked. If there was no measurement error and if ‘night time’ Ep is negligible, then the question: ‘Why Ep at 7 a.m. is greater than Ep at midnight for majority (65%) of the days?’ may require further study.
Acknowledgment
For every good thing, I praise GOD and GOD’S MOTHER above all. I particularly thank Virgin Mary or ‘Tsadkane Mariam’ (ፃድቃኔ ማርያም) monastery of Ethiopia for I get healings!
Very special thanks to my official supervisors Prof. Dr. Christian Bernhofer and Dr. Uta Moderow for their excellent supervision, for providing me all the needed data in advance, and for their friendly approach throughout my research. Very special thanks to Mr. Endalkachew Bekele for giving me valuable guidance and for editing the text for publishing. I also thank Mr. Thomas Pluntke, Mr. Philipp Körner and their colleague(s) for their support and for providing me meteorological data.
I also want to thank all my elementary and high school teachers especially my mathematics teachers Mrs. Abebech (‘Tiye Abebech’) and Mr. Abebe (‘Gash Abe’). I also want to use this chance to thank all kind persons who (have) supported me in my life.
Last but the best, I would like to thank my wife and my family and friends for their crucial support and for sharing love and happiness throughout my life.
To
Know More About International Journal of Environmental Sciences & Natural
Resources Please Click on:
https://juniperpublishers.com/ijesnr/index.php


No comments:
Post a Comment