Environmental Sciences & Natural Resources-Juniper Publishers

Abstract
This study evaluated the Impact of oil pollution on Kolo Creek wetlands by examining the concentration of hydrocarbons and heavy metals in the ecosystem. Standard methods for investigating environmental quality were applied in this study using surface water, sediments and biota as proxies. Three sites (A, B, C) were chosen for this study. Significant pH and high regional salinity values, especially in Site B, were found. Also, PAHs, BTEX and most metals were absent in the water column apart from cadmium which occurred above acceptable standards for both aquatic ecosystem and livestock feeding. In the sediments, BTEX were not detected while low concentrations of naphthalene (0.01 and 0.1 mg/L) were found. Lead, zinc, chromium and nickel had low levels although zinc showed a higher level in the site directly impacted by oil spill. Concentrations of Cr, Pb, Ni, Mn and Zn were at levels where no harm is expected; cadmium was far above the PEC limits, and Potential Ecological Risk Index (PERI) showed that the wetland is at an ultra high ecological risk level. Index of Geo-accumulation calculation revealed that the swamp is very highly polluted by manganese. While Nickel, chromium, cadmium and lead were above permissible limits in fish, only cadmium was above allowable limits in the water snail. PAHs also occurred in biota at a level where only 1 in 10,000 or fewer persons will be exposed to cancers. We also found that there is no statistically significant difference in contamination levels among the three study sites and that the wetland ecosystem does not meet the standards for a healthy ecosystem. Continuous and stringent monitoring of the environment; control in the discharge of solid and liquid waste especially upstream of the wetlands are among recommendations.
Keywords: Clarias Macromystax; Ecological Risk, Niger Delta; Oil Pollution; Parachana Obscura; Pi!a Ovata; Sediment Quality; Water Quality
Abbreviations: PERI: Potential Ecological Risk Index; PAHs: Polycyclic Aromatic Hydrocarbons; BTEX: Benzene, Toluene, Ethylbenzene and Xylene; AAS: Atomic Absorption Spectrophotometer; SQGs: Sediment Quality Guidelines; TEC: Threshold Effect; PEC: Probable Effects Concentration; CBSQG: Consensus-Based Sediment Quality Guidelines; SEL: Severe Effects Level; PEL: Probable Effects Level; ERM: Effect Range- Median
Introduction
Oil has been produced from the Nigeria's Niger Delta area since 1958 when oil was discovered in Oloibiri in present Bayelsa State two years earlier. The Niger Delta covers 20,000 km2 within wetlands of 70,000 km2 formed primarily by the deposition of sediments by the River Niger and her distributaries and other adjoining river systems like the Orashi, New Calabar, the Imo, Qua Iboe and Cross River systems. The Niger Delta of Nigeria is the largest wetland and maintains the third- largest drainage basin in Africa. The region is experiencing a wanton destruction of her wetland ecosystems due to the carelessness of the oil industry. The Nigerian National Petroleum Corporation had stated thus as far back as 1983: "We witnessed the slow poisoning of the waters of this country and the destruction of vegetation and agricultural land by oil spills which occur during petroleum operations. But since the inception of the oil industry in Nigeria, more than twenty-five years ago, there has been no concerned and effective effort on the part of the government, let alone the oil operators, to control environmental problems associated with the industry" [1-5].
Wetlands are areas where water is the force controlling the environment and associated plant and animal life. They occur where the water table is at or near the surface of the land, or where the land is covered by shallow water and includes "areas of marsh, fen, peat land or water, whether natural or artificial, permanent or temporary, with water that is static or flowing, fresh, brackish or salt, including areas of marine water the depth of which at low tide does not exceed six metres". This "may incorporate riparian and coastal zones adjacent to the wetlands, and islands or bodies of marine water deeper than six metres at low tide lying within the wetlands". The greatest threat to the benefits and services of the wetlands in the Niger Delta of Nigeria is oil pollution [6]. Oil pollution from the exploration and exploitation activities of multinationals and currently the activities of oil thieves is destroying vast areas of the Niger Delta environment. Oil exploitation and exploration activities prevalent in the upper and lower reaches of this coastal ecosystem have caused untold environmental damage to the Niger Delta area. This has led to species extinction, biodiversity loss and threat to very existence of man in the study area through the introduction of dangerous chemicals and elements into the ecosystem which ends up being up- taking by man through bio-accumulation in the food chain.
The Kolo Creek area has played host to oil exploration and exploitation activities since the 1950s. Today it is one of the areas endemic with oil production facilities including flow lines, gas turbines, numerous oil and gas wells, oil manifolds and pipelines. Pollution by oil and gas production includes deliberate discharge of drilling wastes including cuttings, waste water, drilling mud, cement slurry, acid stimulation residue, oil-water separation effluents, sewage effluents, waste crankcase oil, leaking pipes, vessels, fuel tanks, oil blow-out, gaseous effluents into the environment [7].
As a result of oil exploration activities in the area, drilling fluid, oily wastewaters and spilt oil at various times which contain many potentially dangerous pollutants are discharged into the environment. Such pollutants include heavy metals and Polycyclic Aromatic Hydrocarbons (PAHs) and BTEX (benzene, toluene, ethylbenzene and xylene) which are carcinogenic in nature which ultimately finds their way into surface waters that are used by man and are natural habitats for biota (ASTDR, 1995). The Kolo Creek oil fields around Imiringi in Ogbia Local Government Area of Bayelsa State (Figure 1). Nigeria is a vast freshwater wetland providing several services and livelihood opportunities to inhabitants ofthe area including fishing, farming, palm wine tapping and collection of timber and non-timber forest products. This area also suffer incessant oil spills which not only affects ecosystem services but may also influence the health of the inhabitants who depend on these polluted wetlands for fish, food and other consumable forest products [8-10]. Only recently (April 2015), an oil spill occurred in Imiringi swamps from an oil facility along the Yenegoa-Imiringi Road discharging unknown quantities of hydrocarbons into the wetland system and destroying vast areas of the freshwater wetlands. It has become expedient therefore to not only investigate the extent of damage to this ecosystem but to ascertain the levels of dangerous elements and chemicals in the environmental segments of the Kolo Creek wetlands through proxies of water, sediments and biota. This has informed this study.

Study Area
Location and Economic Activities
The Kolo Creek area as defined by this study included all those communities around the Kolo Creek where oil exploration and exploitation activities are ongoing in the Ogbia Local Government Area of Bayelsa State Nigeria (Figure 1) It is located within longitudes 4 55 52.25 N and 4 55 31.92N and latitudes 6 20 11.94 E and 6 24 50.70 E including the towns of Imiringi, Otuasega, Elebele, Orom and Ayon. The Kolo Creek oil and gas field is located within Imiringi town area and situated about 10km east of Yenagoa, the capital city of Bayelsa State. The major economic activity in the area is related to the oil industry business which is operated by SPDC. Kolo Creek flow station is the major oil and gas facility in Bayelsa State, which uses about 30% of its associated gas to generate electricity in the state [11]. The Kolo Creek Field hosts some oil facilities including 46 oil wells, one flow station (Kolo Creek), one manifold and one SPDC camp site. The other economic activities include subsistence agriculture, artisanal fishing, palm wine tapping and processing and basic commerce.
Temperature and Rainfall
The area lies within the rainforest belt of the eastern Niger Delta of Nigeria. It is within the tropical wet (Af) climate classification of Koppen. The area is characterised by sustained high temperatures and rainfall. Average temperatures are usually greater than 18 degrees Celsius while annual precipitation is greater than 1,500 mm. Precipitation occurs all year long although; there is a slight reduction in precipitation in months of August each year and between the months of December and February. Monthly temperature variations in this climate are less than 30C [12]. Daily high temperatures of up to 320C are common while night time temperatures average 220C.
Soils, Vegetation, Relief and Drainage
The Kolo Creek area is characterised by tropical rainforest and freshwater swamps that are usually flooded in most parts of the year, especially between May and November. The area is characterised by seasonal flooding and marsh forest vegetation permanently swampy and mostly flooded by fresh water. The primary vegetation in the study area is the raffia- dominated freshwater swamp vegetations while the major soil types in the area are young, shallow, poorly drained (inceptisol Aquepts) and acid sulphate soils (Sulphaquepts) [13].
The soils here may have been created by the meandering of the Kolo Creek and Elebele systems which have created silted river belt soils characterised by peaty clay water bogged soils inundated by water for most of the year. The study area is a low-lying flood plain environment with heights not more than 7 metres above sea-level. The Kolo Creek area derives its name from the Kolo Creek which is a distributaries of the Orashi River and forms the major water and material sink for the study area [14]. While the Kolo Creek occupies the flanks of the study area, the Elebele/Ekuruba stream runs through the centre of the wetlands under investigation. It forms the main discharge channel for the wetlands during the short dry season between November and April. The area is also surrounded by other natural and artificial water bodies including lakes, ponds, borrow pits and small channels that empty into the Kolo Creek or the Elebele/Ekuruba stream.
Materials And Methods
Sample Sites

of Bayelsa State Nigeria. Site A (4°54’28.04”N; 6°21’23.10”E) is an un-impacted site upstream of the Elebele/Ekuruba stream. Site B, 700m from Site A (N 4°54'9.72” N; 6°21'24.36” E), is a crude oil impacted site in the middle of the Elebele/Ekuruba wetlands located along the Agip pipeline and just a few metres behind the SPDC Manifold and pipelines. Site C, 1KM from Site A (4°54'1.37”N; 6°21'9.46”E) is a point (downstream) of the Ekuruba stream where the Agip (Nigeria Agip Oil company Ltd) pipeline crossed the Elebele/Ekuruba channel. Surface water and sediments were sampled from each site, while biota was caught randomly from the wetlands [15,16].
Methods of Data Collection
Surface Water Sampling and Analysis: Water sampling and handling followed methods established by the American Public Health Association for water and wastewater analysis. Surface water samples were collected with pre-rinsed 1litre plastic containers for the analyses of physic-chemical parameters while water samples for heavy metal analyses were collected with nitric acid pre-rinsed 1litre containers and treated with 2ml nitric acid (assaying 100%, Trace Metal Grade, Fisher Scientific) before storage. This was done to stabilise the oxidation states of metals in water. Surface water samples for oil and grease content were collected with broad-mouthed 500ml glass bottles fitted tightly with aluminium foil to prevent contamination of the samples [17-20]. Glass bottles were used in such sampling for analysis because hydrocarbons (oil) interact with plastic containers. Surface water pH, temperature, salinity, conductivity, total dissolved solids were measured by the direct method using LaMotte pocket instrument.
Determination of Heavy Metals in the Surface Waters
Surface Water Samples, previously acid treated and preconcentrated was sub-sampled for the determination of metal content by Atomic Absorption Spectrophotometry using the GBC Atomic Absorption Spectrophotometer (AAS) with detection limit of 0.05 mg/l. prior to the analysis, calibration was done with standard of known concentrations. All manipulations were done under controlled conditions to avoid contamination [21]. Dissolved metals were determined by aspirating a portion of the filtered sample (without pre-treatment) directly using the AAS. Concentration of metals were ascertained from the data generated by the AAS and expressed in mg/l. Lead, zinc, chromium, cadmium, manganese and nickel were determined using the ASTM D3559, ASTM D1691, ASTM D1687, ASTM D3557, ASTM D858 and ASTM D1886-14 respectively (Plates I-IV).


Sediment Sampling and Analysis
Sediment samples were collected by the grab method using Eckman grab samples from the 3 locations, representing approximately 2-3cm of surficial bottom sediments [22]. The samples were put into sterilized bottles and stored in the sample chest with ice, thereafter, transported to the laboratory and analyzed.
Determination of Heavy Metals in Sediments
Sediment samples for heavy metal analyses was thawed and air-dried at ambient temperature and pulverized. Two grams (2g) of air-dried sediment samples was weighed using a high precision micro scale (Tecnovetro) for each sampling site, moistened with water and put into a 50ml conical flask. To each weighed sample, 10ml of concentrated nitric acid and 2ml of concentrated perchloric acid will be added and heated with a water bath to near dryness [23]. The solution will be allowed to cool and then filtered into a 50ml volumetric flask. The solution will subsequently be made up to mark with distilled water and the concentrations of selected metals: Cd, Cr, Pb, Ni and Zn determined by Atomic Absorption Spectrophotometry using Buck Scientific Model 200A Spectrophotometer.
Ecological Risk Assessment of Heavy Metals in Sediments
The Potential Ecological Risk Index (PERI), a diagnostic tool suggested Hakanson for the analysis of contamination in lakes and coastal systems was used to calculate an ecological risk index for the Ekuruba wetlands ecosystem [24-28]. PERI is formed by three core modules: Degree of contamination (CD); toxic-response factor (Tr1); and potential ecological risk factor (Eri). The first module of PERI corresponds to the estimate of the degree of contamination (CD). The CD is expressed by the sum of the contamination factor of each metal (Cf i) as:

Where, CfI am the mean metal concentration (Ci), divided by the pre-industrial concentration of the substance :

According to Hakanson, the potential ecological risk index (PERI) is defined by:
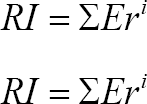
Where; RI is calculated as the sum of all risk factors for heavy metals in sediments; Erl is the monomial potential ecological risk factor;tr1 is the toxic-response factor for a given substance (e.g., Cr = 2, Mn = 1, Pb = 5, Ni = 5, Zn = 1, Cd = 30) [29].
Cf,Co,Cn and are the contamination factor, the concentration of metals in the sediment and the background reference level, respectively. International background values for metals in sediments (shale) include 0.22 mg/kg for Cd, 39 mg/kg for Cu, 68 mg/kg for Ni, 120 mg/kg for Zn, 0.85 mg/kg for Mn; 60 mg/ kg for Pb and 90 mg/kg [30].
Also proposed the following values to be used in the interpretation of ecological risks in sediments:
a) RI <150, low ecological risk for the sediment;
b) 150≤ RI <300, moderate ecological risk for the sediment;
c) 300≤ RI <600, considerable ecological risk for the sediment;
d) RI ≥600, very high ecological risk for the sediment.
In order to assess the intensity of metal contamination in the sediments of for the Ekuruba wetlands ecosystem, the geochemical accumulation index was calculated using equation 5 as proposed to quantify metal accumulation in the sediments, and represent their contamination degree [31].
This index is expressed as follows:

Where,
Igeo °9 n concentration of metal n in the silt/clay fraction, Bn is the geochemical background value of element n and 1.5 is a correction factor due to lithogenic effects, The Igeo classification entails seven grades (0 to 6) of pollution, ranging from no pollution (0) to very high pollution [32].
Biota Sampling And Analysis
Biota sampled and analysed in this study include the water snail (Pila Ovata); the catfish (Clarias macromystax); and the snake head mudfish (Parachana Obscura) as identified by Utibe (personal communication) of the department of Animal and Environmental Biology, University of Port Harcourt, Nigeria. All Matrices sampled initially were stored below 4OC before analyses in the laboratory (APHA, 2005) to avoid the degradation of the samples. The biota in this study was used because of their feeding habits which cut across the various tropic levels of the wetlands environment and their importance as sources of protein to the inhabitants of the study area.
The West African Clariid, Claries Macromystax (Plate IV), Gunther, 1864 (Osteichthyes: Clariidae) is a freshwater; demersal; benthopelagic (bottom dweller) and potamodromous (freshwater migratory) fish that dwells more in swamps and floodplains other than rivers and open channels. Primary food items include fish, insects, fruits and seeds, crustacean's plant detritus and mud. Even though the diversity of insects in the diet was more than that of fish, the latter contributed to the diet in more months (9) than insect [33]. The African obscure snakehead (Plate IV) is also a benthopelagic and potamodromous fish and thrives in harsh environments, including muddy waters. This fish lives in streams, ponds, rivers, lakes, marshes. Swamps, lagoons and floodplains, especially in waters greater than 20°C. The obscure snakehead is also known as the “sleeping fish”, as it spends much of its time motionless among the aquatic vegetation. The Obscure snakeheads are highly predacious, extremely voracious carnivores feeding on large aquatic animals such as frogs, other fishes and even aquatic snakes [34]. Adults feed primarily on other fish up to half their size, while juveniles feed on insect larvae, insects, prawns and copepods.

For the water snail (Pila Ovata) (Plate V), is found in the bottom of streams, pond, lakes and wetlands. They feed on algae and plant detritus. Ezekwe, et al. [35] had stated that the Pila ovata has been used severally and successfully in environmental monitoring studies. These snails constitute an important source of diet for most villagers especially the rural dwellers, in Africa and elsewhere in the world. Apart from serving as a source of protein, they are also used for medicinal purposes. The Pila ovata is an aquatic and their ability to bio accumulate heavy metals from algae, sediments and vegetal matter therefore makes them very good indicators of environmental quality [36].
Determination of Heavy Metals in Biota (Fish and Snail)
Fish and snail samples for metal analyses were dehydrated to a constant weight using an oven (Technicolor) at 50OC and the two fish samples (whole fish) and water snail were pulverized separately. Two grams (2g) of ground oven dried total body weight were weighed using a high precision micro scale and put in a digestion flask and digested with a mixture of 10ml of concentrated nitric acid and 2ml of concentrated perchloric acid [37-40]. The contents of the flask was, for each case, digested gently and slowly, by heating in a water bath until the contents got to near dryness. It was then set aside to cool. The digest was filtered into a 50ml volumetric flask, made up to mark with distilled water and the concentration of selected metals was determined by Atomic Absorption Spectrophotometry using Buck Scientific Model 200A Spectrophotometer
Determination of Hydrocarbons in Water, Sediments and Biota (Fish and Snail)
10ml of 5% Sodium Chloride and 30ml Ethanol were measured and added to 5g of gill and muscle samples of fish and tissue samples of snail respectively. Each mixture was refluxed for one hour, and then allowed to cool. The refluxed sample was later transferred into a separating funnel. 20ml of dichloromethane was added and shaken for 30 minutes in a mechanical shaker The mixture was allowed to separate out, and the lower layer was of the dichloromethane extract was received and used for GC- MS analysis. The standard procedure as described validated and recommended for Polycyclic Aromatic Hydrocarbons analysis was followed [41-43]. Polycyclic Aromatic Hydrocarbons was extracted from the surface waters following liquid-liquid partition with dichloromethane, sediments by Soxhlet extraction with dichloromethane and fish, crab and snail by digested alcoholic solution of Potassium hydroxide and extraction with 1,1,2-trichlorotrifluoroethane (TCTFE). The extracts will further be purified to avoid interferences by aliphatic hydrocarbons using alumina as an adsorbent in and subsequently eluted with hexane to remove aliphatic hydrocarbons. A second eluant was benzene, was used to remove the aromatic components with sufficient purity for the Capillary Gas Chromatographic analysis.
BTEX was analysed using the USEPA 8260 Method (GC/ MS). 10 ml of sample was placed in a clean VOA vial. The vial was fitted to the Agilent head space sampler and purged with the purge gas into the Agilent 7890B GC-MS for analysis. The concentration in mg/l was deduced from the calibration graph. Data collected from the field and laboratory analysis were presented using descriptive statistics, tables and charts [44-49]. The data was also subjected to critical statistical evaluation for hypothesis testing using the Friedman's Test statistics which is the non-parametric alternative to the one-way ANOVA of the sites while the Wilcoxon sign test which compared the average of the two variables (contaminants in environmental segments and international quality standards), is the non-parametric alternative to the dependent samples t-test. All statistical analyses were done using SPSS 10.00 All statistical analyses were done using the IBM SPSS 10.00 software (Plates V & VI).

Results And Discussions
Results
The results from the sampling and analysis of water, sediments and biota for this study are presented in (Table 1) (Plate VII) while sediment quality guidelines are given in (Table 2). Surfaces, or iron-stained water and Oily looking bacterial surface scum (differentiated from a hydrocarbon slick of similar appearance) [50].


Physico-Chemical Parameters of Surface Water
The pH levels of the three sites showed a high degree of acidity ranging between 4.8 and 5.86. Lowest pH levels were found at Site 2 and these fall within unacceptable limits for freshwater fish development. The salinity of the Ekuruba wetlands is also problematic, ranging between 65.8 and 125 mg/l. This is far higher than that of the neighbouring orashi River system (40mg/l) and the 40-60mg/l range of the Kolo Creek system. The rest of the physico-chemical parameters (conductivity, temperature, TDS and dissolved oxygen) were within acceptable ranges (>Table 1) [51].
Hydrocarbons in the Ekuruba Wetlands
Of the sixteen polycyclic aromatic hydrocarbons analyzed in the water samples from the three sampling sites in the wetlands, none was present. The same also goes for the BTEX indicating that the wetland as at the time of this study was free from any worrisome presence of dangerous hydrocarbons in the water column. This is not surprising because an initial clean up of petroleum impacted sites was carried out by the Shell Petroleum Development Company of Nigeria, the operator of the Kolo Creek oil and gas fields [52]. Also, PAHs and BTEX are known to be easily degraded under well oxygenated and high nutrient conditions. The dissolved oxygen levels in the water column ranged between 7.96 and 8.12 mg/l and the high level litter characteristic of these types of tropical wetlands including high temperatures and rainfall could have led to an enhanced biodegradation of spilled oil in the swamp.
BTEX was below detectable limits (< 0.001 mg/L) in the sediments. Although BTEX and PAHs were absent in the water column, low concentrations of naphthalene ranging between 0.01 and 0.1 mg/L was found in the sediments with Site B having about ten times the concentration of other sites. This may be due to oil pollution impact and the fact that due to their hydrophobic nature, PAHs entering the aquatic environment exhibit a high affinity for suspended particulates in the water column. As PAHs tend to sorbs to these particles, they are eventually settled out of the water column onto the bottom sediments. Thus, the PAH concentrations in water are usually quite low relative to the concentrations in the bottom sediments.
From (Table 1) we realized that although naphthalene was found in all the sites, highest concentration (0.1 mg/kg) was found at the petroleum impacted site which is below the TEC level (0.176 mg/kg) of the CBSQG. Naphthalene is an organic compound with formula C10H8. It is the simplest polycyclic aromatic hydrocarbon, and is a white crystalline solid with a characteristic odour that is detectable at concentrations as low as 0.08 ppm by mass. It reacts with alkali metals (sodium and potassium) to form dark blue-green radical anion salts such as sodium naphthalenide. This may be the reason for the unusually high salinities (by regional standard) characteristic of the Ekuruba wetlands (Figure 3) shows the concentration of pollutants in fish and the water snail and its comparism with international food safety standards [53]. While BTEX were absent PAHs occurred at a level where only 1 in 10,000 and 1 in a 100, 000 persons will be exposed to cancers.

Heavy Metals in the Ekuruba Wetlands
All the heavy metals tested where also largely absent in the water column apart from cadmium that occurred in the three sites at almost the same level of concentration (0.62 -0.64) indicating either natural sources or widespread pollution in the wetlands. In the sediments, Lead also had very low levels ranging between 0.831 and 0.962 (Table 2). There were however significant concentrations of Zinc (23.6-59.9); Nickel (11.112.948); chromium (23.929-24.388); Cadmium (62.28-63.05) and Manganese (27.96-64.17). While chromium, nickel, lead and cadmium had almost uniform concentrations in the sampled sites, zinc and manganese showed a high level of variability among sites. While manganese increased progressively and linearly from upstream to downstream, zinc showed a higher concentration in the site directly impacted by oil spill. Zinc concentrations may therefore be a valid indicator of oil pollution in freshwater wetlands. (Figure 3) shows the concentration of pollutants in the sediments of the Ekuruba wetlands. Contaminant levels in the sediments of the study area were compared with the consensus- based sediment quality guidelines (Table 2).
Cr, Pb, Ni, Mn and Zn were therefore at concentrations below TEC, while cadmium levels were far above the probable effects concentrations-PEC (5.0 mg/kg dry wt) of CBSQG. The PEC is the concentrations above which harmful effects are likely to be observed. In fish, Nickel, chromium, cadmium and lead (EC, 2006) were above permissible limits in the fish samples while only cadmium (EC, 2006) was above permissible limit in the water snail (Table 3) while PAHs also occurred at a level where only 1 in 10,000 and 1 in a 100, 000 persons will be exposed to cancers.

Discussion
Ecological Importance of Water Quality
The usual range of pH for streams and other aquatic ecosystems is between 6 and 8. An increase in acidity results in a lower pH and the greater the deviation from the normal range, the less life the water can support. Maintaining a stable, moderate pH is critical for wetlands because they serve as fish and amphibian breeding grounds (NDES, 2011; Juanita College, n.d). The acidity of the Ekuruba wetlands may not be unconnected with an actual acid sulphate soil situation. Conditions indicating acid sulphate situations in tropical freshwater wetlands were fully described in Doer (2006). These include:
a) Water of pH < 5.5 (and particularly below 4.5) in surface water bodies, drains or groundwater (this is not a definitive indicator as organic acids may contribute to low pH in some environments such as Melaleuca swamps).
b) Unusually clear or milky blue-green water flowing from or within the area (aluminium released by ASS acts as a flocculating agent).
c) Extensive iron stains on any drain or pond surfaces, or iron-stained water and ochre deposits.
d) Oily looking bacterial surface scum (differentiated from a hydrocarbon slick of similar appearance).
A closer look at plate II and especially plate VII reveals conditions described by DoER 2006) for surface waters or freshwater wetlands affected by acid sulphate soils. Although, these levels of salt concentration is within the tolerable limit of most freshwater fish increasing salinities will adversely affect riverine ecosystems in many different ways. These can include changes in community structure (i.e. loss of aquatic biodiversity), breakdown in food webs, shift in community composition to more tolerant species, alterations to normal ecosystem function through reduction in nutrient cycling and metabolism resulting in changes to the physical and chemical parameters of waters. It should be noted that salinity increased from local ranges in Site A to abnormally high concentrations in Site B in the middle of the swamp where oil spills had occurred through to the channel outlet downstream.
According to UNEP cadmium sulphate and cadmium chloride are quite soluble in water, whereas elemental cadmium, cadmium oxide and cadmium sulphide are almost insoluble. Cadmium complication with chloride ion increases with salinity until, in typical seawater, cadmium exists almost entirely as chloride species. The complication of cadmium with chloride in seawater has been shown to significantly influence its bioavailability and hence toxicity to marine organisms. It is most probable that chloride complication is responsible for the reduced cadmium accumulation and toxicity in a variety of organisms observed with increasing salinities. Cadmium mobility in aquatic environments is enhanced by low pH, low hardness, low suspended matter levels, high red ox potential and low salinity. In natural water bioavailability of cadmium is reduced through sorption on suspended particles so that biological responses occur at higher cadmium levels. In aquatic systems, cadmium is most readily absorbed by organisms directly from the water in its free ionic form while river water contains dissolved cadmium at concentrations of between < 1 and 13.5 ng/L while high fractions of dissolved cadmium are found in acid waters. Low pH levels, low suspended matter in freshwater forest water and probably high red ox potential could have concentrated cadmium in the Kolo Creek Wetlands system.
Environmental and health guidelines and standards for cadmium for freshwater is 0.2 ng/L. or 0.0002 mg/L and 0.01 mg/L for livestock drinking water. The water in the Ekuruba wetland is therefore dangerously contaminated with cadmium above acceptable standards for both the aquatic ecosystem and livestock. This poses a great danger to the aquatic environment, animals and man. It is important to state here that herdsmen were sighted during the fieldwork taking their herds to the wetlands for grazing and drinking water. It has also been reported that at concentrations as low as 0.01 mg/L cadmium inhibits ion transport systems and induces metallothionein synthesis in freshwater fish at concentrations less than (<) 0.001 mg/L. Cadmium toxicity has been found to be variable in fish, with salmonids being particularly susceptible to cadmium. Sub- lethal effects in fish, notably malformation of the spine, have been reported. The most susceptible life-stages are the embryo and early larva, while eggs are the least susceptible.
Ecological Importance of Sediment Quality
According to the Wisconsin Department of Natural Resources-WDoNR, these guidelines are the most recent development in Sediment Quality Guidelines (SQGs) since it combines the geometric mean of several sets of SQGs to yield a consensus based lower (Threshold Effect-TEC) and an upper (Probable Effects Concentration-PEC). Although, these values may not predict toxicity related to specific contaminant levels in the gradient between the TEC and the PEC, they are valuable in predicting the absence or presence of sediment toxicity at concentrations that are lower than the TEC or greater than the PEC values. The TEC and PEC values in the SQGs define three ranges of concentrations for each contaminant (> TEC; < TEC but < PEC; and > PEC). In assessing the reliability of comparing these values to incidence of toxicity to sediment dwelling organisms, it's been shown that there is a consistent and incremental increase in toxicity with increasing chemical concentrations. The TEC part of the Consensus-Based Sediment Quality Guidelines (CBSQG) was derived by combining the lowest effect level, LEL, threshold effect level, TEL, the effect range- low, ERL and the chronic equivalent partitioning threshold, SQAL- sediment quality advisory level, of previous studies. The PEC part on the other hand was derived by combining the Severe Effects Level- SEL, Probable Effects Level-PEL, Effect Range-Median-ERM and the toxic effect threshold, TET of other studies.
From (Table 1), we realized that although naphthalene was found in all the sites, highest concentration (0.1 mg/kg) was found at the petroleum impacted site which is below the TEC level (0.176 mg/kg) of the CBSQG. Naphthalene is an organic compound with formula C10H8. It is the simplest polycyclic aromatic hydrocarbon, and is a white crystalline solid with a characteristic odour that is detectable at concentrations as low as 0.08 ppm by mass. It reacts with alkali metals (sodium and potassium) to form dark blue-green radical anion salts such as sodium naphthalenide. This may be the reason for the unusually high salinities (by regional standard) characteristic of the Ekuruba wetlands.
Exposure to cadmium could induce the synthesis of a low molecular weight protein called metallothionen, which can then bind with cadmium and decrease its toxicity. This generally takes place in the liver of fish and humans. But if the cadmium concentration is high, the metallothionen detoxification system can become overwhelmed and the excess cadmium will be available to produce toxic effects. The effects of cadmium on aquatic organisms can be directly or indirectly lethal and can impact populations and ecosystems as well as individuals. Skeletal deformities in fish can result in impaired ability of the fish to find food and to avoid predators; hence, this sub lethal effect becomes a lethal effect. Cadmium impairs aquatic plant growth. This affects the entire ecosystem because green plants are at the base of all food chains. When aquatic plants that are exposed to cadmium do not grow normally, there will be less food available for aquatic animals. Cadmium effects on human health include skeletal deformities and bone loss, kidney damage, and generalized pain.
Potential Health Effects of Contaminants in Fish
The following ecological indices were derived for the wetlands:
Potential ecological risk for the wetland was derived as follows by calculating Degree of contamination

And Potential Ecological Risk Index (PERI)

Therefore the sediments of the Kolo Creek wetlands pose an ultra high ecological risk level to biota in the ecosystem. Also, calculating the Index of Geo-accumulation for the wetland returned the following indices: Zn = 0.0391; Ni = 0.05; Pb = 0.016; Cr = 0.046; Cd = 0.13 and Mn = 5.572. Therefore using the geochemical accumulation index as proposed, we conclude that the wetland is very highly polluted by manganese and unpolluted by other metals. This disparity between the various ecological risk indices calls for a review of these indices, also, it goes to show the importance of synergy in not using only one index. Applying the Geoaccumulation Index helped us to discover serious manganese pollution in the wetlands. Although literature on the toxicity of manganese to aquatic biota is scarce, the WHO opines that high frequency of blue crabs (Callinectes sapidus) with shell disease (lesions) in a metal- contaminated estuary was ascribed to manganese toxicity, and the deposition of manganese dioxide on the gills of Norway lobster (Nephrops norvegicus) gave rise to a brown or black discoloration of the gills and black corroded areas on the carapace following hypoxic conditions in the southeast Kattegat, Sweden. Increased mortality of rainbow trout (Oncorhynchus mykiss) at a hatchery was found to be positively correlated with manganese concentration (<0.5-1 mg/litre). Acid precipitation has caused acid episodes and elevated levels of metals. Cage experiments with yearling brown trout (Salmo trutta) showed that pH of 4.5-5.4 (which is similar to the pH of surface water in the wetlands of our study area) and the concentration of labile inorganic manganese (0.1-0.4 mg/litre) explained all of the observed mortality in the specimens.
Hypothesis Testing
Two hypotheses were tested in course of this study and they are stated in null form thus:
H0: There is no statistically significant difference between polluted and unpolluted sites in the Kolo Creek wetlands. H0: The wetland ecosystem does not meet the standard for a healthy (Table 4) was derived by a combination of all the contaminants in the water column and sediments of the three sites as variables and analysing for difference. The Friedman's Test statistics revealed that there is no statistically significant difference in contamination levels in the three locations, x2 (2) = 0.581, p = 0.748. Since the p value (0.748) is bigger than a (0.05) we ACCEPT the null hypothesis of no difference. Table 5 shows the concentration of different contaminants in the various segments of the environment and the environmental standard values they are compared with while Table 6 shows the Wilcox on sign test which compared the average of the two variables. The test statistic simply proved that the wetland ecosystem does not meet the standard for a healthy ecosystem (Z = -785, p = 0.433). Since the p value (0.433) is bigger than a (0.05) we accept the null hypothesis that the wetland does not meet the standards for a healthy ecosystem.

a. Friedman Test


Recommendations
This study hereby recommends continues and stringent monitoring of environmental segments in the wetlands; a need for control in the discharge of solid and liquid waste especially upstream of the Kolo Creek wetlands; application of international environmental standards in the sitting and management of the oil production facilities in the study area and community environmental health education on the dangers of consuming fish and other products from the wetlands.
To know more about Journal of Environmental Sciences & Natural Resources
Click here: https://juniperpublishers.com/ijesnr/index.php
To know more about Journal of Environmental Sciences & Natural Resources
Click here: https://juniperpublishers.com/ijesnr/index.php


No comments:
Post a Comment